How can I help you?
Mind Map layout in Angular Diagram control
23 Aug 202512 minutes to read
A mind map is a powerful visualization technique that organizes information around a central concept, with related topics branching outward in a tree-like structure. This layout is particularly useful for brainstorming, knowledge mapping, and hierarchical data representation. The Angular Diagram component supports mind map layouts through the type property, which should be set to MindMap.
Prerequisites
To use mind map layout functionality, you must inject the MindMap module into the diagram component:
import { MindMap } from '@syncfusion/ej2-angular-diagrams';
Diagram.Inject(MindMap);
Mind Map Orientation
The orientation property determines how the mind map tree structure is arranged spatially. By default, the orientation is set to Horizontal, positioning the root node centrally with branches extending left and right.
The following code example demonstrates how to create a mind map layout:
import { NgModule } from '@angular/core'
import { BrowserModule } from '@angular/platform-browser'
import { DiagramModule, MindMapService, DataBindingService, DataBinding } from '@syncfusion/ej2-angular-diagrams'


import { Component, OnInit, ViewEncapsulation, ViewChild } from '@angular/core';
import {
  DiagramComponent, Diagram, NodeModel, ConnectorModel, MindMap, LayoutModel, DataSourceModel,
  TextModel, DecoratorModel, ShapeStyleModel
} from '@syncfusion/ej2-angular-diagrams';
import { DataManager, Query } from '@syncfusion/ej2-data';

Diagram.Inject(DataBinding, MindMap);

@Component({
  imports: [DiagramModule],

  providers: [MindMapService, DataBindingService],
  standalone: true,
  selector: "app-container",
  template: `<ejs-diagram #diagram id="diagram" width="100%" height="580px" [getNodeDefaults]="getNodeDefaults"
  [getConnectorDefaults]="getConnectorDefaults" [layout]="layout" [dataSourceSettings]="dataSourceSettings"> </ejs-diagram>`,
  encapsulation: ViewEncapsulation.None
})

export class AppComponent {
  @ViewChild("diagram")
  public diagram?: DiagramComponent;
  public items?: DataManager;
  public layout?: LayoutModel;
  public dataSourceSettings?: DataSourceModel;

  //Initializes data source
  public data: Object[] = [
    {
      id: 1,
      Label: 'StackPanel'
    },
    {
      id: 2,
      Label: 'Label',
      parentId: 1
    },
    {
      id: 3,
      Label: 'ListBox',
      parentId: 1
    },
    {
      id: 4,
      Label: 'StackPanel',
      parentId: 2
    },
    {
      id: 5,
      Label: 'Border',
      parentId: 2
    },
    {
      id: 6,
      Label: 'Border',
      parentId: 4
    },
    {
      id: 7,
      Label: 'Button',
      parentId: 4
    },
    {
      id: 8,
      Label: 'ContentPresenter',
      parentId: 5
    },
    {
      id: 9,
      Label: 'Text Block',
      parentId: 5
    },
  ];

  //Sets the default properties for all the Nodes
  public getNodeDefaults(node: NodeModel): NodeModel {
    node.annotations = [{ content: (node.data as { Label: 'string' }).Label }];
    node.width = 100; node.height = 40;
    return node;
  }

  //Sets the default properties for all the connectors
  public getConnectorDefaults(connector: ConnectorModel): ConnectorModel {
    connector.type = 'Orthogonal';
    return connector;
  }

  ngOnInit(): void {
    this.items = new DataManager(this.data as JSON[], new Query().take(7));

    //Uses layout to auto-arrange nodes on the Diagram page
    this.layout = {
      //Sets layout type
      type: 'MindMap',
      orientation: 'Horizontal'
    }

    //Configures data source for Diagram
    this.dataSourceSettings = {
      id: 'id',
      parentId: 'parentId',
      dataSource: this.items,
      root: String(1)
    }
  }
}
import { bootstrapApplication } from '@angular/platform-browser';
import { AppComponent } from './app.component';
import 'zone.js';
bootstrapApplication(AppComponent).catch((err) => console.error(err));The following table outlines the available orientation options:
| Orientation Type | Description |
|---|---|
| Horizontal | Arranges the mind map with the root node centered, branches extending horizontally left and right |
| Vertical | Arranges the mind map with the root node at the top or center, branches extending vertically up and down |
Mind Map Branch Control
The mind map layout provides flexible branch positioning through the getBranch method. This method allows you to control which side of the root node each branch appears on, enabling customized layouts based on your specific requirements.
The getBranch method receives a node object as a parameter and should return a string value indicating the desired branch position: 'Left', 'Right', or 'SubLeft'/'SubRight' for nested branches.
The following code example shows how to position all branches on the right side of the mind map:
import { Component, ViewEncapsulation, ViewChild } from '@angular/core';
import { DiagramComponent, Diagram, NodeModel, ConnectorModel, MindMap, LayoutModel, DataSourceModel, DiagramModule,
  MindMapService, DataBindingService, DataBinding, SnapSettingsModel } from '@syncfusion/ej2-angular-diagrams';
import { DataManager, Query } from '@syncfusion/ej2-data';

Diagram.Inject(DataBinding, MindMap);

@Component({
  imports: [DiagramModule],

  providers: [MindMapService, DataBindingService],
  standalone: true,
  selector: "app-container",
  template: `<ejs-diagram #diagram id="diagram" width="100%" height="580px" [layout]="layout" [getNodeDefaults]="getNodeDefaults"
  [getConnectorDefaults]="getConnectorDefaults" [dataSourceSettings]="dataSourceSettings" [snapSettings]="snapSettings"> </ejs-diagram>`,
  encapsulation: ViewEncapsulation.None
})

export class AppComponent {
  @ViewChild("diagram")
  public diagram?: DiagramComponent;
  public items?: DataManager;
  public snapSettings?: SnapSettingsModel;
  public layout?: LayoutModel;
  public dataSourceSettings?: DataSourceModel;

  //Initializes data source
  public data: Object[] = [
    {
      id: 1,
      Label: 'StackPanel'
    },
    {
      id: 2,
      Label: 'Label',
      parentId: 1
    },
    {
      id: 3,
      Label: 'ListBox',
      parentId: 1
    },
    {
      id: 4,
      Label: 'StackPanel',
      parentId: 2
    },
    {
      id: 5,
      Label: 'Border',
      parentId: 2
    },
    {
      id: 6,
      Label: 'Border',
      parentId: 4
    },
    {
      id: 7,
      Label: 'Button',
      parentId: 4
    },
    {
      id: 8,
      Label: 'ContentPresenter',
      parentId: 5
    },
    {
      id: 9,
      Label: 'Text Block',
      parentId: 5
    },

  ];

  //Sets the default properties for all the Nodes
  public getNodeDefaults(node: NodeModel): NodeModel {
    node.annotations = [{ content: (node.data as { Label: 'string' }).Label }];
    node.width = 100; node.height = 40;
    return node;
  }

  //Sets the default properties for all the connectors
  public getConnectorDefaults(connector: ConnectorModel): ConnectorModel {
    connector.type = 'Orthogonal';
    return connector;
  }

  ngOnInit(): void {
    this.items = new DataManager(this.data as JSON[], new Query().take(7));
    this.snapSettings = { constraints: 0 }

    //Uses layout to auto-arrange nodes on the Diagram page
    this.layout = {
      //Sets layout type
      type: 'MindMap',
      orientation: 'Horizontal',
      getBranch: (node: NodeModel) => {
        if ((node.data as any).id === 1) {
          return 'Root';
        }
        return 'Right';
      },
    }

    //Configures data source for Diagram
    this.dataSourceSettings = {
      id: 'id',
      parentId: 'parentId',
      dataSource: this.items,
      root: String(1)
    }
  }
}
import { bootstrapApplication } from '@angular/platform-browser';
import { AppComponent } from './app.component';
import 'zone.js';
bootstrapApplication(AppComponent).catch((err) => console.error(err));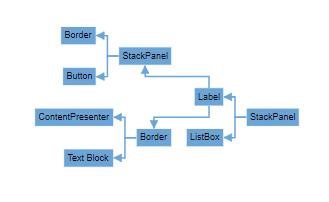
Common Use Cases
Mind map layouts are ideal for:
- Brainstorming sessions: Visualizing ideas and their relationships
- Knowledge mapping: Organizing complex information hierarchically
- Decision trees: Mapping out decision processes and outcomes
- Organizational charts: Displaying reporting structures with a central focus
- Project planning: Breaking down projects into manageable components
Best Practices
- Keep the root node content concise and descriptive
- Use consistent styling for nodes at the same hierarchical level
- Limit branch depth to maintain readability
- Consider color coding to differentiate branch categories
- Ensure adequate spacing between branches to prevent overlap