Show tooltip for row and column headers in ASP.NET CORE Pivot Table Component
2 Aug 20237 minutes to read
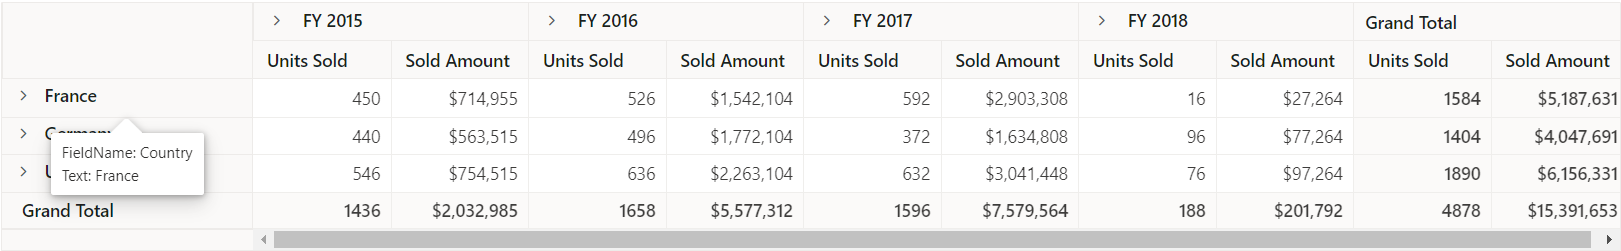
You can create and display the tooltip for each row and column header(s) in the pivot table by using an external tooltip component via the dataBound event.
<ejs-pivotview id="PivotView" height="300" dataBound="dataBound">
    <e-datasourcesettings dataSource="@ViewBag.DataSource" expandAll="false">
        <e-formatsettings>
            <e-field name="Amount" format="C0"></e-field>
        </e-formatsettings>
        <e-rows>
            <e-field name="Country"></e-field>
            <e-field name="Products"></e-field>
        </e-rows>
        <e-columns>
            <e-field name="Year" caption="Year"></e-field>
            <e-field name="Quarter"></e-field>
        </e-columns>
        <e-values>
            <e-field name="Sold" caption="Units Sold"></e-field>
            <e-field name="Amount" caption="Sold Amount"></e-field>
        </e-values>
    </e-datasourcesettings>
</ejs-pivotview>
<script>
    function dataBound() {
        var pivotObj = document.getElementById('PivotView').ej2_instances[0];
        var headerTooltip;
        if (!headerTooltip) {
            headerTooltip = new ej.popups.Tooltip({
                target: 'td.e-rowsheader,th.e-columnsheader', beforeRender: beforeRender
            });
            headerTooltip.appendTo(pivotObj.element);
        }
    }
    function beforeRender(args) {
        var pivotObj = document.getElementById('PivotView').ej2_instances[0];
        if (args.target.parentElement.querySelector('.e-rowsheader')) {
            // Here you can set custom content for row header(s) tooltip from its cell information.
            var index = Number(args.target.getAttributeNode('index').value);
            var colIndex = Number(args.target.getAttributeNode('data-colindex').value);
            var cell = pivotObj.engineModule.pivotValues[index][colIndex];
            var valueText = cell.valueSort ? cell.valueSort : '';
            if (cell.formattedText !== 'Grand Total') {
                this.content =
                    '<div>' +
                    'FieldName: ' +
                    valueText.axis +
                    '</br>' +
                    'Text: ' +
                    cell.formattedText +
                    '</div>';
            } else {
                this.content =
                    '<div>' +
                    'FieldName: ' +
                    valueText.uniqueName +
                    '</br>' +
                    'Text: ' +
                    cell.formattedText +
                    '</div>';
            }
        } else {
            // Here you can set custom content for column header(s) tooltip from its cell information.
            if (args.target.querySelector('.e-cellvalue')) {
                this.content = args.target.querySelector('.e-cellvalue').innerText;
            } else if (args.target.querySelector('.e-headertext')) {
                this.content = args.target.querySelector('.e-headertext').innerText;
            } else if (args.target.querySelector('.e-stackedheadercelldiv')) {
                this.content = args.target.querySelector('.e-stackedheadercelldiv').innerText;
            } else {
                this.content = '';
            }
        }
    }
</script>
public ActionResult Index()
{
var data = GetPivotData();
ViewBag.DataSource = data;
return View();
}