Render chart control based on cell selection
2 Aug 202314 minutes to read
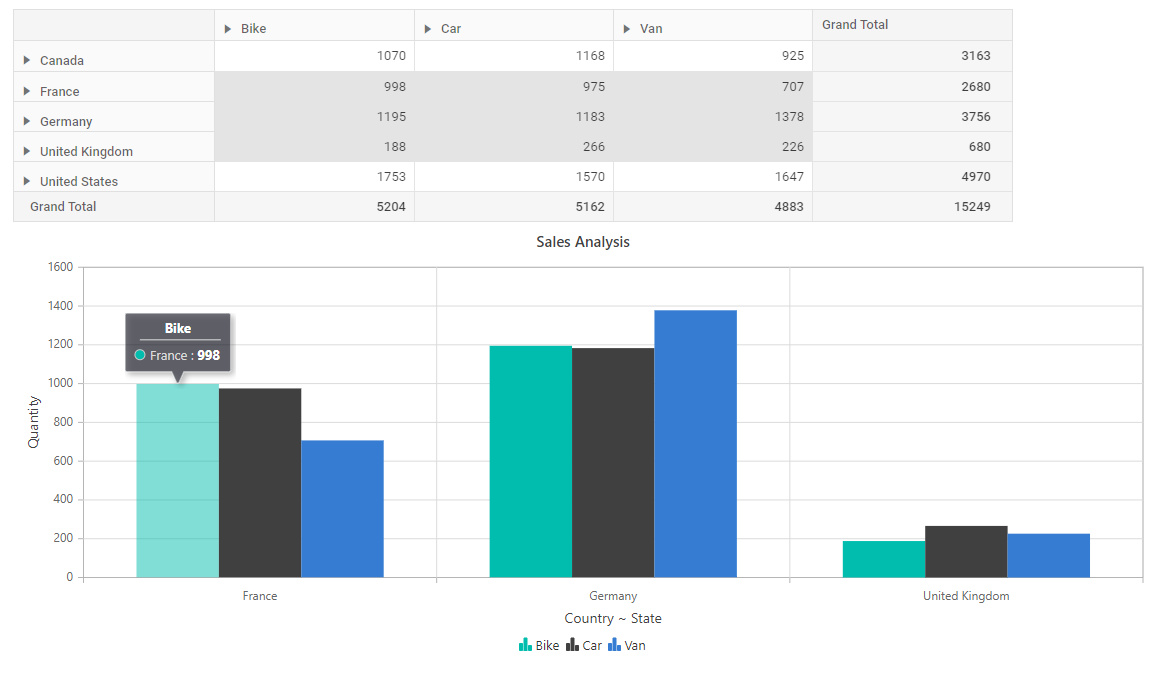
The cell selection support is enabled using the allowSelection property and its type and mode are configured using the e-selectionSettings property. The cellSelected event gets fired on every selection operation performed in the pivot table. This event returns the selected cell informations, like row header name, column header name, measure name, and value. Based on this information, the chart control will be plotted.
<div class="control-section" style="overflow:auto">
        <div class="content-wrapper">
            <ejs-pivotview id="pivotview" width="100%" height="300" load="onLoad" dataBound="onDataBound" cellSelected="onCellSelected" showTooltip="false">
                <e-datasourcesettings dataSource="@ViewBag.data" expandAll="true" enableSorting="true">
                    <e-rows>
                        <e-field name="Country"></e-field>
                        <e-field name="Products"></e-field>
                    </e-rows>
                    <e-columns>
                        <e-field name="Year"></e-field>
                    </e-columns>
                    <e-values>
                        <e-field name="Sold" caption="Units Sold"></e-field>
                    </e-values>
                </e-datasourcesettings>
                <e-gridSettings columnWidth="120" allowSelection= "true">
                </e-gridSettings>
            </ejs-pivotview>
        </div>
        <br />
        <br />
        <div id="Chart" style="height: 450px;"></div>
    </div>

<script>
        var onInit = true;
        var measureList = {};
        var chart;
        var selectedCells;
        var chartSeries;
        function dataBound() {
            var pivotObj = document.getElementById('pivotview').ej2_instances[0];
            if (onInit) {
                for (var i = 0; i < pivotObj.dataSourceSettings.values.length; i++) {
                    var value = pivotObj.dataSourceSettings.values[i];
                    measureList[value.name] = value.caption || value.name;
                }
                pivotObj.grid.selectionModule.selectCellsByRange({ cellIndex: 1, rowIndex: 1 }, { cellIndex: 3, rowIndex: 3 });
            }
        }
        function cellSelected(args) {
            selectedCells = args.selectedCellsInfo;
            if (selectedCells && selectedCells.length > 0) {
            chartSeries = frameChartSeries();
            chartUpdate();
            }
        }
        function frameChartSeries() {
                var pivotObj = document.getElementById('pivotview').ej2_instances[0];
                var columnGroupObject = {};
                for (var b = 0; b < selectedCells.length; b++) {
                    var cell = selectedCells[b];
                    if (cell.measure !== '') {
                    var columnSeries = (pivotObj.dataSourceSettings.values.length > 1 && measureList[cell.measure]) ?
                        (cell.columnHeaders.toString() + ' ~ ' + measureList[cell.measure]) : cell.columnHeaders.toString();
                    if (columnGroupObject[columnSeries]) {
                        columnGroupObject[columnSeries].push({ x: cell.rowHeaders == '' ? 'Grand Total' : cell.rowHeaders.toString(), y: Number(cell.value) });
                    }
                    else {
                        columnGroupObject[columnSeries] = [{ x: cell.rowHeaders == '' ? 'Grand Total' : cell.rowHeaders.toString(), y: Number(cell.value) }];
                    }
                    }
                }
                var columnKeys = Object.keys(columnGroupObject);
                var chartSeries = [];
                for (var c = 0; c < columnKeys.length; c++) {
                    var key = columnKeys[c];
                    chartSeries.push({
                    dataSource: columnGroupObject[key],
                    xName: 'x',
                    yName: 'y',
                    type: 'Column',
                    name: key
                    });
                }
                return chartSeries;
        }
        function chartUpdate() {
            var chart = document.getElementById('Chart').ej2_instances[0];
            var pivotObj = document.getElementById('pivotview').ej2_instances[0];
            if (onInit) {
                onInit = false;
                chart = new ej.charts.Chart({
                title: 'Sales Analysis',
                legendSettings: {
                    visible: true
                },
                tooltip: {
                    enable: true
                },
                primaryYAxis: {
                    title: pivotObj.dataSourceSettings.values.map(function (args) { return args.caption || args.name; }).join(' ~ '),
                },
                primaryXAxis: {
                    valueType: 'Category',
                    title: pivotObj.dataSourceSettings.rows.map(function (args) { return args.caption || args.name; }).join(' ~ '),
                    labelIntersectAction: 'Rotate45'
                },
                series: chartSeries,
                }, '#Chart');
            }
            else {
                chart.series = chartSeries;
                chart.primaryXAxis.title = pivotObj.dataSourceSettings.rows.map(function (args) { return args.caption || args.name; }).join(' ~ ');
                chart.primaryYAxis.title = pivotObj.dataSourceSettings.values.map(function (args) { return args.caption || args.name; }).join(' ~ ');
                chart.refresh();
            }
        }

        function onLoad() {
            if (onInit) {
                var pivotObj = document.getElementById('pivotview').ej2_instances[0];
                pivotObj.gridSettings.selectionSettings= { mode: 'Cell', type: 'Multiple', cellSelectionMode: 'Box' };
            }
        }
    </script>
public ActionResult Index()
{
var data = GetPivotData();
ViewBag.DataSource = data;
return View();
}