How can I help you?
OLAP in ASP.NET CORE Pivot Table component
29 Jan 202624 minutes to read
Getting Started with ASP.NET Core
NOTE
Starting with v16.2.0.x, if you reference Syncfusion® assemblies from trial setup or from the NuGet feed, you also have to include a license key in your projects. Refer to this link to know about registering Syncfusion® license key in your ASP.NET MVC application to use our components.
Prerequisites
The official prerequisites to create and run an ASP.NET Core 2.x application on Windows environment are described in the .NET Core documentation website.
Create ASP.NET Core web application
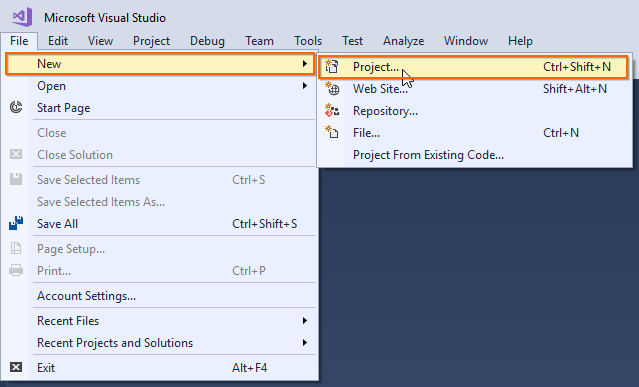
Step 1: Choose File > New > Project… in the Visual Studio menu bar.
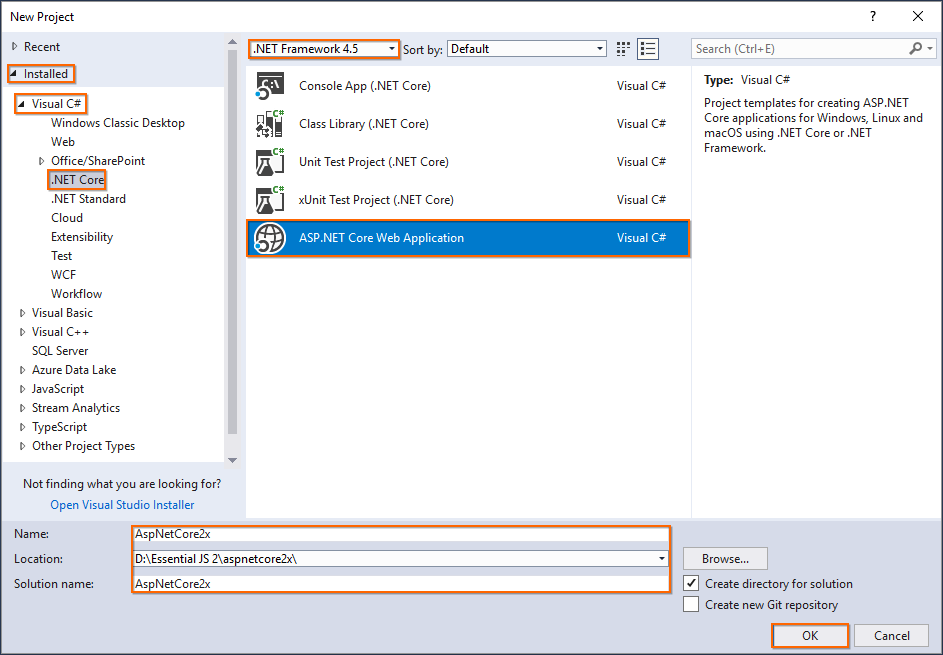
Step 2: Select Installed > Visual C# > .NET Core and choose the required .NET Framework in the drop-down.
Step 3: Select ASP.NET Core Web Application and change the application name, and then click OK.
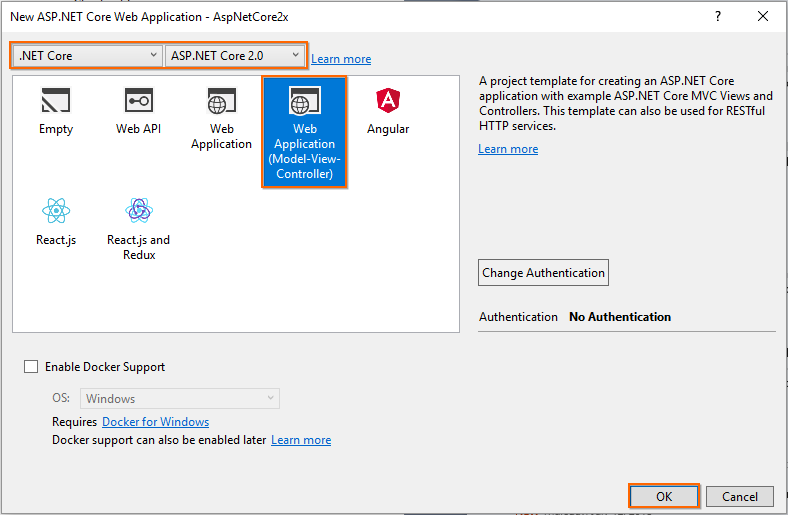
Step 4: Choose .NET Core with ASP.NET Core 2.0 and select Web Application(Model-View-Controller), and then click OK. The web application project is now created with default ASP.NET Core template.
Configure Essential® JS 2 in the application
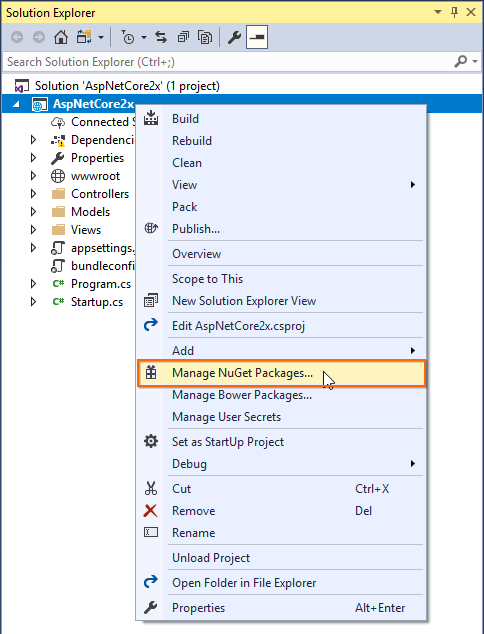
Step 1: Add the Syncfusion.EJ2.AspNet.Core NuGet package to the new application by using the Nuget Package Manager. Right-click the project and select Manage NuGet Packages….
NOTE
Refer to this article to learn more details about installing Essential® JS 2 NuGet packages in various OS environment.
Step 2: Search the Syncfusion.EJ2.AspNet keyword in the Browse tab and install Syncfusion.EJ2.AspNet.Core NuGet package in the application.
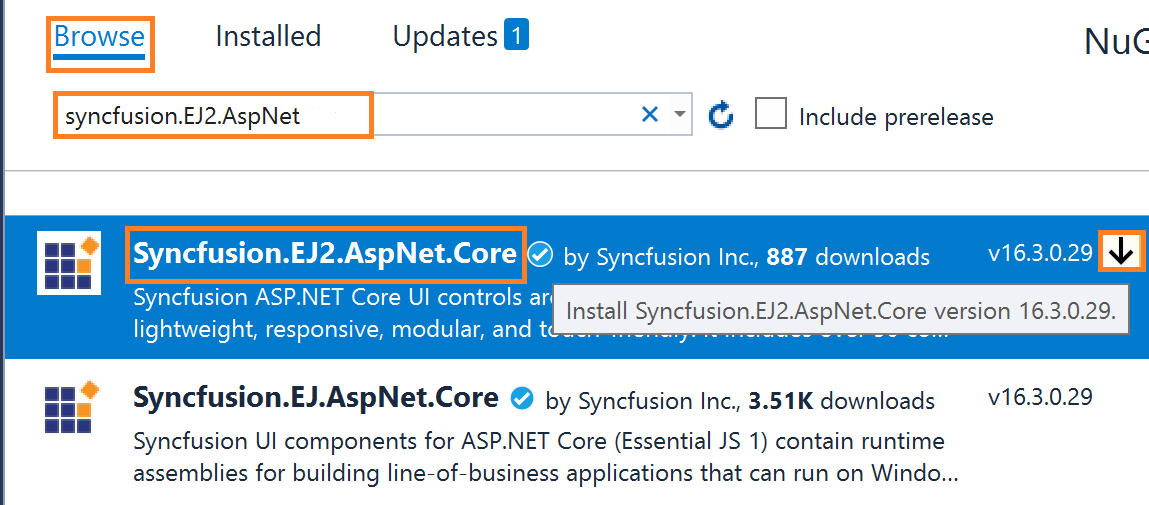
The Essential® JS 2 package will be included in the project, after the installation process is completed.
NOTE
The Syncfusion.EJ2.AspNet.Core NuGet package has dependencies,
Newtonsoft.Jsonfor JSON serialization andSyncfusion.Licensingfor validating Syncfusion® license key.
Step 3: Open ~/Views/_ViewImports.cshtml file and import the Syncfusion.EJ2 package.
@addTagHelper *, Syncfusion.EJ2Step 4: Add the client-side resources through CDN or local npm package in the <head> element of the ~/Views/Shared/_Layout.cshtml layout page.
<head>
...

    <!-- Syncfusion Essential JS 2 Styles -->
    <link rel="stylesheet" href="https://cdn.syncfusion.com/ej2/tailwind3.css" />

    <!-- Syncfusion Essential JS 2 Scripts -->
    <script src="https://cdn.syncfusion.com/ej2/dist/ej2.min.js"></script>
</head>
Step 5: Add the Essential® JS 2 Script Manager at the end of <body> element in the ~/Views/Shared/_Layout.cshtml layout page.
<body>
...
    <!-- Syncfusion Essential JS 2 ScriptManager -->
    <ejs-scripts></ejs-scripts>
</body>
Adding component to the application
Add the below code to your Index.cshtml view page which is present under Views/Home folder, to initialize the pivot table component with sample OLAP data source.
<ejs-pivotview id="pivotview" width="100%" height="600">
    <e-datasourcesettings catalog="Adventure Works DW 2008 SE" cube="Adventure Works" url="https://bi.syncfusion.com/olap/msmdpump.dll" providerType="SSAS" enableSorting="true">
        <e-rows>
            <e-field name="[Customer].[Customer Geography]" caption="Customer Geography"></e-field>
        </e-rows>
        <e-columns>
            <e-field name="[Product].[Product Categories]" caption="Product Categories"></e-field>
            <e-field name="[Measures]" caption="Measures"></e-field>
        </e-columns>
        <e-values>
            <e-field name="[Measures].[Customer Count]" caption="Customer Count"></e-field>
            <e-field name="[Measures].[Internet Sales Amount]" caption="Internet Sales Amount"></e-field>
        </e-values>
        <e-filters>
            <e-field name="[Date].[Fiscal]" caption="Date Fiscal"></e-field>
        </e-filters>
    </e-datasourcesettings>
</ejs-pivotview>
public ActionResult Index()
{
return View();
}Adding OLAP cube elements to row, column, value and filter axes
Now that pivot table is initialized and assigned with sample OLAP data source, will further move to showcase the component by organizing appropriate OLAP cube elements in rows, columns, values and filters axes.
In DataSourceSettings property, four major axes rows, columns, values and filters plays a vital role in defining and organizing OLAP cube elements from the bound data source, to render the entire pivot table component in a desired format.
rows – Collection of OLAP cube elements (such as Hierarchies, NamedSet, Calculated Members etc.,) that needs to be displayed in row axis of the pivot table.
columns – Collection of OLAP cube elements (such as Hierarchies, NamedSet, Calculated Members etc.,) that needs to be displayed in column axis of the pivot table.
values – Collection of OLAP cube elements (such as Measures, Calculated Measures) that needs to be displayed as aggregated numeric values in the pivot table.
filters - Collection of OLAP cube elements (such as Hierarchies and Calculated Members) that would act as master filter over the data bound in row, column and value axes of the pivot table.
In-order to define each OLAP cube element in the respective axis, the following basic properties should be set.
-
name: It allows to set the unique name of the hierarchies, named set, measures, calculated members etc., from the bound OLAP data source. It’s casing should match exactly like in the data source and if not set properly, the pivot table will be rendered as empty. -
caption: It allows to set the caption, which is the alias name of the unique name that needs to be displayed in the pivot table. If not provided, unique name will be displayed.
In this sample, “Product Categories” is added in column, “Customer Geography” in row, and “Customer Count” and “Internet Sales Amount” in value axes respectively.
<ejs-pivotview id="pivotview" width="100%" height="600">
    <e-datasourcesettings catalog="Adventure Works DW 2008 SE" cube="Adventure Works" url="https://bi.syncfusion.com/olap/msmdpump.dll" providerType="SSAS" enableSorting="true">
        <e-rows>
            <e-field name="[Customer].[Customer Geography]" caption="Customer Geography"></e-field>
        </e-rows>
        <e-columns>
            <e-field name="[Product].[Product Categories]" caption="Product Categories"></e-field>
            <e-field name="[Measures]" caption="Measures"></e-field>
        </e-columns>
        <e-values>
            <e-field name="[Measures].[Customer Count]" caption="Customer Count"></e-field>
            <e-field name="[Measures].[Internet Sales Amount]" caption="Internet Sales Amount"></e-field>
        </e-values>
        <e-filters>
            <e-field name="[Date].[Fiscal]" caption="Date Fiscal"></e-field>
        </e-filters>
    </e-datasourcesettings>
</ejs-pivotview>
public ActionResult Index()
{
return View();
}Applying formatting to measures
Formatting defines a way in which values should be displayed in pivot table. For example, format “C0” denotes the values should be displayed in currency pattern without decimal points. To do so, define the e-formatsettings with its name and format properties. In this sample, the name property is set as “[Measures].[Internet Sales Amount]”, a measure from value axis and its format is set as “C0”. Likewise, we can set format for other measures as well.
NOTE
Only measures from
valuesaxis, which is in the form of numeric data values are applicable for formatting.
<ejs-pivotview id="pivotview" width="100%" height="600">
    <e-datasourcesettings catalog="Adventure Works DW 2008 SE" cube="Adventure Works" url="https://bi.syncfusion.com/olap/msmdpump.dll" providerType="SSAS" enableSorting="true">
        <e-rows>
            <e-field name="[Customer].[Customer Geography]" caption="Customer Geography"></e-field>
        </e-rows>
        <e-columns>
            <e-field name="[Product].[Product Categories]" caption="Product Categories"></e-field>
            <e-field name="[Measures]" caption="Measures"></e-field>
        </e-columns>
        <e-values>
            <e-field name="[Measures].[Customer Count]" caption="Customer Count"></e-field>
            <e-field name="[Measures].[Internet Sales Amount]" caption="Internet Sales Amount"></e-field>
        </e-values>
        <e-filters>
            <e-field name="[Date].[Fiscal]" caption="Date Fiscal"></e-field>
        </e-filters>
        <e-formatsettings>
            <e-field name="[Measures].[Internet Sales Amount]" format="C0"></e-field>
        </e-formatsettings>
    </e-datasourcesettings>
</ejs-pivotview>
public ActionResult Index()
{
return View();
}Enable grouping bar
The Grouping Bar feature automatically populates OLAP cube elements from the bound data source and allows end users to drag OLAP cube elements between different axes such as rows, columns, values and filters, and change pivot view at runtime. Sorting, filtering and removing of elements is also possible. It can be enabled by setting the showGroupingBar property to true as follows.
<ejs-pivotview id="pivotview" showGroupingBar="true" width="100%" height="600">
    <e-datasourcesettings catalog="Adventure Works DW 2008 SE" cube="Adventure Works" url="https://bi.syncfusion.com/olap/msmdpump.dll" providerType="SSAS" enableSorting="true">
        <e-rows>
            <e-field name="[Customer].[Customer Geography]" caption="Customer Geography"></e-field>
        </e-rows>
        <e-columns>
            <e-field name="[Product].[Product Categories]" caption="Product Categories"></e-field>
            <e-field name="[Measures]" caption="Measures"></e-field>
        </e-columns>
        <e-values>
            <e-field name="[Measures].[Customer Count]" caption="Customer Count"></e-field>
            <e-field name="[Measures].[Internet Sales Amount]" caption="Internet Sales Amount"></e-field>
        </e-values>
        <e-filters>
            <e-field name="[Date].[Fiscal]" caption="Date Fiscal"></e-field>
        </e-filters>
    </e-datasourcesettings>
</ejs-pivotview>
public ActionResult Index()
{
return View();
}Enable pivot field list
The component provides a built-in Field List similar to Microsoft Excel. It allows you to add or remove OLAP cube elements and also rearrange the OLAP cube elements between different axes, including rows, columns, values and filters along with filter and sort options dynamically at runtime. It can be enabled by setting the showFieldList property to true as follows.
<ejs-pivotview id="pivotview" showFieldList="true" width="100%" height="600">
    <e-datasourcesettings catalog="Adventure Works DW 2008 SE" cube="Adventure Works" url="https://bi.syncfusion.com/olap/msmdpump.dll" providerType="SSAS" enableSorting="true">
        <e-rows>
            <e-field name="[Customer].[Customer Geography]" caption="Customer Geography"></e-field>
        </e-rows>
        <e-columns>
            <e-field name="[Product].[Product Categories]" caption="Product Categories"></e-field>
            <e-field name="[Measures]" caption="Measures"></e-field>
        </e-columns>
        <e-values>
            <e-field name="[Measures].[Customer Count]" caption="Customer Count"></e-field>
            <e-field name="[Measures].[Internet Sales Amount]" caption="Internet Sales Amount"></e-field>
        </e-values>
        <e-filters>
            <e-field name="[Date].[Fiscal]" caption="Date Fiscal"></e-field>
        </e-filters>
    </e-datasourcesettings>
</ejs-pivotview>
public ActionResult Index()
{
return View();
}Exploring filter axis
The filter axis contains collection of OLAP cube elements such as hierarchies and calculated members that would act as master filter over the data bound in rows, columns and values axes of the pivot table. The OLAP cube elements along with filter members could be set to filter axis either through report via code behind or by dragging and dropping OLAP cube elements from other axes to filter axis via grouping bar or field list at runtime.
<ejs-pivotview id="pivotview" allowCalculatedField="true" showFieldList="true" showGroupingBar="true" width="100%" height="600">
    <e-datasourcesettings catalog="Adventure Works DW 2008 SE" cube="Adventure Works" url="https://bi.syncfusion.com/olap/msmdpump.dll" providerType="SSAS" enableSorting="true">
        <e-rows>
            <e-field name="[Customer].[Customer Geography]" caption="Customer Geography"></e-field>
        </e-rows>
        <e-columns>
            <e-field name="[Product].[Product Categories]" caption="Product Categories"></e-field>
            <e-field name="[Measures]" caption="Measures"></e-field>
        </e-columns>
        <e-values>
            <e-field name="[Measures].[Customer Count]" caption="Customer Count"></e-field>
            <e-field name="[Measures].[Internet Sales Amount]" caption="Internet Sales Amount"></e-field>
        </e-values>
        <e-filters>
            <e-field name="[Date].[Fiscal]" caption="Date Fiscal"></e-field>
        </e-filters>
        <e-filtersettings>
            <e-field name="[Date].[Fiscal]" items="@ViewBag.filterMembers" levelCount=3></e-field>
        </e-filtersettings>
    </e-datasourcesettings>
</ejs-pivotview>
public ActionResult Index()
{
ViewBag.filterMembers = new string[] { "[Date].[Fiscal].[Fiscal Quarter].&[2002]&[4]", "[Date].[Fiscal].[Fiscal Year].&[2005]" };
return View();
}Calculated field
The calculated field allows user to insert or add a new calculated field based on the available OLAP cube elements from the bound data source. Calculated fields are nothing but customized dimensions or measures that are newly created based on the user-defined expression.
The two types of calculated fields are as follows:
- Calculated Measure – Creates a new measure through user-defined expression.
- Calculated Dimension – Creates a new dimension through user-defined expression.
It can be customized using the e-calculatedFieldSettings property through code behind. The setting required for calculate field feature at code behind are:
-
name: It allows to set the unique name for new calculated field. -
formula: It allows to set the user-defined expression. -
hierarchyUniqueName: It allows to specify dimension unique name whose hierarchies alone should be used in the expression. This will be applicable only for calculated dimension. -
formatString: It allows to set the format string for the resultant calculated field.
You need to set isCalculatedField property to true, while adding calculated fields to respective axis through code behind.
Also calculated fields can be added at run time through the built-in dialog. The dialog can be enabled by setting the allowCalculatedField property to true as follows. You will see a button enabled in the Field List UI automatically to invoke the calculated field dialog and perform necessary operation.
NOTE
Calculated measure can be added only in value axis.
<ejs-pivotview id="pivotview" allowCalculatedField="true" showFieldList="true" showGroupingBar="true" width="100%" height="600">
    <e-datasourcesettings catalog="Adventure Works DW 2008 SE" cube="Adventure Works" url="https://bi.syncfusion.com/olap/msmdpump.dll" providerType="SSAS" enableSorting="true">
        <e-rows>
            <e-field name="[Customer].[Customer Geography]" caption="Customer Geography"></e-field>
        </e-rows>
        <e-columns>
            <e-field name="[Product].[Product Categories]" caption="Product Categories"></e-field>
            <e-field name="[Measures]" caption="Measures"></e-field>
        </e-columns>
        <e-values>
            <e-field name="[Measures].[Customer Count]" caption="Customer Count"></e-field>
            <e-field name="[Measures].[Internet Sales Amount]" caption="Internet Sales Amount"></e-field>
            <e-field name="Order on Discount" isCalculatedField="true"></e-field>
        </e-values>
        <e-filters>
            <e-field name="[Date].[Fiscal]" caption="Date Fiscal"></e-field>
        </e-filters>
        <e-filtersettings>
            <e-field name="[Date].[Fiscal]" items="@ViewBag.filterMembers" levelCount=3></e-field>
        </e-filtersettings>
        <e-calculatedfieldsettings>
            <e-field name="BikeAndComponents" formula="([Product].[Product Categories].[Category].[Bikes] + [Product].[Product Categories].[Category].[Components])" hierarchyUniqueName="[Product].[Product Categories]" formatString="Standard"></e-field>
            <e-field name="Order on Discount" formula="[Measures].[Order Quantity] + ([Measures].[Order Quantity] * 0.10)" formatString="Currency"></e-field>
        </e-calculatedfieldsettings>
    </e-datasourcesettings>
</ejs-pivotview>
public ActionResult Index()
{
ViewBag.filterMembers = new string[] { "[Date].[Fiscal].[Fiscal Quarter].&[2002]&[4]", "[Date].[Fiscal].[Fiscal Year].&[2005]" };
return View();
}Users can add a calculated field at runtime through the built-in dialog by using the following steps.
Step 1: Click the “CALCULATED FIELD” button in the field list dialog positioned at the top right corner. The calculated field dialog will be opened now. Enter the name of the calculated field to be created.
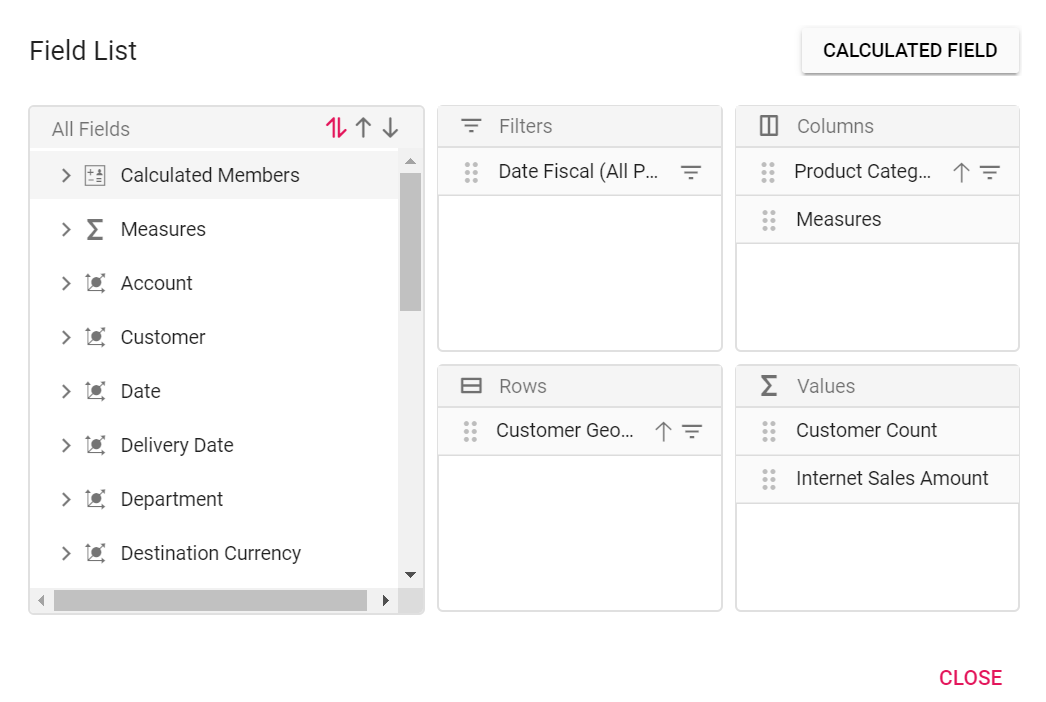
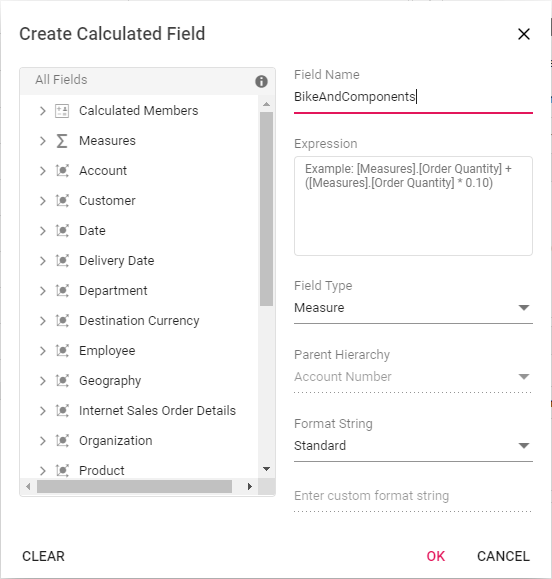
Step 2: Frame the expression by dragging and dropping the fields from the tree view on the left side of the dialog using simple arithmetic operators. Example: “IIF([Measures].[Internet Sales Amount]^0.5 > 100, [Measures].[Internet Sales Amount]*100, [Measures].[Internet Sales Amount]/100)”. Refer here to learn more about the supported operators and functions to frame the expression.
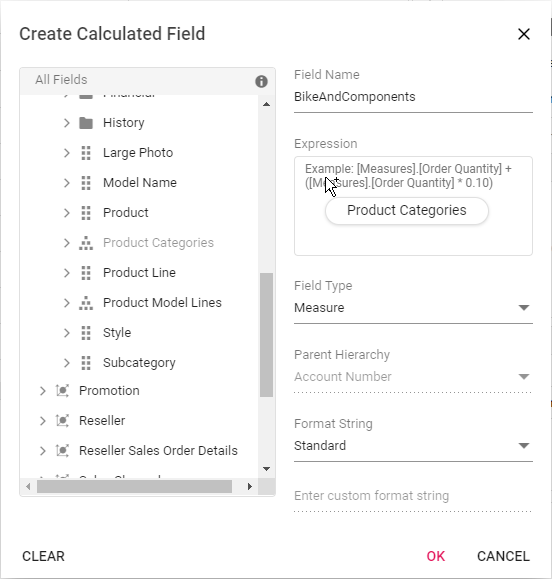
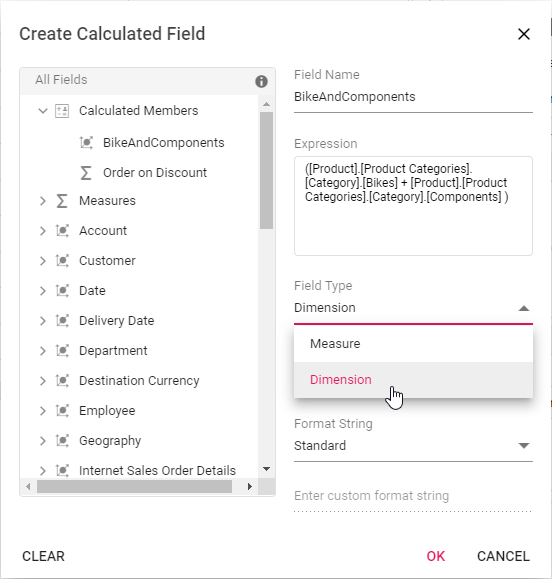
Step 3: Confirm the type of the field to be created - calculated measure or calculated dimension.
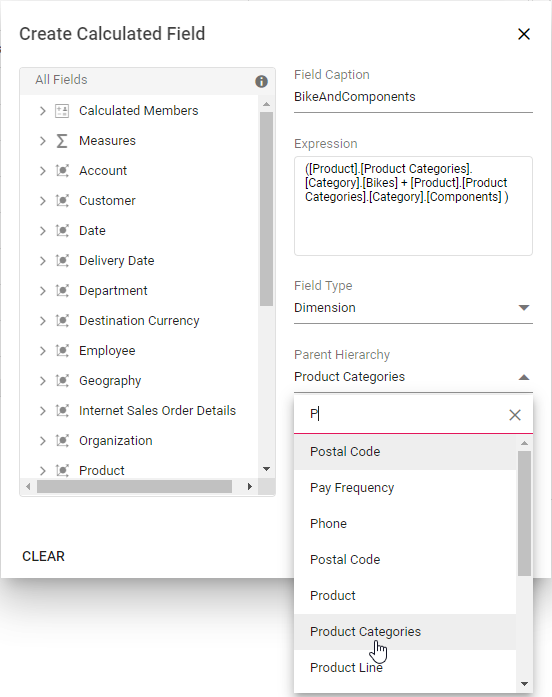
Step 4: Choose the parent hierarchy of the calculated field. NOTE: It is only applicable to the calculated dimension.
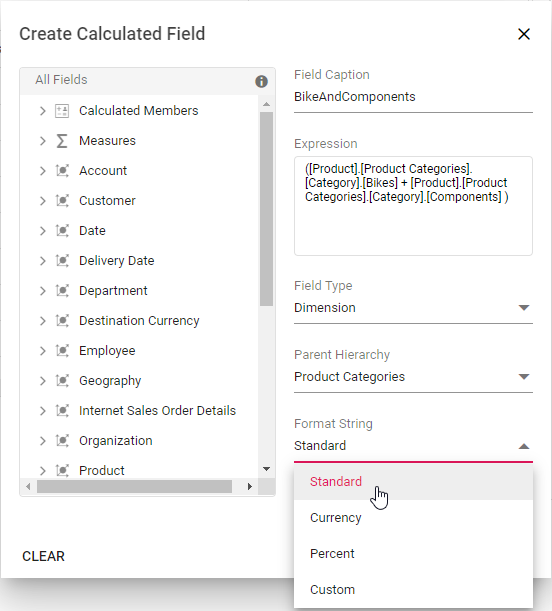
Step 5: Then select the format string from the drop-down list and finally click “OK”.

Format String
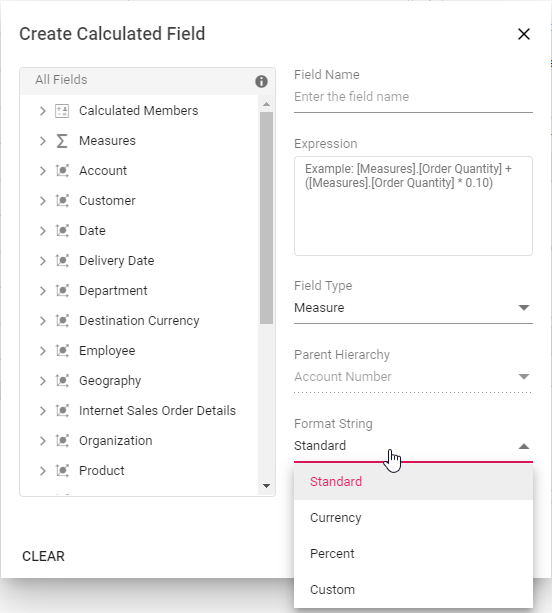
Allows you to specify the required format string while creating new calculated field. Supported format strings are:
- Standard - Denotes the numeric type.
- Currency - Denotes the currency type.
- Percent - Denotes the percentage type.
- Custom - Denotes the custom format. For example: “###0.##0#”. This shows the value “9584.3” as “9584.300.”
By default, Standard will be selected from the drop down list.
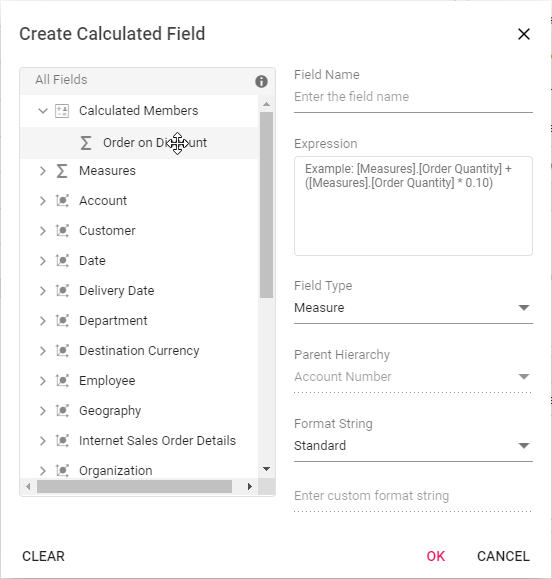
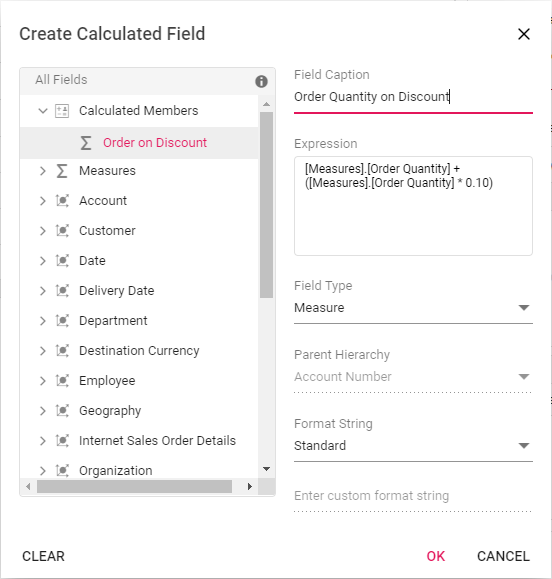
Renaming the existing calculated field
Existing calculated field can be renamed only through the UI at runtime. To do so, open the calculated field dialog, click the target field. User can now see the existing name getting displayed in the text box at the top of the dialog. Now, change the name based on user requirement and click “OK”.
Editing the existing calculated field formula
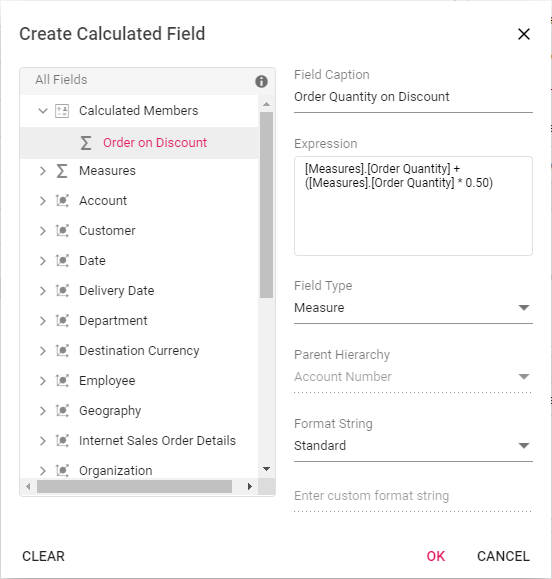
Existing calculated field formula can be edited only through the UI at runtime. To do so, open the calculated field dialog, click the target field. User can now see the existing expression getting displayed in a “Expression” section. Now, change the expression based on user requirement and click “OK”.

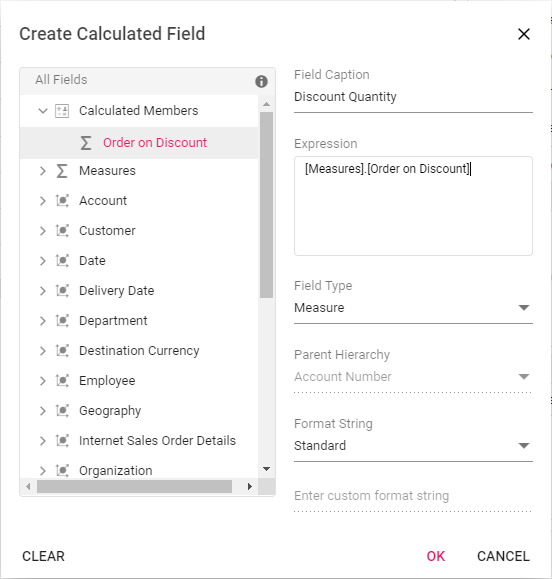
Reusing the existing formula in a new calculate field
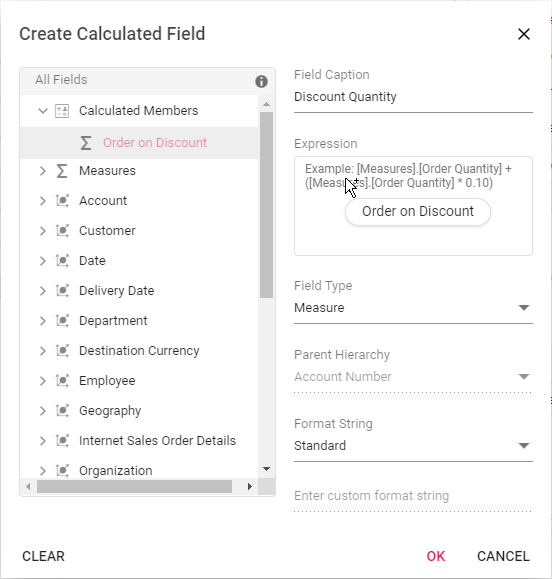
While creating a new calculated field, if user wants to the add the formula of an existing calculated field, it can be done easily. To do so, simply drag-and-drop the existing calculated field to the “Expression” section.

Modifying the existing format string
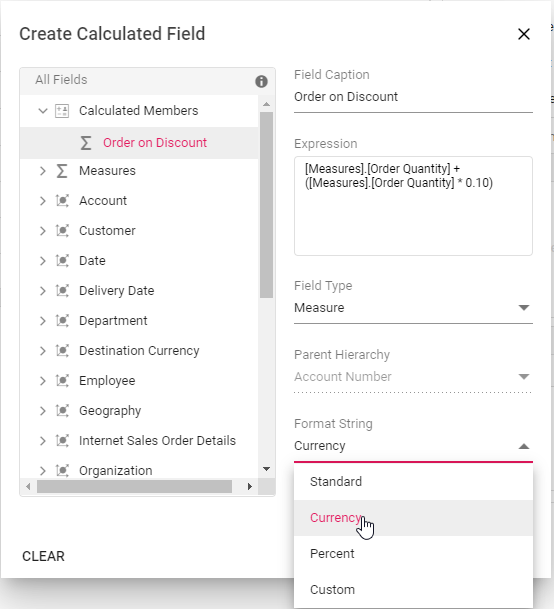
Existing calculated field’s format string can be modified only through the UI at runtime. To do so, open the calculated field dialog and click the target calculated field. User can now see the format string for the existing calculated field getting displayed in a drop-down list. Change the format string based on the requirement and finally click “OK”.

Clearing the changes while editing the calculated field
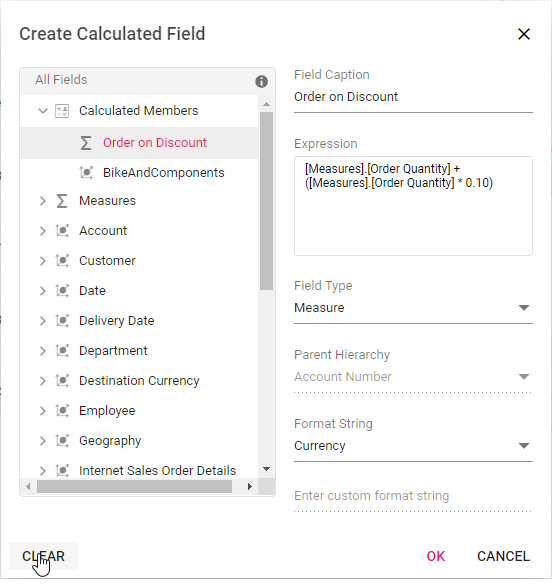
Previous changes can be cleared by using the “Clear” option while performing operations such as creating and editing the calculated field. To do so, click the “Clear” button in the bottom left corner of the dialog.
Virtual Scrolling
Allows large amounts of data to be loaded without any performance degradation by rendering rows and columns in relation to the current viewport. Rest of the data will be brought into the viewport dynamically based on vertical or horizontal scroll position. This feature can be enabled by setting the enableVirtualization property in ejs-pivotview tag to true.
<ejs-pivotview id="pivotview" width="100%" height="600" enableVirtualization="true">
    <e-datasourcesettings catalog="Adventure Works DW 2008 SE" cube="Adventure Works" url="https://bi.syncfusion.com/olap/msmdpump.dll" providerType="SSAS" enableSorting="true">
        <e-rows>
            <e-field name="[Customer].[Customer]" caption="Customer"></e-field>
        </e-rows>
        <e-columns>
            <e-field name="[Product].[Product Categories]" caption="Product Categories"></e-field>
            <e-field name="[Measures]" caption="Measures"></e-field>
        </e-columns>
        <e-values>
            <e-field name="[Measures].[Customer Count]" caption="Customer Count"></e-field>
            <e-field name="[Measures].[Internet Sales Amount]" caption="Internet Sales Amount"></e-field>
        </e-values>
        <e-filters>
            <e-field name="[Date].[Fiscal]" caption="Date Fiscal"></e-field>
        </e-filters>
        <e-formatsettings>
            <e-field name="[Measures].[Internet Sales Amount]" format="C0"></e-field>
        </e-formatsettings>
    </e-datasourcesettings>
</ejs-pivotview>
public ActionResult Index()
{
return View();
}
Limitations for virtual scrolling
- In virtual scrolling, the columnWidth property in e-gridSettings should be in pixels, and percentage values are not accepted.
- Resizing columns or setting width to individual columns affects the calculation used to pick the correct page on scrolling.
- When using OLAP data, subtotals and grand totals are only displayed when measures are bound at the last position in the rows or columns axis. Otherwise, the data from the pivot table will be shown without summary totals.
- When the pivot table’s width and height are large, the loading data count in the current, previous, and next viewports (pages) will also increase, affecting performance.
Data Binding
To bind OLAP datasource to the pivot table, you need to specify following properties under e-datasourcesettings option.
| Properties | Description |
|---|---|
cube |
Points the respective cube name from OLAP database. |
providerType |
Points the provider type for pivot table to identify the type of data source. |
url |
Contains the cube URL for establishing the connection (online). |
catalog |
Contains the database name (catalog name) to fetch the data. |
<ejs-pivotview id="pivotview" width="100%" height="600">
    <e-datasourcesettings catalog="Adventure Works DW 2008 SE" cube="Adventure Works" url="https://bi.syncfusion.com/olap/msmdpump.dll" providerType="SSAS" enableSorting="true">
        <e-rows>
            <e-field name="[Customer].[Customer Geography]" caption="Customer Geography"></e-field>
        </e-rows>
        <e-columns>
            <e-field name="[Product].[Product Categories]" caption="Product Categories"></e-field>
            <e-field name="[Measures]" caption="Measures"></e-field>
        </e-columns>
        <e-values>
            <e-field name="[Measures].[Customer Count]" caption="Customer Count"></e-field>
            <e-field name="[Measures].[Internet Sales Amount]" caption="Internet Sales Amount"></e-field>
        </e-values>
        <e-filters>
            <e-field name="[Date].[Fiscal]" caption="Date Fiscal"></e-field>
        </e-filters>
    </e-datasourcesettings>
</ejs-pivotview>
public ActionResult Index()
{
return View();
}Fields
Measures in row axis
By default, the measures are plotted in column axis. You can place measures in row axis either thorough code behind or UI. To plot those measures in row axis, place the Measures field in the row axis as follows.
<ejs-pivotview id="pivotview" width="100%" height="600">
    <e-datasourcesettings catalog="Adventure Works DW 2008 SE" cube="Adventure Works" url="https://bi.syncfusion.com/olap/msmdpump.dll" providerType="SSAS" enableSorting="true">
        <e-rows>
            <e-field name="[Customer].[Customer Geography]" caption="Customer Geography"></e-field>
            <e-field name="[Measures]" caption="Measures"></e-field>
        </e-rows>
        <e-columns>
            <e-field name="[Product].[Product Categories]" caption="Product Categories"></e-field>
        </e-columns>
        <e-values>
            <e-field name="[Measures].[Customer Count]" caption="Customer Count"></e-field>
            <e-field name="[Measures].[Internet Sales Amount]" caption="Internet Sales Amount"></e-field>
        </e-values>
        <e-filters>
            <e-field name="[Date].[Fiscal]" caption="Date Fiscal"></e-field>
        </e-filters>
    </e-datasourcesettings>
</ejs-pivotview>
public ActionResult Index()
{
ViewBag.filterMembers = new string[] { "[Date].[Fiscal].[Fiscal Quarter].&[2002]&[4]", "[Date].[Fiscal].[Fiscal Year].&[2005]" };
return View();
}Measures in different position
You can place measures in different position in row or column axis either thorough code behind or UI. In this sample, Measures placed before the dimension in the column axis.
<ejs-pivotview id="pivotview" width="100%" height="600">
    <e-datasourcesettings catalog="Adventure Works DW 2008 SE" cube="Adventure Works" url="https://bi.syncfusion.com/olap/msmdpump.dll" providerType="SSAS" enableSorting="true">
        <e-rows>
            <e-field name="[Customer].[Customer Geography]" caption="Customer Geography"></e-field>
        </e-rows>
        <e-columns>
            <e-field name="[Measures]" caption="Measures"></e-field>
            <e-field name="[Product].[Product Categories]" caption="Product Categories"></e-field>
        </e-columns>
        <e-values>
            <e-field name="[Measures].[Customer Count]" caption="Customer Count"></e-field>
            <e-field name="[Measures].[Internet Sales Amount]" caption="Internet Sales Amount"></e-field>
        </e-values>
        <e-filters>
            <e-field name="[Date].[Fiscal]" caption="Date Fiscal"></e-field>
        </e-filters>
    </e-datasourcesettings>
</ejs-pivotview>
public ActionResult Index()
{
ViewBag.filterMembers = new string[] { "[Date].[Fiscal].[Fiscal Quarter].&[2002]&[4]", "[Date].[Fiscal].[Fiscal Year].&[2005]" };
return View();
}Named set
Named set is a multidimensional expression (MDX) that returns a set of dimension members, which can be created by combining the cube data, arithmetic operators, numbers, and functions.
You can bind the named sets in the pivot table by setting it’s unique name in the name property either in row or column axis and isNamedSet boolean property to true. In this sample, we have added “Core Product Group” named set in the column axis.
<ejs-pivotview id="pivotview" showFieldList="true" showGroupingBar="true" width="100%" height="600">
    <e-datasourcesettings catalog="Adventure Works DW 2008 SE" cube="Adventure Works" url="https://bi.syncfusion.com/olap/msmdpump.dll" providerType="SSAS" enableSorting="true">
        <e-rows>
            <e-field name="[Customer].[Customer Geography]" caption="Customer Geography"></e-field>
        </e-rows>
        <e-columns>
            <e-field name="[Core Product Group]" caption="Core Product Group" isNamedSet="true"></e-field>
            <e-field name="[Measures]" caption="Measures"></e-field>
        </e-columns>
        <e-values>
            <e-field name="[Measures].[Customer Count]" caption="Customer Count"></e-field>
            <e-field name="[Measures].[Internet Sales Amount]" caption="Internet Sales Amount"></e-field>
        </e-values>
        <e-filters>
            <e-field name="[Date].[Fiscal]" caption="Date Fiscal"></e-field>
        </e-filters>
    </e-datasourcesettings>
</ejs-pivotview>
public ActionResult Index()
{
ViewBag.filterMembers = new string[] { "[Date].[Fiscal].[Fiscal Quarter].&[2002]&[4]", "[Date].[Fiscal].[Fiscal Year].&[2005]" };
return View();
}Configuring authentication
Users can configure basic authentication information to access the OLAP cube using the e-authentication property. The settings required to configure are as follows:
-
userName: It allows the user to set a username that recognizes the basic authentication of the IIS. -
password: It allows to set the appropriate password.
NOTE
If the user does not configure the authentication, a default popup will appear in the browser to get the authentication information.
<ejs-pivotview id="pivotview" width="100%" height="600">
    <e-datasourcesettings catalog="Adventure Works DW 2008 SE" cube="Adventure Works" url="https://bi.syncfusion.com/olap/msmdpump.dll" providerType="SSAS" enableSorting="true">
        <e-rows>
            <e-field name="[Customer].[Customer Geography]" caption="Customer Geography"></e-field>
        </e-rows>
        <e-columns>
            <e-field name="[Product].[Product Categories]" caption="Product Categories"></e-field>
            <e-field name="[Measures]" caption="Measures"></e-field>
        </e-columns>
        <e-values>
            <e-field name="[Measures].[Customer Count]" caption="Customer Count"></e-field>
            <e-field name="[Measures].[Internet Sales Amount]" caption="Internet Sales Amount"></e-field>
        </e-values>
        <e-filters>
            <e-field name="[Date].[Fiscal]" caption="Date Fiscal"></e-field>
        </e-filters>
		<e-authentication userName="userName" password="password"></e-authentication>
    </e-datasourcesettings>
</ejs-pivotview>
public ActionResult Index()
{
return View();
}Roles
SQL Server Analysis Services uses roles to limit data access within a cube. Each role defines a set of permissions that can be granted to a single user or groups of users. It is used to manage security by limiting access to sensitive data and determining who has access to and can change the cube. It can be configured using the roles property in e-datasourcesettings.
The
rolesproperty can be used to specify one or more roles to the OLAP cube, separated by commas.
<ejs-pivotview id="pivotview" width="100%" height="600">
    <e-datasourcesettings catalog="Adventure Works DW 2008 SE" cube="Adventure Works" url="https://bi.syncfusion.com/olap/msmdpump.dll" providerType="SSAS" roles="Role1">
        <e-rows>
            <e-field name="[Customer].[Customer Geography]" caption="Customer Geography"></e-field>
        </e-rows>
        <e-columns>
            <e-field name="[Product].[Product Categories]" caption="Product Categories"></e-field>
            <e-field name="[Measures]" caption="Measures"></e-field>
        </e-columns>
        <e-values>
            <e-field name="[Measures].[Customer Count]" caption="Customer Count"></e-field>
            <e-field name="[Measures].[Internet Sales Amount]" caption="Internet Sales Amount"></e-field>
        </e-values>
    </e-datasourcesettings>
</ejs-pivotview>
public ActionResult Index()
{
return View();
}OLAP Cube: Elements
Field list
The field list, aka cube dimension browser, is a tree view like structure that organizes the cube elements such as dimensions, hierarchies, measures, etc., from the selected cube into independent logical groups.
Types of node in field list
- Display folder: A folder that contains a set of similar elements.
- Measure: Quantity available for analysis.
- Dimension: A name given to the parts of the cube that categorizes data.
- Attribute Hierarchy: Level of attributes down the hierarchy.
- User-defined Hierarchy: Members of a dimension in a hierarchical structure.
- Level: Denotes a specific level in the category.
- Named Set: A collection of tuples and members, that can be defined and saved as a part of cube definition for later use.
Measure
In a cube, a measure is a set of values that are based on a column in the cube’s fact table and are usually numeric. The measures are the central values of a cube that are analyzed. That is, measures are the numeric data of primary interest to users browsing a cube. You can select measures depend on the types of users request. Some common measures are sales, costs, expenditures, and production count.
Dimension
A simple dimension object is composed of basic information such as name, hierarchy, level, and members. You can create a dimension element by specifying its name and providing the hierarchy and level name. The dimension element contains the hierarchical details and information about each included level elements in that hierarchy. A hierarchy can have any number of level elements and the level elements can have any number of members and the member elements can have any number of child members.
Hierarchy
Each element of a dimension can be summarized using a hierarchy. The hierarchy is a series of parent-child relationship, where a parent member represents the consolidation of members which are its children. Parent members can be further aggregated as the children of another parent. For example, May 2005 can be summarized into Second Quarter 2005 which in turn would be summarized in the year 2005.
Level
Level element is the child of hierarchy element which contains a set of members, each of which has the same rank within a hierarchy.
Attribute hierarchy
Attribute hierarchy contains the following levels:
- A leaf level contains distinct attribute member, and each member of the leaf level is known as a leaf member.
- Intermediate levels if the attribute hierarchy is a parent-child hierarchy.
- An optional (all) level contains the aggregated value of the attribute hierarchy’s leaf members, with the member of the (all) level also known as the (all) member.
User-defined hierarchy
User-defined hierarchy organizes the members of a dimension into hierarchical structure and provides navigation paths in a cube. For example, take a dimension table that supports three attributes such as year, quarter, and month. The year, quarter, and month attributes are used to construct a user-defined hierarchy, named Calendar, in the time dimension that relates to all levels.
Differentiating user-defined hierarchy and attribute hierarchy
- User-defined hierarchy contains more than one level whereas attribute hierarchy contains only one level.
- User-defined hierarchy provides the navigation path between the levels taken from attribute hierarchies of the same dimension.
- The attribute hierarchy and the user-defined hierarchy are represented in different ways as shown in the following table.
Named set
A named set is a collection of tuples and members, which can be defined and saved as a part of the cube definition. Named set records reside inside the sets folder, which is under a dimension element. These elements can be dragged to rows or columns axis via grouping bar or field list at runtime. To work with a lengthy, complex, or commonly used expression easier, Multidimensional Expressions (MDX) allows you to define a named set.
Calculated field
The calculated field allows user to insert or add a new calculated field based on the available OLAP cube elements from the bound data source. Calculated fields are nothing but customized dimensions or measures that are newly created based on the user-defined expression.
The two types of calculated fields are as follows:
- Calculated Measure – Creates a new measure through user-defined expression.
- Calculated Dimension – Creates a new dimension through user-defined expression.
Symbolic representation of the nodes inside field list
| Icon | Name | Node type | Is Draggable |
|---|---|---|---|
 |
Display Folder | Display Folder | False |
 |
Measure | Measure | False |
 |
Dimension | Dimension | False |
 |
User Defined Hierarchy | Hierarchy | True |
 |
Attribute Hierarchy | Hierarchy | True |
  
|
Levels (in order) | Level Element | True |
 |
Named Set | Named Set | True |
Events
BeforeServiceInvoke
The beforeServiceInvoke event is triggered before initiating any service communication with the OLAP server in the Pivot Table and Field List components.
-
This event allows you to inject custom properties or additional parameters dynamically before a request is made to the OLAP server.
-
It is particularly useful for passing contextual data such as user tokens, custom filters, or localization information along with the original server request.
When the beforeServiceInvoke event is triggered, the event argument provides access to the request details and includes a customProperties field.
<ejs-pivotview id="pivotview" width="100%" height="600" beforeServiceInvoke="beforeServiceInvoke">
    <e-datasourcesettings catalog="Adventure Works DW 2008 SE" cube="Adventure Works" url="https://bi.syncfusion.com/olap/msmdpump.dll" providerType="SSAS">
        <e-rows>
            <e-field name="[Customer].[Customer Geography]" caption="Customer Geography"></e-field>
        </e-rows>
        <e-columns>
            <e-field name="[Product].[Product Categories]" caption="Product Categories"></e-field>
            <e-field name="[Measures]" caption="Measures"></e-field>
        </e-columns>
        <e-values>
            <e-field name="[Measures].[Customer Count]" caption="Customer Count"></e-field>
            <e-field name="[Measures].[Internet Sales Amount]" caption="Internet Sales Amount"></e-field>
        </e-values>
    </e-datasourcesettings>
</ejs-pivotview>

<script>
    function beforeServiceInvoke(args) {
        if (args.actionName == 'Aggregate field') {
            args.cancel = true;
        }
    }
</script>
public ActionResult Index()
{
return View();
}AfterServiceInvoke
The afterServiceInvoke event is triggered in the Pivot Table and Field List components during the onSuccess phase of every OLAP service request.
-
This event is useful for performing post-processing, logging actions, or updating the UI after receiving a successful response from the OLAP server.
-
You may use it to audit data, trigger notifications, or handle custom response-handling logic.
When the afterServiceInvoke event is triggered, the event argument provides access to the server response details, including properties such as the action performed and the result data returned from the OLAP server.
<ejs-pivotview id="pivotview" width="100%" height="600" afterServiceInvoke="afterServiceInvoke">
    <e-datasourcesettings catalog="Adventure Works DW 2008 SE" cube="Adventure Works" url="https://bi.syncfusion.com/olap/msmdpump.dll" providerType="SSAS">
        <e-rows>
            <e-field name="[Customer].[Customer Geography]" caption="Customer Geography"></e-field>
        </e-rows>
        <e-columns>
            <e-field name="[Product].[Product Categories]" caption="Product Categories"></e-field>
            <e-field name="[Measures]" caption="Measures"></e-field>
        </e-columns>
        <e-values>
            <e-field name="[Measures].[Customer Count]" caption="Customer Count"></e-field>
            <e-field name="[Measures].[Internet Sales Amount]" caption="Internet Sales Amount"></e-field>
        </e-values>
    </e-datasourcesettings>
</ejs-pivotview>

<script>
    function afterServiceInvoke(args) {
        if (args.actionName == 'Aggregate field') {
            args.cancel = true;
        }
    }
</script>
public ActionResult Index()
{
return View();
}