Show or hide totals in ASP.NET Core Pivot Table
28 Aug 202614 minutes to read
The ASP.NET Core Pivot Table component allows users to easily customize the display of grand totals and sub-totals. This documentation explains how to control their visibility and positioning to suit your data analysis needs.
Show or hide grand totals
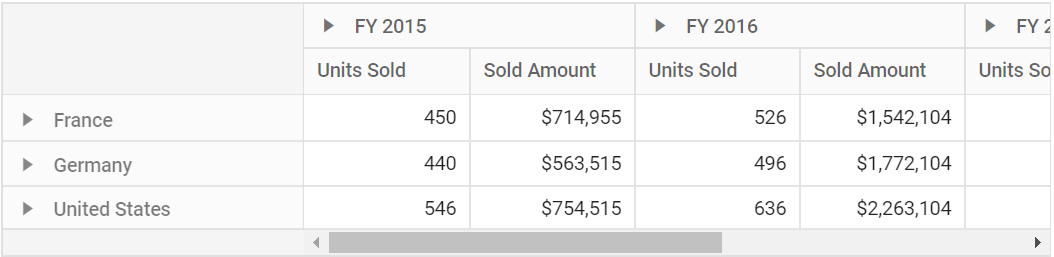
The ASP.NET Core Pivot Table component provides options to display or hide grand totals for rows, columns, or both. These options are configured using the following properties within the e-datasourcesettings object:
-
showGrandTotals: Controls the visibility of grand totals for both rows and columns. Set this property to false to hide grand totals in both directions. -
showRowGrandTotals: When set to false, this property hides only the row grand totals. -
showColumnGrandTotals: When set to false, this property hides only the column grand totals.
By default, all of these properties—
showGrandTotals,showRowGrandTotals, andshowColumnGrandTotals—are set to true in thee-datasourcesettingsobject.
<ejs-pivotview id="PivotView" height="300">
    <e-datasourcesettings dataSource="@ViewBag.DataSource" expandAll="false" enableSorting="true" showGrandTotals="false">
        <e-formatsettings>
            <e-field name="Amount" format="C0" maximumSignificantDigits="10" minimumSignificantDigits="1" useGrouping="true"></e-field>
        </e-formatsettings>
        <e-rows>
            <e-field name="Country"></e-field>
            <e-field name="Products"></e-field>
        </e-rows>
        <e-columns>
            <e-field name="Year" caption="Year"></e-field>
            <e-field name="Quarter"></e-field>
        </e-columns>
        <e-values>
            <e-field name="Sold" caption="Units Sold"></e-field>
            <e-field name="Amount" caption="Sold Amount"></e-field>
        </e-values>
    </e-datasourcesettings>
</ejs-pivotview>
public ActionResult Index()
{
var data = GetPivotData();
ViewBag.DataSource = data;
return View();
}
Set grand totals position
You can specify the position of grand totals for rows and columns in a Pivot Table by configuring the grandTotalsPosition property within the e-datasourcesettings object. You can choose to place the grand totals either at the top or at the bottom of the pivot table, depending on your preference.
To display grand totals at the top of both rows and columns, set the grandTotalsPosition property to Top. To show grand totals at the bottom (which is the default setting), set it to Bottom. This property applies to both row and column grand totals simultaneously.
<ejs-pivotview id="PivotView" height="300">
    <e-datasourcesettings dataSource="@ViewBag.DataSource" grandTotalsPosition="Top">
        <e-rows>
            <e-field name="Country"></e-field>
            <e-field name="Products"></e-field>
        </e-rows>
        <e-columns>
            <e-field name="Year" caption="Year"></e-field>
            <e-field name="Quarter"></e-field>
        </e-columns>
        <e-values>
            <e-field name="Sold" caption="Units Sold"></e-field>
            <e-field name="Amount" caption="Sold Amount"></e-field>
        </e-values>
    </e-datasourcesettings>
</ejs-pivotview>
public ActionResult Index()
{
var data = GetPivotData();
ViewBag.DataSource = data;
return View();
}Show or hide sub-totals
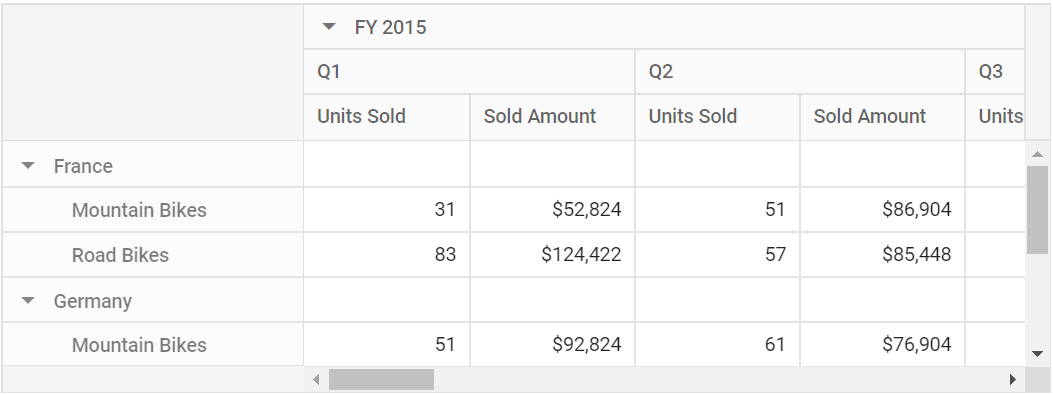
The ASP.NET Core Pivot Table component enables showing or hiding sub-totals for rows, columns, or both. Use the following properties in the e-datasourcesettings object to configure these options:
-
showSubTotals: Set to false to hide all sub-totals for rows and columns. -
showRowSubTotals: Set to false to hide row sub-totals only. -
showColumnSubTotals: Set to false to hide column sub-totals only.
By default, the
showSubTotals,showRowSubTotals, andshowColumnSubTotalsproperties in thee-datasourcesettingsobject are set to true, ensuring sub-totals are visible across the Pivot Table.
<ejs-pivotview id="PivotView" height="300">
    <e-datasourcesettings dataSource="@ViewBag.DataSource" expandAll="false" enableSorting="true" showSubTotals="false">
        <e-formatsettings>
            <e-field name="Amount" format="C0" maximumSignificantDigits="10" minimumSignificantDigits="1" useGrouping="true"></e-field>
        </e-formatsettings>
        <e-drilledmembers>
            <e-field name="Country" items="@ViewBag.drilledMembers"></e-field>
        </e-drilledmembers>
        <e-rows>
            <e-field name="Country"></e-field>
            <e-field name="Products"></e-field>
        </e-rows>
        <e-columns>
            <e-field name="Year" caption="Year"></e-field>
            <e-field name="Quarter"></e-field>
        </e-columns>
        <e-values>
            <e-field name="Sold" caption="Units Sold"></e-field>
            <e-field name="Amount" caption="Sold Amount"></e-field>
        </e-values>
    </e-datasourcesettings>
</ejs-pivotview>
public ActionResult Index()
{
var data = GetPivotData();
ViewBag.DataSource = data;
ViewBag.drilledMembers = new string[] { "France", "Germany" };
return View();
}
Show or hide sub-totals for specific fields
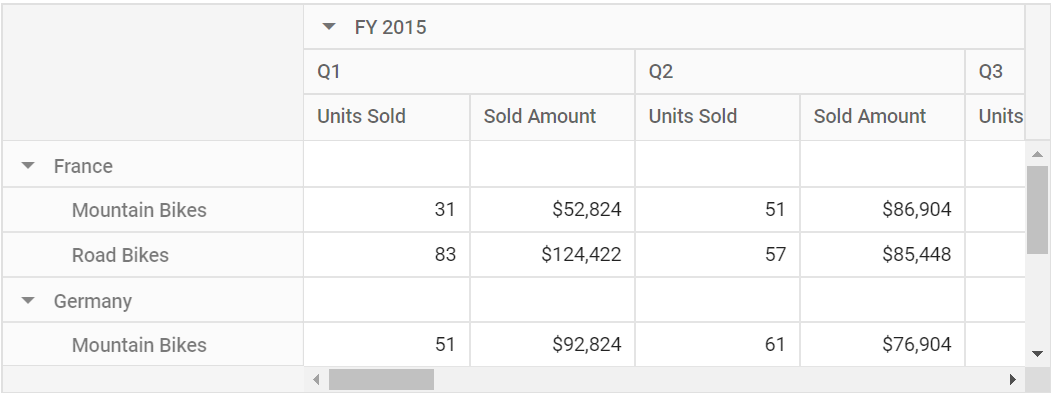
The ASP.NET Core Pivot Table component allows users to show or hide sub-totals for specific fields in the row and column axes. Set the showSubTotals property to false on an individual field entry inside the Row or Column array to hide the sub-total for that field only.
By default, the
showSubTotalsproperty for fields in both theRowandColumnaxes is set to true.
<ejs-pivotview id="PivotView" height="300">
    <e-datasourcesettings dataSource="@ViewBag.DataSource" expandAll="false" enableSorting="true">
        <e-formatsettings>
            <e-field name="Amount" format="C0" maximumSignificantDigits="10" minimumSignificantDigits="1" useGrouping="true"></e-field>
        </e-formatsettings>
        <e-rows>
            <e-field name="Country" showSubTotals="false"></e-field>
            <e-field name="Products"></e-field>
        </e-rows>
        <e-columns>
            <e-field name="Year" caption="Year" showSubTotals="false"></e-field>
            <e-field name="Quarter"></e-field>
        </e-columns>
        <e-values>
            <e-field name="Sold" caption="Units Sold"></e-field>
            <e-field name="Amount" caption="Sold Amount"></e-field>
        </e-values>
    </e-datasourcesettings>
</ejs-pivotview>
public ActionResult Index()
{
var data = GetPivotData();
ViewBag.DataSource = data;
return View();
}
Show sub-totals at top or bottom
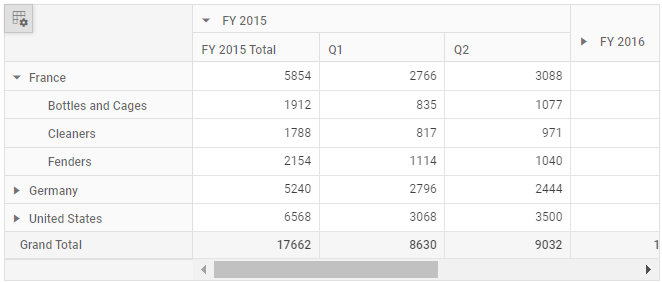
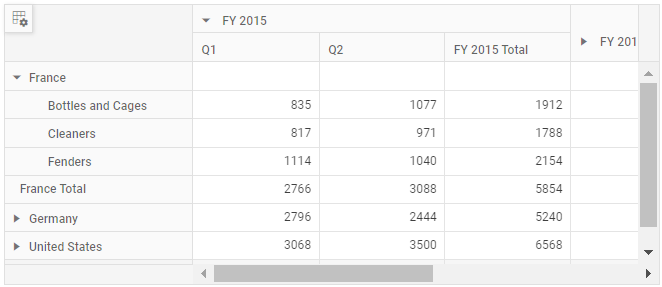
You can configure the position of sub-totals within header groups for both rows and columns in the Pivot Table using the subTotalsPosition property in the e-datasourcesettings object. The available values are Top, Bottom, and Auto (the default). With Auto, column sub-totals appear at the bottom and row sub-totals appear at the top of their respective header groups.
To display sub-totals at the top of header groups for both rows and columns, set the subTotalsPosition property in showGrandTotals to Top.
<ejs-pivotview id="PivotView" height="300">
    <e-datasourcesettings dataSource="@ViewBag.DataSource" expandAll="false" enableSorting="true" subTotalsPosition="Top">
        <e-formatsettings>
            <e-field name="Amount" format="C0" maximumSignificantDigits="10" minimumSignificantDigits="1" useGrouping="true"></e-field>
        </e-formatsettings>
        <e-rows>
            <e-field name="Country"></e-field>
            <e-field name="Products"></e-field>
        </e-rows>
        <e-columns>
            <e-field name="Year" caption="Year"></e-field>
            <e-field name="Quarter"></e-field>
        </e-columns>
        <e-values>
            <e-field name="Sold" caption="Units Sold"></e-field>
            <e-field name="Amount" caption="Sold Amount"></e-field>
        </e-values>
    </e-datasourcesettings>
</ejs-pivotview>
public ActionResult Index()
{
var data = GetPivotData();
ViewBag.DataSource = data;
return View();
}
To display sub-totals at the bottom of header groups for both rows and columns, set the subTotalsPosition property in showGrandTotals to Bottom.
<ejs-pivotview id="PivotView" height="300">
    <e-datasourcesettings dataSource="@ViewBag.DataSource" expandAll="false" enableSorting="true" subTotalsPosition="Bottom">
        <e-formatsettings>
            <e-field name="Amount" format="C0" maximumSignificantDigits="10" minimumSignificantDigits="1" useGrouping="true"></e-field>
        </e-formatsettings>
        <e-rows>
            <e-field name="Country"></e-field>
            <e-field name="Products"></e-field>
        </e-rows>
        <e-columns>
            <e-field name="Year" caption="Year"></e-field>
            <e-field name="Quarter"></e-field>
        </e-columns>
        <e-values>
            <e-field name="Sold" caption="Units Sold"></e-field>
            <e-field name="Amount" caption="Sold Amount"></e-field>
        </e-values>
    </e-datasourcesettings>
</ejs-pivotview>
public ActionResult Index()
{
var data = GetPivotData();
ViewBag.DataSource = data;
return View();
}
Show or hide totals using toolbar
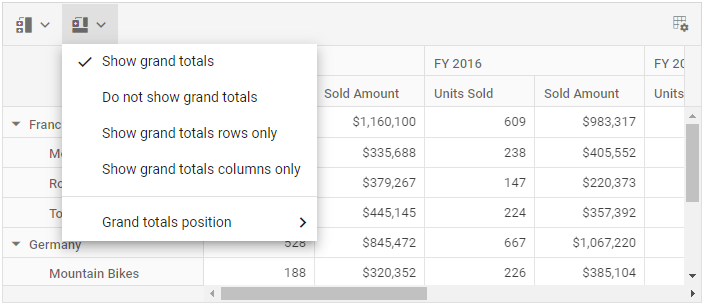
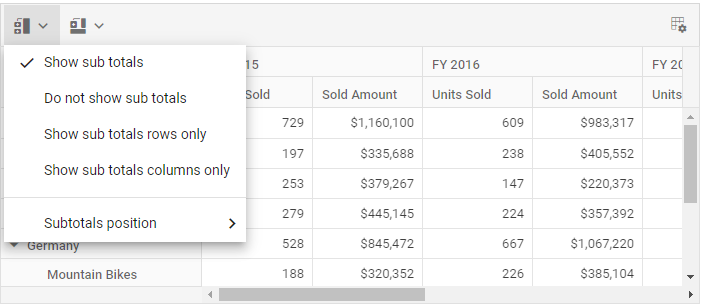
You can show or hide grand totals and sub-totals in the Pivot Table using the built-in toolbar. To enable the toolbar, set the showToolbar property to true in the Pivot Table component. Then, include GrandTotal and SubTotal in the toolbar property. This displays “Show/Hide Grand Totals” and “Show/Hide Subtotals” icons in the toolbar, allowing users to quickly manage grand totals and sub-totals in the table.
The toolbar also includes options for “Grand Totals Position” and “Subtotals Position.” These options allow users to specify whether grand totals and sub-totals appear at the top or bottom of rows and columns. This flexibility helps users position grand totals and sub-totals to best suit their reporting or data analysis needs.
<ejs-pivotview id="pivotview"  showToolbar="true" width="100%" height="300" toolbar="@(new List<string>() {"SubTotal", "GrandTotal" })" >
    <e-datasourcesettings dataSource="@ViewBag.DataSource" expandAll="false" enableSorting="true">
        <e-formatsettings>
            <e-field name="Amount" format="C0" useGrouping="true"></e-field>
        </e-formatsettings>
        <e-rows>
            <e-field name="Country"></e-field>
            <e-field name="Products"></e-field>
        </e-rows>
        <e-columns>
            <e-field name="Year"></e-field>
            <e-field name="Quarter"></e-field>
        </e-columns>
        <e-values>
            <e-field name="Sold" caption="Units Sold"></e-field>
            <e-field name="Amount" caption="Sold Amount"></e-field>
        </e-values>
    </e-datasourcesettings>
</ejs-pivotview>
public ActionResult Index()
{
var data = GetPivotData();
ViewBag.DataSource = data;
return View();
}