Globalization and localization in ASP.NET Core Pivot Table
28 Aug 202624 minutes to read
The Pivot Table helps users view and interact with data in their own language and regional format. This means users from different countries can easily read and understand the data because dates, numbers, and words are shown in a way that feels familiar to them.
Globalization combines two important aspects:
Internationalization: This enables the Pivot Table to display dates and numbers based on local standards. For example, the date can appear as MM/dd/yyyy in the United States or dd/MM/yyyy in the United Kingdom.
Localization: This allows you to provide translations for text in the Pivot Table, such as button labels, menu items, and messages. You can display all these text elements in the language preferred by your users.
With both internationalization and localization, you can make sure the Pivot Table is friendly and easy to use for people who speak different languages and come from various regions.
For more details:
- Learn about
Internationalizationfor formatting dates and numbers. - Read about
Localizationfor translating text content.
Load CLDR-Data to the application
- Install the
CLDR-Datapackage by using the below command (it installs the CLDR JSON data). For more information about CLDR-Data, refer to this link.
npm install cldr-data --save
Once the package installed, you can find the culture specific JSON data under the location /scripts/cldr-data.
- Now use the
loadCultureFilesmethod to load the culture specific CLDR JSON data.
In ASP.NET MVC refer the culture files directly from /scripts/cldr-data location. In ASP.NET Core refer the culture files directly from /wwwroot/scripts/cldr-data location as like the below code examples for both ASP.NET Core and MVC
    function loadCultureFiles(de) {
        var files = ['ca-gregorian.json', 'numbers.json', 'timeZoneNames.json'];
        var loader = ej.base.loadCldr;
        var loadCulture = function (prop) {
            var val, ajax;
            <!--For ASP.NET MVC -->
            ajax = new ej.base.Ajax(location.origin + '/../scripts/cldr-data/main/' + name + '/' + files[prop], 'GET', false);
            <!--For ASP.NET Core-->
            ajax = new ej.base.Ajax(location.origin + '/../wwwroot/scripts/cldr-data/main/' + name + '/' + files[prop], 'GET', false);
            ajax.onSuccess = function (value) {
                val = value;
            };
            ajax.send();
            loader(JSON.parse(val));
        };
        for (var prop = 0; prop < files.length; prop++) {
            loadCulture(prop);
        }
}- Before changing to a culture other than
English, ensure that locale text for the concerned culture is loaded throughloadmethod ofL10nclass.
      var L10n = ej.base.L10n;
       L10n.load({
            "de": {
                'pivotview': {
                    'grandTotal': 'Gesamtsumme',
                    'total': 'Insgesamt',
                    'value': 'Wert',
                    'noValue': 'Kein Wert',
                    'row': 'Zeile',
                    'column': 'Spalte',
                    'collapse': 'Zusammenbruch',
                    'expand': 'Erweitern',
                },
            }
});- Set the culture by using the
localeproperty.
<ejs-pivotview id="PivotView" height="300" showFieldList="true">
    <e-datasourcesettings dataSource="@ViewBag.DataSource" expandAll="false">
        <e-formatsettings>
            <e-field name="Amount" format="C0" maximumSignificantDigits="10" minimumSignificantDigits="1" useGrouping="true"></e-field>
        </e-formatsettings>
        <e-rows>
            <e-field name="Country"></e-field>
            <e-field name="Products"></e-field>
        </e-rows>
        <e-columns>
            <e-field name="Year" caption="Year"></e-field>
            <e-field name="Quarter"></e-field>
        </e-columns>
        <e-values>
            <e-field name="Sold" caption="Units Sold"></e-field>
            <e-field name="Amount" caption="Sold Amount"></e-field>
        </e-values>
    </e-datasourcesettings>
</ejs-pivotview>

<script>
    var pivotObj;
    var L10n = ej.base.L10n;
    L10n.load({
        "fr-CH": {
            "pivotview": {
                "grandTotal": "Grand Total",
                "total": "Total",
                "value": "Valeur",
                "noValue": "Pas de valeur",
                "row": "Rangée",
                "column": "La colonne",
                "collapse": "Effondrement",
                "expand": "L'expansion"
            },
            "pivotfieldlist": {
                "fieldList": "Field List",
                "dropRowPrompt": "Drop row ici",
                "dropColPrompt": "Drop column here",
                "dropValPrompt": "Valeur liste déroulante ici",
                "dropFilterPrompt": "Filtre goutte ici",
                "addPrompt": "Ajouter un champ ici",
                "centerHeader": "Faire glisser les champs entre les zones ci-dessous :",
                "add": "Ajouter",
                "drag": "Faites glisser",
                "filter": "Filter",
                "filtered": "Filtered",
                "sort": "Trier",
                "remove": "Déposer",
                "filters": "Filters",
                "rows": "Lignes",
                "columns": "Colonnes",
                "values": "Valeurs",
                "error": "Error",
                "dropAction": "Champ calculé ne peut pas être place dans toute autre région, à l'exception de l'axe des valeurs.",
                "search": "Recherchez",
                "close": "Fermer",
                "cancel": "Annuler",
                "delete": "Supprimer",
                "alert": "Alert",
                "warning": "Attention",
                "ok": "OK",
                "allFields": "Tous les domaines",
                "noMatches": "Pas de correspondance"
            }
        }
    });
    document.addEventListener('DOMContentLoaded', function () {
        pivotObj = document.getElementById('PivotView').ej2_instances[0];
        loadCultureFiles('fr-CH');
        pivotObj.locale = 'fr-CH';
    });

    function loadCultureFiles(name) {
        var files = ['ca-gregorian.json', 'numbers.json', 'timeZoneNames.json'];
        if (name === 'ar') {
            files.push('numberingSystems.json');
        }
        var loader = ej.base.loadCldr;
        var loadCulture = function (prop) {
            var val, ajax;
            if (name === 'ar' && prop === files.length - 1) {
                ajax = new ej.base.Ajax(location.origin + '/../../scripts/cldr-data/supplemental/' + files[prop], 'GET', false);
            } else {
                ajax = new ej.base.Ajax(location.origin + '/../../scripts/cldr-data/main/' + name + '/' + files[prop], 'GET', false);
            }
            ajax.onSuccess = function (value) {
                val = value;
            };
            ajax.send();
            loader(JSON.parse(val));
        };
        for (var prop = 0; prop < files.length; prop++) {
            loadCulture(prop);
        }
    }
</script>
public ActionResult Index()
{
var data = GetPivotData();
ViewBag.DataSource = data;
return View();
}
- In the above sample,
Amountfield is formatted byNumberFormatOptions. For date formats, the value strings are formatted byDateFormatOptions.- By default,
localevalue isen-US. If you want to change theen-USculture to a different culture, you have to change thelocaleaccordingly.- You can find more details about supported format strings for number formats and date formats
here.
Decimal separators
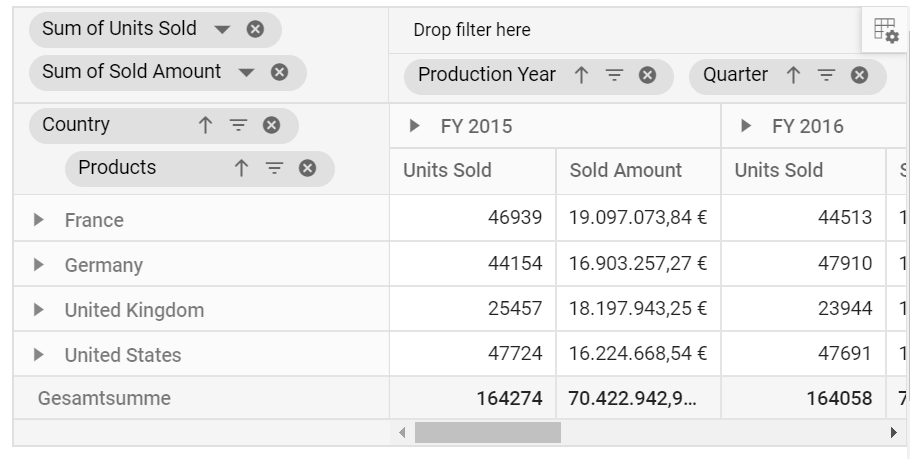
The Pivot Table automatically adjusts decimal separators in numeric values to match your selected culture, making data easier to read for users from different regions. As part of internationalization, you can set the culture by calling the setCulture method with the appropriate culture string as its parameter. Once applied, all numeric values in the Pivot Table will display using the decimal separator convention of that culture.
For example, while English cultures typically use a dot (.) as the decimal separator, German culture uses a comma (,) instead.
The following example shows how decimal separators appear when using the Deutsch culture.
<ejs-pivotview id="PivotView" height="300" showFieldList="true" locale="de-DE">
    <e-datasourcesettings dataSource="@ViewBag.DataSource" expandAll="false">
        <e-formatsettings>
            <e-field name="Amount" format="C2" currency="EUR"></e-field>
        </e-formatsettings>
        <e-rows>
            <e-field name="Country"></e-field>
            <e-field name="Products"></e-field>
        </e-rows>
        <e-columns>
            <e-field name="Year" caption="Year"></e-field>
            <e-field name="Quarter"></e-field>
        </e-columns>
        <e-values>
            <e-field name="Sold" caption="Units Sold"></e-field>
            <e-field name="Amount" caption="Sold Amount"></e-field>
        </e-values>
    </e-datasourcesettings>
</ejs-pivotview>

<script>
     var pivotObj;
    var L10n = ej.base.L10n;
    L10n.load({
    'de-DE': {
        'pivotview': {
            'grandTotal': 'Gesamtsumme',
            'total': 'Insgesamt',
            'value': 'Wert',
            'noValue': 'Kein Wert',
            'row': 'Zeile',
            'column': 'Spalte',
            'collapse': 'Zusammenbruch',
            'expand': 'Erweitern'
        },
        "pivotfieldlist": {
            'fieldList': 'Feld Liste',
            'dropRowPrompt': 'Drop Reihe hier',
            'dropColPrompt': 'Drop column Hier',
            'dropValPrompt': 'Drop wert hier',
            'dropFilterPrompt': 'Drop Filter Hier',
            'addPrompt': 'Feld hinzufügen',
            'centerHeader': 'Ziehen Sie die Felder zwischen den Bereichen unten:',
            'add': 'Hinzufügen',
            'drag': 'Ziehen',
            'filters': 'Filter',
            'rows': 'Zeilen',
            'columns': 'Spalten',
            'values': 'Werte',
            'error': 'Fehler',
            'dropAction': 'Berechnetes Feld nicht in jeder anderen Region außer Wert Achse sein.',
            'search': 'Suche',
            'close': 'Schließen',
            'cancel': 'Abbrechen',
            'delete': 'Löschen',
            'alert': 'Warnung',
            'warning': 'Warnung',
            'ok': 'OK',
            'allFields': 'Alle Felder',
            'noMatches': 'Keine Treffer'
            }
        }
   });

    document.addEventListener('DOMContentLoaded', function () {
        pivotObj = document.getElementById('PivotView').ej2_instances[0];
        loadCultureFiles('de-DE');
    });

    function loadCultureFiles(name) {
        var files = ['ca-gregorian.json', 'numbers.json', 'timeZoneNames.json'];
        if (name === 'ar') {
            files.push('numberingSystems.json');
        }
        var loader = ej.base.loadCldr;
        var loadCulture = function (prop) {
            var val, ajax;
            if (name === 'ar' && prop === files.length - 1) {
                ajax = new ej.base.Ajax(location.origin + '/../../scripts/cldr-data/supplemental/' + files[prop], 'GET', false);
            } else {
                ajax = new ej.base.Ajax(location.origin + '/../../scripts/cldr-data/main/' + name + '/' + files[prop], 'GET', false);
            }
            ajax.onSuccess = function (value) {
                val = value;
            };
            ajax.send();
            loader(JSON.parse(val));
            ej.base.setCulture('de');
            ej.base.setCurrencyCode('EUR');
        };
        for (var prop = 0; prop < files.length; prop++) {
            loadCulture(prop);
        }
    }
</script>
public ActionResult Index()
{
var data = GetPivotData();
ViewBag.DataSource = data;
return View();
}
Localization
The Localization option allows you to translate the default text content of the Pivot Table into different languages. This makes the component more accessible to users from various regions by displaying text in their preferred language.
The Pivot Table contains static text elements such as drop area messages, field list titles, and other interface labels that can be translated to different cultures (Arabic, German, French, etc.). You can achieve this by setting the locale property and providing the appropriate translation object.
The following table shows the locale keywords and their corresponding default text values used in the Pivot Table:
| Locale keywords | Text |
|---|---|
| grandTotal | Grand Total |
| total | Total |
| value | Value |
| noValue | No value |
| row | Row |
| column | Column |
| collapse | Collapse |
| expand | Expand |
| rowAxisPrompt | Drop row here |
| columnAxisPrompt | Drop column here |
| valueAxisPrompt | Drop value here |
| filterAxisPrompt | Drop filter here |
| filter | Filter |
| filtered | Filtered |
| sort | Sort |
| filters | Filters |
| rows | Rows |
| columns | Columns |
| values | Values |
| close | Close |
| cancel | Cancel |
| delete | Delete |
| CalculatedField | Calculated Field |
| createCalculatedField | Create Calculated Field |
| fieldName | Enter the field name |
| error | Error |
| invalidFormula | Invalid formula. |
| dropText | Example: (‘Sum(Order_Count)’ + ‘Sum(In_Stock)’) * 250 |
| dropTextMobile | Add fields and edit formula here. |
| dropAction | Calculated field cannot be place in any other region except value axis. |
| alert | Alert |
| warning | Warning |
| ok | OK |
| search | Search |
| drag | Drag |
| remove | Remove |
| Sum | Sum |
| Avg | Avg |
| Count | Count |
| Min | Min |
| Max | Max |
| allFields | All Fields |
| formula | Formula |
| addToRow | Add to Row |
| addToColumn | Add to Column |
| addToValue | Add to Value |
| addToFilter | Add to Filter |
| emptyData | No records to display |
| fieldExist | A field already exists in this name. Please enter a different name. |
| confirmText | A calculation field already exists in this name. Do you want to replace it? |
| noMatches | No matches |
| format | Summaries values by |
| edit | Edit |
| clear | Clear |
| formulaField | Drag and drop fields to formula |
| dragField | Drag field to formula |
| clearFilter | Clear |
| by | by |
| all | All |
| multipleItems | Multiple items |
| member | Member |
| label | Label |
| date | Date |
| enterValue | Enter value |
| chooseDate | Enter date |
| Before | Before |
| BeforeOrEqualTo | Before Or Equal To |
| After | After |
| AfterOrEqualTo | After Or Equal To |
| labelTextContent | Show the items for which the label |
| dateTextContent | Show the items for which the date |
| valueTextContent | Show the items for which |
| Equals | Equals |
| DoesNotEquals | Does Not Equal |
| BeginWith | Begins With |
| DoesNotBeginWith | Does Not Begin With |
| EndsWith | Ends With |
| DoesNotEndsWith | Does Not End With |
| Contains | Contains |
| DoesNotContains | Does Not Contain |
| GreaterThan | Greater Than |
| GreaterThanOrEqualTo | Greater Than Or Equal To |
| LessThan | Less Than |
| LessThanOrEqualTo | Less Than Or Equal To |
| Between | Between |
| NotBetween | Not Between |
| And | and |
| DistinctCount | Distinct Count |
| Product | Product |
| SampleVar | Sample Var |
| PopulationVar | Population Var |
| RunningTotals | Running Totals |
| Index | Index |
| SampleStDev | Sample StDev |
| PopulationStDev | Population StDev |
| PercentageOfRowTotal | % of Row Total |
| PercentageOfParentTotal | % of Parent Total |
| PercentageOfParentColumnTotal | % of Parent Column Total |
| PercentageOfParentRowTotal | % of Parent Row Total |
| DifferenceFrom | Difference From |
| PercentageOfDifferenceFrom | % of Difference From |
| PercentageOfGrandTotal | % of Grand Total |
| PercentageOfColumnTotal | % of Column Total |
| NotEquals | Not Equals |
| AllValues | All Values |
| conditionalFormatting | Conditional Formatting |
| applyToGrandTotal | Apply to Grand Total |
| apply | Apply |
| condition | Add Condition |
| formatLabel | Format |
| valueFieldSettings | Value field settings |
| baseField | Base field |
| baseItem | Base item |
| summarizeValuesBy | Summarize values by |
| sourceName | Field name : |
| sourceCaption | Field caption |
| example | e.g: |
| editorDataLimitMsg | more items. Search to refine further. |
| details | Details |
| manageRecords | Manage Records |
| Years | Years |
| Quarters | Quarters |
| Months | Months |
| Days | Days |
| Hours | Hours |
| Minutes | Minutes |
| Seconds | Seconds |
| save | Save a report |
| new | Create a new report |
| load | Load |
| saveAs | Save as current report |
| rename | Rename a current report |
| deleteReport | Delete a current report |
| export | Export |
| subTotals | Sub totals |
| grandTotals | Grand totals |
| reportName | Report Name : |
| excel | Excel |
| csv | CSV |
| png | PNG |
| jpeg | JPEG |
| svg | SVG |
| mdxQuery | MDX Query |
| showSubTotals | Show subtotals |
| doNotShowSubTotals | Do not show subtotals |
| showSubTotalsRowsOnly | Show subtotals rows only |
| showSubTotalsColumnsOnly | Show subtotals columns only |
| showGrandTotals | Show grand totals |
| doNotShowGrandTotals | Do not show grand totals |
| showGrandTotalsRowsOnly | Show grand totals rows only |
| showGrandTotalsColumnsOnly | Show grand totals columns only |
| fieldList | Show fieldlist |
| grid | Show table |
| toolbarFormatting | Conditional formatting |
| chart | Chart |
| columnChart | Column |
| reportMsg | Please enter valid report name!!! |
| reportList | Report list |
| removeConfirm | Are you sure you want to delete this report? |
| emptyReport | No reports found!! |
| bar | Bar |
| line | Line |
| area | Area |
| scatter | Scatter |
| polar | Polar |
| of | of |
| emptyFormat | No format found!!! |
| emptyInput | Enter a value |
| newReportConfirm | Do you want to save the changes to this report? |
| emptyReportName | Enter a report name |
| qtr | Qtr |
| null | null |
| undefined | undefined |
| groupOutOfRange | Out of Range |
| fieldDropErrorAction | The field you are moving cannot be placed in that area of the report |
| MoreOption | More… |
| aggregate | Aggregate |
| drillThrough | Drill Through |
| ascending | Ascending |
| descending | Descending |
| number | Number |
| currency | Currency |
| percentage | Percentage |
| formatType | Format Type |
| customText | Currency Symbol |
| symbolPosition | Symbol Position |
| left | Left |
| right | Right |
| grouping | Grouping |
| true | True |
| false | False |
| decimalPlaces | Decimal Places |
| numberFormat | Number Formatting |
| memberType | Field Type |
| formatString | Format |
| expressionField | Expression |
| customFormat | Enter custom format string |
| selectedHierarchy | Parent Hierarchy |
| olapDropText | Example: [Measures].[Order Quantity] + ([Measures].[Order Quantity] * 0.10) |
| Percent | Percent |
| Custom | Custom |
| Measure | Measure |
| Dimension | Dimension |
| Standard | Standard |
| blank | (Blank) |
| fieldTooltip | Drag and drop fields to create an expression. And, if you want to edit the existing calculated fields! Then you can achieve it by simply selecting the field under ‘Calculated Members’. |
| QuarterYear | Quarter Year |
| fieldTitle | Field Name |
| drillError | Cannot show the raw items of calculated fields. |
| caption | Field Caption |
| copy | Copy |
| defaultReport | Sample Report |
| customFormatString | Custom Format |
| invalidFormat | Invalid Format. |
| group | Group |
| unGroup | Ungroup |
| invalidSelection | Cannot group that selection. |
| groupName | Enter the caption to display in header |
| captionName | Enter the caption for group field |
| selectedItems | Selected items |
| groupFieldCaption | Field caption |
| groupTitle | Group name |
| startAt | Starting at |
| endAt | Ending at |
| groupBy | Interval by |
| selectGroup | Select groups |
| numberFormatString | Example: C, P, 0000 %, ###0.##0#, etc. |
| stackingcolumn | Stacked Column |
| stackingbar | Stacked Bar |
| stackingarea | Stacked Area |
| stepline | Step Line |
| steparea | Step Area |
| splinearea | Spline Area |
| spline | Spline |
| stackingcolumn100 | 100% Stacked Column |
| stackingbar100 | 100% Stacked Bar |
| stackingarea100 | 100% Stacked Area |
| bubble | Bubble |
| pareto | Pareto |
| radar | Radar |
| chartTypeSettings | Chart type settings |
| multipleAxes | Multiple Axis |
| sortAscending | Sort ascending order |
| sortDescending | Sort descending order |
| sortNone | Sort data order |
| clearCalculatedField | Clear edited field info |
| editCalculatedField | Edit calculated field |
| ChartType | Chart Type |
| yes | Yes |
| no | No |
| numberFormatMenu | Number Formatting… |
| conditionalFormattingMenu | Conditional Formatting… |
| removeCalculatedField | Are you sure you want to delete this calculated field? |
| replaceConfirmBefore | A report named |
| replaceConfirmAfter | already exists. Do you want to replace it? |
| pie | Pie |
| funnel | Funnel |
| doughnut | Doughnut |
| pyramid | Pyramid |
| showLegend | Show Legend |
| exit | Exit |
| invalidJSON | Invalid JSON data |
| invalidCSV | Invalid CSV data |
| stacked | Stacked |
| single | Single |
| multipleAxisMode | Multiple Axis Mode |
| grandTotalPosition | Grand totals position |
| top | Top |
| bottom | Bottom |
| None | None |
| stackingline | Stacked Line |
| stackingline100 | 100% Stacked Line |
| rowPage | Row pager |
| rowPerPage | Rows per page |
| columnPage | Column pager |
| columnPerPage | Columns per page |
| goToFirstPage | Go to first page |
| goToPreviousPage | Go to previous page |
| goToNextPage | Go to next page |
| goToLastPage | Go to last page |
| combined | Combined |
| subTotalPosition | Subtotals position |
| auto | Auto |
| loading | Loading… |
| add | Add |
The following list of properties and its values are used in the pivot field list.
| Locale keywords | Text |
|---|---|
| staticFieldList | Pivot Field List |
| fieldList | Field List |
| dropFilterPrompt | Drop filter here |
| dropColPrompt | Drop column here |
| dropRowPrompt | Drop row here |
| dropValPrompt | Drop value here |
| addPrompt | Add field here |
| adaptiveFieldHeader | Choose field |
| centerHeader | Drag fields between axes below: |
| add | Add |
| drag | Drag |
| filter | Filter |
| filtered | Filtered |
| sort | Sort |
| remove | Remove |
| filters | Filters |
| rows | Rows |
| columns | Columns |
| values | Values |
| CalculatedField | Calculated Field |
| createCalculatedField | Create Calculated Field |
| fieldName | Enter the field name |
| error | Error |
| invalidFormula | Invalid formula. |
| dropText | Example: (‘Sum(Order_Count)’ + ‘Sum(In_Stock)’) * 250 |
| dropTextMobile | Add fields and edit formula here. |
| dropAction | Calculated field cannot be place in any other region except value axis. |
| search | Search |
| close | Close |
| cancel | Cancel |
| delete | Delete |
| alert | Alert |
| warning | Warning |
| ok | OK |
| Sum | Sum |
| Avg | Avg |
| Count | Count |
| Min | Min |
| Max | Max |
| allFields | All Fields |
| formula | Formula |
| fieldExist | A field already exists in this name. Please enter a different name. |
| confirmText | A calculation field already exists in this name. Do you want to replace it? |
| noMatches | No matches |
| format | Summaries values by |
| edit | Edit |
| clear | Clear |
| formulaField | Drag and drop fields to formula |
| dragField | Drag field to formula |
| clearFilter | Clear |
| by | by |
| enterValue | Enter value |
| chooseDate | Enter date |
| all | All |
| multipleItems | Multiple items |
| Equals | Equals |
| DoesNotEquals | Does Not Equal |
| BeginWith | Begins With |
| DoesNotBeginWith | Does Not Begin With |
| EndsWith | Ends With |
| DoesNotEndsWith | Does Not End With |
| Contains | Contains |
| DoesNotContains | Does Not Contain |
| GreaterThan | Greater Than |
| GreaterThanOrEqualTo | Greater Than Or Equal To |
| LessThan | Less Than |
| LessThanOrEqualTo | Less Than Or Equal To |
| Between | Between |
| NotBetween | Not Between |
| Before | Before |
| BeforeOrEqualTo | Before Or Equal To |
| After | After |
| AfterOrEqualTo | After Or Equal To |
| member | Member |
| label | Label |
| date | Date |
| value | Value |
| labelTextContent | Show the items for which the label |
| dateTextContent | Show the items for which the date |
| valueTextContent | Show the items for which |
| And | and |
| DistinctCount | Distinct Count |
| Product | Product |
| Index | Index |
| SampleStDev | Sample StDev |
| PopulationStDev | Population StDev |
| SampleVar | Sample Var |
| PopulationVar | Population Var |
| RunningTotals | Running Totals |
| DifferenceFrom | Difference From |
| PercentageOfDifferenceFrom | % of Difference From |
| PercentageOfGrandTotal | % of Grand Total |
| PercentageOfColumnTotal | % of Column Total |
| PercentageOfRowTotal | % of Row Total |
| PercentageOfParentTotal | % of Parent Total |
| PercentageOfParentColumnTotal | % of Parent Column Total |
| PercentageOfParentRowTotal | % of Parent Row Total |
| Years | Years |
| Quarters | Quarters |
| Months | Months |
| Days | Days |
| Hours | Hours |
| Minutes | Minutes |
| Seconds | Seconds |
| apply | Apply |
| valueFieldSettings | Value field settings |
| sourceName | Field name : |
| sourceCaption | Field caption |
| summarizeValuesBy | Summarize values by |
| baseField | Base field |
| baseItem | Base item |
| example | e.g: |
| editorDataLimitMsg | more items. Search to refine further. |
| deferLayoutUpdate | Defer Layout Update |
| null | null |
| undefined | undefined |
| groupOutOfRange | Out of Range |
| fieldDropErrorAction | The field you are moving cannot be placed in that area of the report |
| MoreOption | More… |
| memberType | Field Type |
| selectedHierarchy | Parent Hierarchy |
| formatString | Format |
| expressionField | Expression |
| olapDropText | Example: [Measures].[Order Quantity] + ([Measures].[Order Quantity] * 0.10) |
| customFormat | Enter custom format string |
| Measure | Measure |
| Dimension | Dimension |
| Standard | Standard |
| Currency | Currency |
| Percent | Percent |
| Custom | Custom |
| blank | (Blank) |
| fieldTooltip | Drag and drop fields to create an expression. And, if you want to edit the existing calculated fields! You can achieve it by simply selecting the field under ‘Calculated Members’. |
| fieldTitle | Field Name |
| QuarterYear | Quarter Year |
| caption | Field Caption |
| copy | Copy |
| group | Group |
| numberFormatString | Example: C, P, 0000 %, ###0.##0#, etc. |
| sortAscending | Sort ascending order |
| sortDescending | Sort descending order |
| sortNone | Sort data order |
| clearCalculatedField | Clear edited field info |
| editCalculatedField | Edit calculated field |
| selectGroup | Select groups |
| of | of |
| removeCalculatedField | Are you sure you want to delete this calculated field? |
| yes | Yes |
| no | No |
| qtr | Qtr |
| grandTotal | Grand Total |
| None | None |
To access the most recent localization keywords for the Pivot Table and Pivot Field List components in different languages, visit the GitHub repository.
Loading Translations
To load translation content in your application, use the load method of the L10n class. This method accepts translation objects that contain text content in different languages.
The following example demonstrates the Pivot Table in Deutsch culture.
<ejs-pivotview id="PivotView" height="300" showFieldList="true" locale="fr-CH">
    <e-datasourcesettings dataSource="@ViewBag.DataSource" expandAll="false">
        <e-formatsettings>
            <e-field name="Amount" format="C0" maximumSignificantDigits="10" minimumSignificantDigits="1" useGrouping="true"></e-field>
        </e-formatsettings>
        <e-rows>
            <e-field name="Country"></e-field>
            <e-field name="Products"></e-field>
        </e-rows>
        <e-columns>
            <e-field name="Year" caption="Year"></e-field>
            <e-field name="Quarter"></e-field>
        </e-columns>
        <e-values>
            <e-field name="Sold" caption="Units Sold"></e-field>
            <e-field name="Amount" caption="Sold Amount"></e-field>
        </e-values>
    </e-datasourcesettings>
</ejs-pivotview>

<script>
    var L10n = ej.base.L10n;
    L10n.load({
        "fr-CH": {
            "pivotview": {
                "grandTotal": "Grand Total",
                "total": "Total",
                "value": "Valeur",
                "noValue": "Pas de valeur",
                "row": "Rangée",
                "column": "La colonne",
                "collapse": "Effondrement",
                "expand": "L'expansion"
            },
            "pivotfieldlist": {
                "fieldList": "Field List",
                "dropRowPrompt": "Drop row ici",
                "dropColPrompt": "Drop column here",
                "dropValPrompt": "Valeur liste déroulante ici",
                "dropFilterPrompt": "Filtre goutte ici",
                "addPrompt": "Ajouter un champ ici",
                "centerHeader": "Faire glisser les champs entre les zones ci-dessous :",
                "add": "Ajouter",
                "drag": "Faites glisser",
                "filter": "Filter",
                "filtered": "Filtered",
                "sort": "Trier",
                "remove": "Déposer",
                "filters": "Filters",
                "rows": "Lignes",
                "columns": "Colonnes",
                "values": "Valeurs",
                "error": "Error",
                "dropAction": "Champ calculé ne peut pas être place dans toute autre région, à l'exception de l'axe des valeurs.",
                "search": "Recherchez",
                "close": "Fermer",
                "cancel": "Annuler",
                "delete": "Supprimer",
                "alert": "Alert",
                "warning": "Attention",
                "ok": "OK",
                "allFields": "Tous les domaines",
                "noMatches": "Pas de correspondance"
            }
        }
    });
</script>
public ActionResult Index()
{
var data = GetPivotData();
ViewBag.DataSource = data;
return View();
}Right-to-left (RTL)
Right-to-left (RTL) support makes the Pivot Table more accessible and user-friendly for people who read and write in right-to-left languages such as Arabic, Farsi, and Urdu. This feature adjusts the text direction and layout of the entire Pivot Table from a left-to-right to a right-to-left orientation. To enable RTL in the Pivot Table, set the enableRtl property to true.
<ejs-pivotview id="PivotView" height="300" showFieldList="true" locale="ar" enableRtl="true">
    <e-datasourcesettings dataSource="@ViewBag.DataSource" expandAll="false">
        <e-formatsettings>
            <e-field name="Amount" format="C0" maximumSignificantDigits="10" minimumSignificantDigits="1" useGrouping="true"></e-field>
        </e-formatsettings>
        <e-rows>
            <e-field name="Country"></e-field>
            <e-field name="Products"></e-field>
        </e-rows>
        <e-columns>
            <e-field name="Year" caption="Year"></e-field>
            <e-field name="Quarter"></e-field>
        </e-columns>
        <e-values>
            <e-field name="Sold" caption="Units Sold"></e-field>
            <e-field name="Amount" caption="Sold Amount"></e-field>
        </e-values>
    </e-datasourcesettings>
</ejs-pivotview>

<script>
    var L10n = ej.base.L10n;
    L10n.load({
        "ar": {
            "pivotview": {
                "grandTotal": "المجموع الكلى",
                "total": "المجموع",
                "value": "القيمة",
                "noValue": "لا قيمة لها",
                "row": "صف",
                "column": "العمود",
                "collapse": "الانهيار",
                "expand": "توسيع"
            },
            "pivotfieldlist": {
                "fieldList": "قائمة الحقول",
                "dropRowPrompt": "تراجع الخلاف هنا",
                "dropColPrompt": "انخفاض العمود هنا",
                "dropValPrompt": "انخفاض قيمة هنا",
                "dropFilterPrompt": "انخفاض هنا عامل التصفية",
                "addPrompt": "اضافة حقل هنا",
                "centerHeader": "اسحب المجالات بين المناطق الموضحة ادناه:",
                "add": "اضافة",
                "drag": "اسحب",
                "filter": "الفلتر",
                "filtered": "تصفية",
                "sort": "النوع",
                "remove": "قم بازالة",
                "filters": "عوامل التصفية",
                "rows": "الصفوف",
                "columns": "الاعمدة",
                "values": "قيم",
                "error": "خطا",
                "search": "البحث",
                "close": "قريب",
                "cancel": "الغاء",
                "delete": "احذف",
                "alert": "حالة تاهب قصوى",
                "warning": "تحذير",
                "ok": "موافق",
                "allFields": "جميع الحقول",
                "noMatches": "لا مباريات"
            }
        }
    });
</script>
public ActionResult Index()
{
var data = GetPivotData();
ViewBag.DataSource = data;
return View();
}