How can I help you?
Pivot Field List in ASP.NET MVC Pivot Table Component
30 Jun 202324 minutes to read
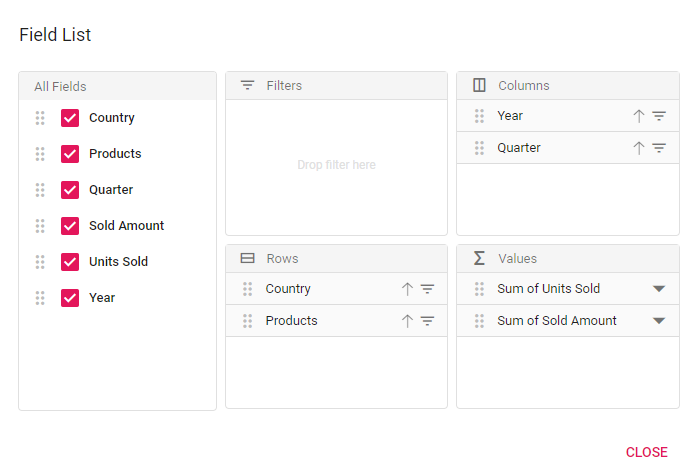
The pivot table provides a built-in Field List similar to Microsoft Excel. It allows to add or remove fields and also rearrange them between different axes, including column, row, value, and filter along with sort and filter options dynamically at runtime.
The field list can be displayed in two different formats to interact with pivot table. They are:
- In-built Field List (Popup): To display the field list icon in pivot table UI to invoke the built-in dialog.
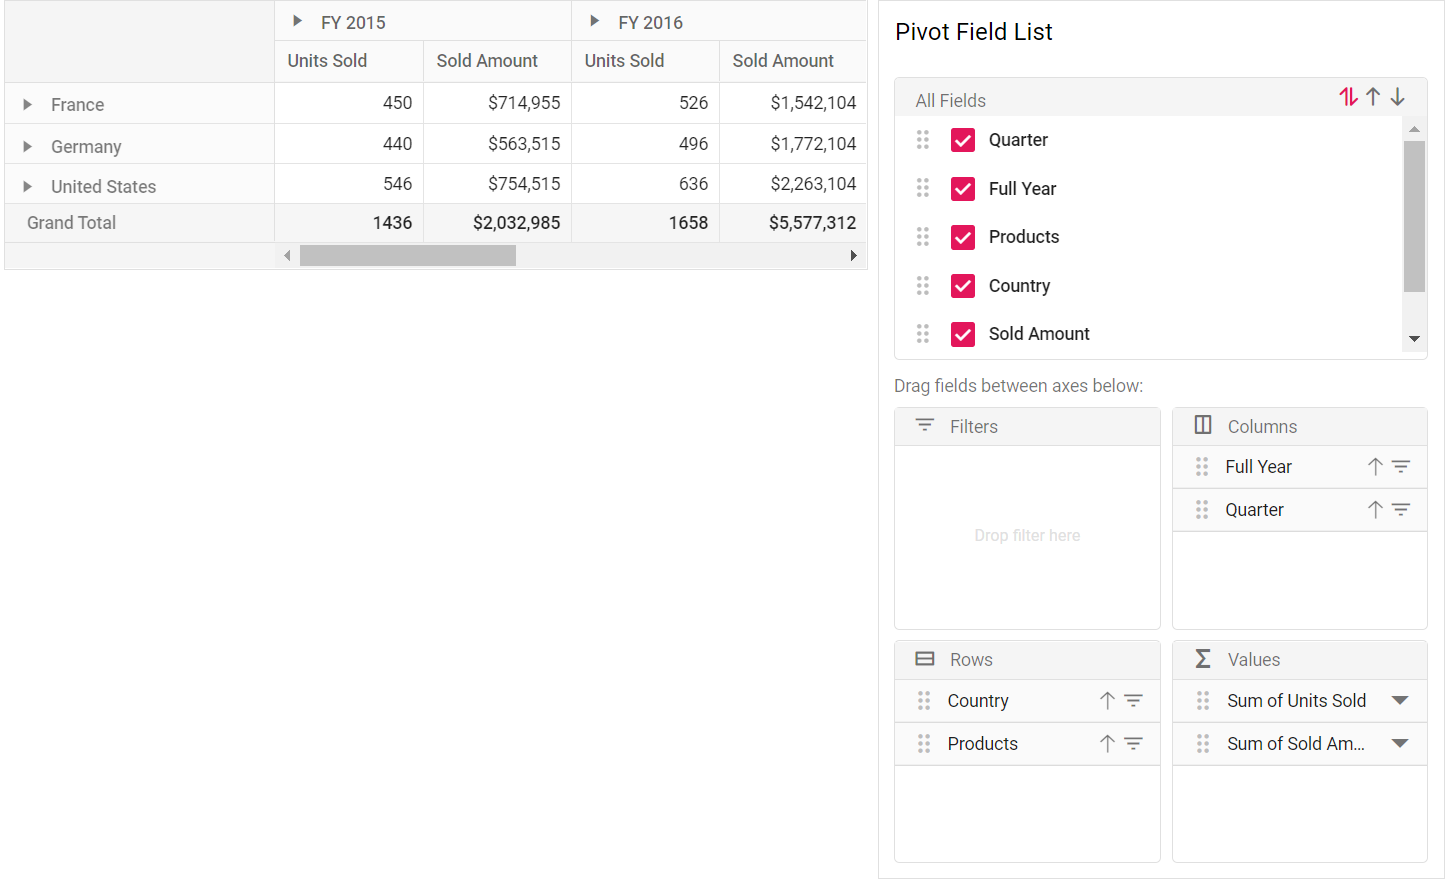
- Stand-alone Field List (Fixed): To display the field list in a static position within a web page.
In-built Field List (Popup)
To enable the field list in pivot table UI, set the ShowFieldList property in PivotView class to true. A small icon will appear on the top left corner of the pivot table and clicking on this icon, field list dialog will appear.
NOTE
The field list icon will be displayed at the top right corner of the pivot table, when grouping bar is enabled.
@model List<PivotTableSample.Controllers.PivotData>

@Html.EJS().PivotView("PivotView").Height("300").DataSourceSettings(dataSource => dataSource.DataSource((IEnumerable<object>)Model).ExpandAll(false).EnableSorting(true).AllowLabelFilter(true).AllowValueFilter(true)
.FormatSettings(formatsettings =>
{
	formatsettings.Name("Amount").Format("C0").MaximumSignificantDigits(10).MinimumSignificantDigits(1).UseGrouping(true).Add();
}).Rows(rows =>
{
	rows.Name("Country").Add(); rows.Name("Products").Add();
}).Columns(columns =>
{
	columns.Name("Year").Caption("Year").Add(); columns.Name("Quarter").Add();
}).Values(values =>
{
	values.Name("Sold").Caption("Units Sold").Add(); values.Name("Amount").Caption("Sold Amount").Add();
})).ShowFieldList(true).Render()
public ActionResult Index()
{
var data = GetPivotData();
ViewBag.DataSource = data;
return View();
}
public List<PivotData> GetPivotData()
{
List<PivotData> pivotData = new List<PivotData>();
pivotData.Add(new PivotData { Sold = 31, Amount = 52824, Country = "France", Products = "Mountain Bikes", Year = "FY 2015", Quarter = "Q1" });
pivotData.Add(new PivotData { Sold = 51, Amount = 86904, Country = "France", Products = "Mountain Bikes", Year = "FY 2015", Quarter = "Q2" });
pivotData.Add(new PivotData { Sold = 90, Amount = 153360, Country = "France", Products = "Mountain Bikes", Year = "FY 2015", Quarter = "Q3" });
pivotData.Add(new PivotData { Sold = 25, Amount = 42600, Country = "France", Products = "Mountain Bikes", Year = "FY 2015", Quarter = "Q4" });
pivotData.Add(new PivotData { Sold = 27, Amount = 46008, Country = "France", Products = "Mountain Bikes", Year = "FY 2016", Quarter = "Q1" });
pivotData.Add(new PivotData { Sold = 49, Amount = 83496, Country = "France", Products = "Mountain Bikes", Year = "FY 2016", Quarter = "Q2" });
pivotData.Add(new PivotData { Sold = 95, Amount = 161880, Country = "France", Products = "Mountain Bikes", Year = "FY 2016", Quarter = "Q3" });
pivotData.Add(new PivotData { Sold = 67, Amount = 114168, Country = "France", Products = "Mountain Bikes", Year = "FY 2016", Quarter = "Q4" });
pivotData.Add(new PivotData { Sold = 75, Amount = 127800, Country = "France", Products = "Mountain Bikes", Year = "FY 2017", Quarter = "Q1" });
pivotData.Add(new PivotData { Sold = 67, Amount = 114168, Country = "France", Products = "Mountain Bikes", Year = "FY 2017", Quarter = "Q2" });
pivotData.Add(new PivotData { Sold = 69, Amount = 117576, Country = "France", Products = "Mountain Bikes", Year = "FY 2017", Quarter = "Q3" });
pivotData.Add(new PivotData { Sold = 90, Amount = 153360, Country = "France", Products = "Mountain Bikes", Year = "FY 2017", Quarter = "Q4" });
pivotData.Add(new PivotData { Sold = 16, Amount = 27264, Country = "France", Products = "Mountain Bikes", Year = "FY 2018", Quarter = "Q1" });
pivotData.Add(new PivotData { Sold = 83, Amount = 124422, Country = "France", Products = "Road Bikes", Year = "FY 2015", Quarter = "Q1" });
pivotData.Add(new PivotData { Sold = 57, Amount = 85448, Country = "France", Products = "Road Bikes", Year = "FY 2015", Quarter = "Q2" });
pivotData.Add(new PivotData { Sold = 20, Amount = 29985, Country = "France", Products = "Road Bikes", Year = "FY 2015", Quarter = "Q3" });
pivotData.Add(new PivotData { Sold = 67, Amount = 70008, Country = "France", Products = "Road Bikes", Year = "FY 2016", Quarter = "Q1" });
pivotData.Add(new PivotData { Sold = 89, Amount = 60496, Country = "France", Products = "Road Bikes", Year = "FY 2016", Quarter = "Q2" });
pivotData.Add(new PivotData { Sold = 75, Amount = 801880, Country = "France", Products = "Road Bikes", Year = "FY 2016", Quarter = "Q3" });
pivotData.Add(new PivotData { Sold = 57, Amount = 204168, Country = "France", Products = "Road Bikes", Year = "FY 2016", Quarter = "Q4" });
pivotData.Add(new PivotData { Sold = 75, Amount = 737800, Country = "France", Products = "Road Bikes", Year = "FY 2017", Quarter = "Q1" });
pivotData.Add(new PivotData { Sold = 87, Amount = 884168, Country = "France", Products = "Road Bikes", Year = "FY 2017", Quarter = "Q2" });
pivotData.Add(new PivotData { Sold = 39, Amount = 729576, Country = "France", Products = "Road Bikes", Year = "FY 2017", Quarter = "Q3" });
pivotData.Add(new PivotData { Sold = 90, Amount = 38860, Country = "France", Products = "Road Bikes", Year = "FY 2017", Quarter = "Q4" });
pivotData.Add(new PivotData { Sold = 93, Amount = 139412, Country = "France", Products = "Road Bikes", Year = "FY 2015", Quarter = "Q4" });
pivotData.Add(new PivotData { Sold = 51, Amount = 92824, Country = "Germany", Products = "Mountain Bikes", Year = "FY 2015", Quarter = "Q1" });
pivotData.Add(new PivotData { Sold = 61, Amount = 76904, Country = "Germany", Products = "Mountain Bikes", Year = "FY 2015", Quarter = "Q2" });
pivotData.Add(new PivotData { Sold = 70, Amount = 43360, Country = "Germany", Products = "Mountain Bikes", Year = "FY 2015", Quarter = "Q3" });
pivotData.Add(new PivotData { Sold = 85, Amount = 62600, Country = "Germany", Products = "Mountain Bikes", Year = "FY 2015", Quarter = "Q4" });
pivotData.Add(new PivotData { Sold = 97, Amount = 86008, Country = "Germany", Products = "Mountain Bikes", Year = "FY 2016", Quarter = "Q1" });
pivotData.Add(new PivotData { Sold = 69, Amount = 93496, Country = "Germany", Products = "Mountain Bikes", Year = "FY 2016", Quarter = "Q2" });
pivotData.Add(new PivotData { Sold = 45, Amount = 301880, Country = "Germany", Products = "Mountain Bikes", Year = "FY 2016", Quarter = "Q3" });
pivotData.Add(new PivotData { Sold = 77, Amount = 404168, Country = "Germany", Products = "Mountain Bikes", Year = "FY 2016", Quarter = "Q4" });
pivotData.Add(new PivotData { Sold = 15, Amount = 137800, Country = "Germany", Products = "Mountain Bikes", Year = "FY 2017", Quarter = "Q1" });
pivotData.Add(new PivotData { Sold = 37, Amount = 184168, Country = "Germany", Products = "Mountain Bikes", Year = "FY 2017", Quarter = "Q2" });
pivotData.Add(new PivotData { Sold = 49, Amount = 89576, Country = "Germany", Products = "Mountain Bikes", Year = "FY 2017", Quarter = "Q3" });
pivotData.Add(new PivotData { Sold = 40, Amount = 33360, Country = "Germany", Products = "Mountain Bikes", Year = "FY 2017", Quarter = "Q4" });
pivotData.Add(new PivotData { Sold = 96, Amount = 77264, Country = "Germany", Products = "Mountain Bikes", Year = "FY 2018", Quarter = "Q1" });
pivotData.Add(new PivotData { Sold = 23, Amount = 24422, Country = "Germany", Products = "Road Bikes", Year = "FY 2015", Quarter = "Q1" });
pivotData.Add(new PivotData { Sold = 67, Amount = 75448, Country = "Germany", Products = "Road Bikes", Year = "FY 2015", Quarter = "Q2" });
pivotData.Add(new PivotData { Sold = 70, Amount = 52345, Country = "Germany", Products = "Road Bikes", Year = "FY 2015", Quarter = "Q3" });
pivotData.Add(new PivotData { Sold = 13, Amount = 135612, Country = "Germany", Products = "Road Bikes", Year = "FY 2015", Quarter = "Q4" });
pivotData.Add(new PivotData { Sold = 57, Amount = 90008, Country = "Germany", Products = "Road Bikes", Year = "FY 2016", Quarter = "Q1" });
pivotData.Add(new PivotData { Sold = 29, Amount = 90496, Country = "Germany", Products = "Road Bikes", Year = "FY 2016", Quarter = "Q2" });
pivotData.Add(new PivotData { Sold = 45, Amount = 301880, Country = "Germany", Products = "Road Bikes", Year = "FY 2016", Quarter = "Q3" });
pivotData.Add(new PivotData { Sold = 77, Amount = 404168, Country = "Germany", Products = "Road Bikes", Year = "FY 2016", Quarter = "Q4" });
pivotData.Add(new PivotData { Sold = 15, Amount = 137800, Country = "Germany", Products = "Road Bikes", Year = "FY 2017", Quarter = "Q1" });
pivotData.Add(new PivotData { Sold = 37, Amount = 184168, Country = "Germany", Products = "Road Bikes", Year = "FY 2017", Quarter = "Q2" });
pivotData.Add(new PivotData { Sold = 99, Amount = 829576, Country = "Germany", Products = "Road Bikes", Year = "FY 2017", Quarter = "Q3" });
pivotData.Add(new PivotData { Sold = 80, Amount = 38360, Country = "Germany", Products = "Road Bikes", Year = "FY 2017", Quarter = "Q4" });
pivotData.Add(new PivotData { Sold = 91, Amount = 67824, Country = "United States", Products = "Mountain Bikes", Year = "FY 2015", Quarter = "Q1" });
pivotData.Add(new PivotData { Sold = 81, Amount = 99904, Country = "United States", Products = "Mountain Bikes", Year = "FY 2015", Quarter = "Q2" });
pivotData.Add(new PivotData { Sold = 70, Amount = 49360, Country = "United States", Products = "Mountain Bikes", Year = "FY 2015", Quarter = "Q3" });
pivotData.Add(new PivotData { Sold = 65, Amount = 69600, Country = "United States", Products = "Mountain Bikes", Year = "FY 2015", Quarter = "Q4" });
pivotData.Add(new PivotData { Sold = 57, Amount = 90008, Country = "United States", Products = "Mountain Bikes", Year = "FY 2016", Quarter = "Q1" });
pivotData.Add(new PivotData { Sold = 29, Amount = 90496, Country = "United States", Products = "Mountain Bikes", Year = "FY 2016", Quarter = "Q2" });
pivotData.Add(new PivotData { Sold = 85, Amount = 391880, Country = "United States", Products = "Mountain Bikes", Year = "FY 2016", Quarter = "Q3" });
pivotData.Add(new PivotData { Sold = 97, Amount = 904168, Country = "United States", Products = "Mountain Bikes", Year = "FY 2016", Quarter = "Q4" });
pivotData.Add(new PivotData { Sold = 85, Amount = 237800, Country = "United States", Products = "Mountain Bikes", Year = "FY 2017", Quarter = "Q1" });
pivotData.Add(new PivotData { Sold = 77, Amount = 384168, Country = "United States", Products = "Mountain Bikes", Year = "FY 2017", Quarter = "Q2" });
pivotData.Add(new PivotData { Sold = 99, Amount = 829576, Country = "United States", Products = "Mountain Bikes", Year = "FY 2017", Quarter = "Q3" });
pivotData.Add(new PivotData { Sold = 80, Amount = 38360, Country = "United States", Products = "Mountain Bikes", Year = "FY 2017", Quarter = "Q4" });
pivotData.Add(new PivotData { Sold = 76, Amount = 97264, Country = "United States", Products = "Mountain Bikes", Year = "FY 2018", Quarter = "Q1" });
pivotData.Add(new PivotData { Sold = 53, Amount = 94422, Country = "United States", Products = "Road Bikes", Year = "FY 2015", Quarter = "Q1" });
pivotData.Add(new PivotData { Sold = 90, Amount = 45448, Country = "United States", Products = "Road Bikes", Year = "FY 2015", Quarter = "Q2" });
pivotData.Add(new PivotData { Sold = 29, Amount = 92345, Country = "United States", Products = "Road Bikes", Year = "FY 2015", Quarter = "Q3" });
pivotData.Add(new PivotData { Sold = 67, Amount = 235612, Country = "United States", Products = "Road Bikes", Year = "FY 2015", Quarter = "Q4" });
pivotData.Add(new PivotData { Sold = 97, Amount = 90008, Country = "United States", Products = "Road Bikes", Year = "FY 2016", Quarter = "Q1" });
pivotData.Add(new PivotData { Sold = 79, Amount = 90496, Country = "United States", Products = "Road Bikes", Year = "FY 2016", Quarter = "Q2" });
pivotData.Add(new PivotData { Sold = 95, Amount = 501880, Country = "United States", Products = "Road Bikes", Year = "FY 2016", Quarter = "Q3" });
pivotData.Add(new PivotData { Sold = 97, Amount = 104168, Country = "United States", Products = "Road Bikes", Year = "FY 2016", Quarter = "Q4" });
pivotData.Add(new PivotData { Sold = 95, Amount = 837800, Country = "United States", Products = "Road Bikes", Year = "FY 2017", Quarter = "Q1" });
pivotData.Add(new PivotData { Sold = 87, Amount = 684168, Country = "United States", Products = "Road Bikes", Year = "FY 2017", Quarter = "Q2" });
pivotData.Add(new PivotData { Sold = 109, Amount = 29576, Country = "United States", Products = "Road Bikes", Year = "FY 2017", Quarter = "Q3" });
return pivotData;
}
public class PivotData
{
public int Sold { get; set; }
public double Amount { get; set; }
public string Country { get; set; }
public string Products { get; set; }
public string Year { get; set; }
public string Quarter { get; set; }
}![]()
Stand-alone Field List (Fixed)
The field list can be rendered in a static position, anywhere in web page layout, like a separate component. To do so, you need to set RenderMode property to Mode.Fixed in PivotFieldList.
NOTE
To make field list interact with pivot table, you need to use the UpdateView and Update methods for data source update in both field list and pivot table simultaneously.
@using Syncfusion.EJ2.PivotView

@Html.EJS().PivotView("PivotView").Height("300").EnginePopulated("onGridEnginePopulate").Render()
<br />
@Html.EJS().PivotFieldList("Static_FieldList").RenderMode(Mode.Fixed).DataSourceSettings(dataSource => dataSource.DataSource((IEnumerable<object>)ViewBag.DataSource).ExpandAll(false).EnableSorting(true)
 .FormatSettings(formatsettings =>
 {
     formatsettings.Name("Amount").Format("C0").MaximumSignificantDigits(10).MinimumSignificantDigits(1).UseGrouping(true).Add();
 }).Rows(rows =>
 {
     rows.Name("Country").Add(); rows.Name("Products").Add();
 }).Columns(columns =>
 {
     columns.Name("Year").Caption("Year").Add(); columns.Name("Quarter").Add();
 }).Values(values =>
 {
     values.Name("Sold").Caption("Units Sold").Add(); values.Name("Amount").Caption("Sold Amount").Add();
 })).EnginePopulated("onFieldListEnginePopulate").Render()

<style>
    #Static_FieldList {
        width: 400px;
    }
</style>

<script>
    var pivotObj; var fieldlistObj;
    function onGridEnginePopulate(args) {
        pivotObj = document.getElementById('PivotView').ej2_instances[0];
        fieldlistObj = document.getElementById('PivotFieldList').ej2_instances[0];
        if (fieldlistObj) {
            fieldlistObj.update(pivotObj);
        }
    }
    function onFieldListEnginePopulate(args) {
        pivotObj = document.getElementById('PivotView').ej2_instances[0];
        fieldlistObj = document.getElementById('PivotFieldList').ej2_instances[0];
        fieldlistObj.updateView(pivotObj);
    }
</script>
public ActionResult Index()
{
var data = GetPivotData();
ViewBag.DataSource = data;
return View();
}
Invoking dynamic Field List (Customized)
Also, you can display the field list dialog independently through other means. For example, you can invoke the field list dialog on an external button click. To do so, set RenderMode property to Mode.Popup and since on button click, field list dialog will be invoked.
NOTE
- Meanwhile, you can display the field list dialog at specific target element within a webpage using
targetproperty. By default, thetargetvalue is null, which refers thedocument.bodyelement.
* Moreover, to make field list interact with pivot table, you need to use the updateView and update methods for data source update in both field list and pivot table simultaneously.
The below sample code illustrates the field list dialog invoked on an external button click.
@using Syncfusion.EJ2.PivotView

@Html.EJS().Button("fieldlistbtn").Content("Field List").IsPrimary(true).Render()

<div id="Popup_FieldList"></div>

@Html.EJS().PivotView("PivotView").Height("300").EnginePopulated("onGridEnginePopulate").Render()

@Html.EJS().PivotFieldList("PivotFieldList").RenderMode(Syncfusion.EJ2.PivotView.Mode.Popup).Target("#Popup_FieldList").DataSourceSettings(dataSource => dataSource.DataSource((IEnumerable<object>)ViewBag.DataSource).ExpandAll(false).EnableSorting(true)
 .FormatSettings(formatsettings =>
 {
     formatsettings.Name("Amount").Format("C0").MaximumSignificantDigits(10).MinimumSignificantDigits(1).UseGrouping(true).Add();
 }).Rows(rows =>
 {
     rows.Name("Country").Add(); rows.Name("Products").Add();
 }).Columns(columns =>
 {
     columns.Name("Year").Caption("Year").Add(); columns.Name("Quarter").Add();
 }).Values(values =>
 {
     values.Name("Sold").Caption("Units Sold").Add(); values.Name("Amount").Caption("Sold Amount").Add();
 })).EnginePopulated("onFieldListEnginePopulate").Render()

<style>
    .e-toggle-field-list {
        display: none !important;
    }
</style>

<script>
    var pivotObj; var fieldlistObj;
    function onGridEnginePopulate(args) {
        pivotObj = document.getElementById('PivotView').ej2_instances[0];
        fieldlistObj = document.getElementById('PivotFieldList').ej2_instances[0];
        if (fieldlistObj) {
            fieldlistObj.update(pivotObj);
        }
    }
    function onFieldListEnginePopulate(args) {
        pivotObj = document.getElementById('PivotView').ej2_instances[0];
        fieldlistObj = document.getElementById('PivotFieldList').ej2_instances[0];
        fieldlistObj.updateView(pivotObj);
    }
    document.getElementById('fieldlistbtn').onclick = function () {
        fieldlistObj = document.getElementById('PivotFieldList').ej2_instances[0];
        fieldlistObj.dialogRenderer.fieldListDialog.show();
    };
</script>
public ActionResult Index()
{
var data = GetPivotData();
ViewBag.DataSource = data;
return View();
}
Search desired field
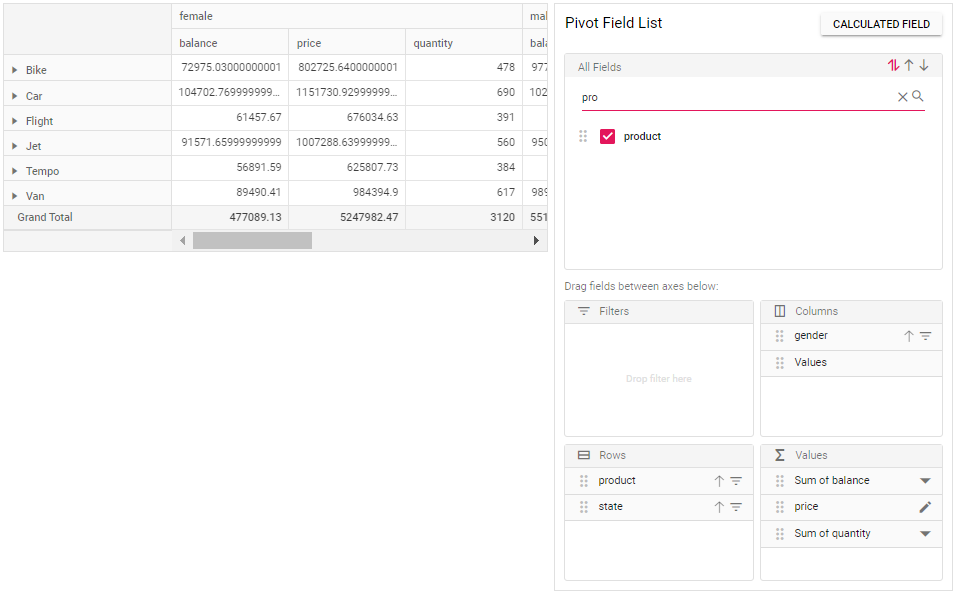
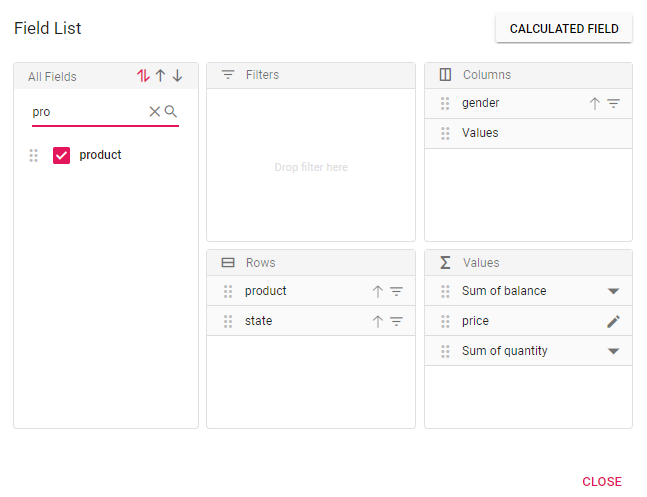
End user can search for desired field in the field list UI by typing the field name into the search box at runtime. It can be enabled by setting the enableFieldSearching property to true via code-behind.
NOTE
By default, field search option is disabled in the field list UI.
To enable search box in the static field list UI, set the enableFieldSearching property to true in PivotFieldList.
@using Syncfusion.EJ2.PivotView

@Html.EJS().PivotView("PivotView").Height("300").EnginePopulated("onGridEnginePopulate").Render()
<br />
@Html.EJS().PivotFieldList("Static_FieldList").RenderMode(Mode.Fixed).DataSourceSettings(dataSource => dataSource.DataSource((IEnumerable<object>)ViewBag.DataSource).ExpandAll(false).EnableSorting(true)
 .FormatSettings(formatsettings =>
 {
     formatsettings.Name("Amount").Format("C0").MaximumSignificantDigits(10).MinimumSignificantDigits(1).UseGrouping(true).Add();
 }).Rows(rows =>
 {
     rows.Name("Country").Add(); rows.Name("Products").Add();
 }).Columns(columns =>
 {
     columns.Name("Year").Caption("Year").Add(); columns.Name("Quarter").Add();
 }).Values(values =>
 {
     values.Name("Sold").Caption("Units Sold").Add(); values.Name("Amount").Caption("Sold Amount").Add();
 })).EnginePopulated("onFieldListEnginePopulate").EnableFieldSearching(true).Render()

<style>
    #Static_FieldList {
        width: 400px;
    }
</style>

<script>
    var pivotObj; var fieldlistObj;
    function onGridEnginePopulate(args) {
        pivotObj = document.getElementById('PivotView').ej2_instances[0];
        fieldlistObj = document.getElementById('PivotFieldList').ej2_instances[0];
        if (fieldlistObj) {
            fieldlistObj.update(pivotObj);
        }
    }
    function onFieldListEnginePopulate(args) {
        pivotObj = document.getElementById('PivotView').ej2_instances[0];
        fieldlistObj = document.getElementById('PivotFieldList').ej2_instances[0];
        fieldlistObj.updateView(pivotObj);
    }
</script>
public ActionResult Index()
{
var data = GetPivotData();
ViewBag.DataSource = data;
return View();
}
To enable search box in the pivot table’s built-in popup field list UI, set the enableFieldSearching property to true in PivotView.
@using Syncfusion.EJ2.PivotView

@Html.EJS().Button("fieldlistbtn").Content("Field List").IsPrimary(true).Render()

<div id="Popup_FieldList"></div>

@Html.EJS().PivotView("PivotView").Height("300").EnginePopulated("onGridEnginePopulate").EnableFieldSearching(true).Render()

@Html.EJS().PivotFieldList("PivotFieldList").RenderMode(Syncfusion.EJ2.PivotView.Mode.Popup).Target("#Popup_FieldList").DataSourceSettings(dataSource => dataSource.DataSource((IEnumerable<object>)ViewBag.DataSource).ExpandAll(false).EnableSorting(true).EnableFieldSearch(true)
 .FormatSettings(formatsettings =>
 {
     formatsettings.Name("Amount").Format("C0").MaximumSignificantDigits(10).MinimumSignificantDigits(1).UseGrouping(true).Add();
 }).Rows(rows =>
 {
     rows.Name("Country").Add(); rows.Name("Products").Add();
 }).Columns(columns =>
 {
     columns.Name("Year").Caption("Year").Add(); columns.Name("Quarter").Add();
 }).Values(values =>
 {
     values.Name("Sold").Caption("Units Sold").Add(); values.Name("Amount").Caption("Sold Amount").Add();
 })).EnginePopulated("onFieldListEnginePopulate").Render()

<style>
    .e-toggle-field-list {
        display: none !important;
    }
</style>

<script>
    var pivotObj; var fieldlistObj;
    function onGridEnginePopulate(args) {
        pivotObj = document.getElementById('PivotView').ej2_instances[0];
        fieldlistObj = document.getElementById('PivotFieldList').ej2_instances[0];
        if (fieldlistObj) {
            fieldlistObj.update(pivotObj);
        }
    }
    function onFieldListEnginePopulate(args) {
        pivotObj = document.getElementById('PivotView').ej2_instances[0];
        fieldlistObj = document.getElementById('PivotFieldList').ej2_instances[0];
        fieldlistObj.updateView(pivotObj);
    }
    document.getElementById('fieldlistbtn').onclick = function () {
        fieldlistObj = document.getElementById('PivotFieldList').ej2_instances[0];
        fieldlistObj.dialogRenderer.fieldListDialog.show();
    };
</script>
public ActionResult Index()
{
var data = GetPivotData();
ViewBag.DataSource = data;
return View();
}
Option to sort fields
End user can sort fields in the field list UI to ascending (or) descending (or) default order (as obtained from the data source) using the built-in sort icons.
By default, fields are displayed in the default order.
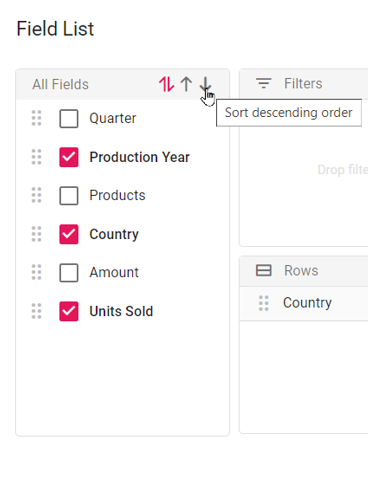
Sort fields in a desired order
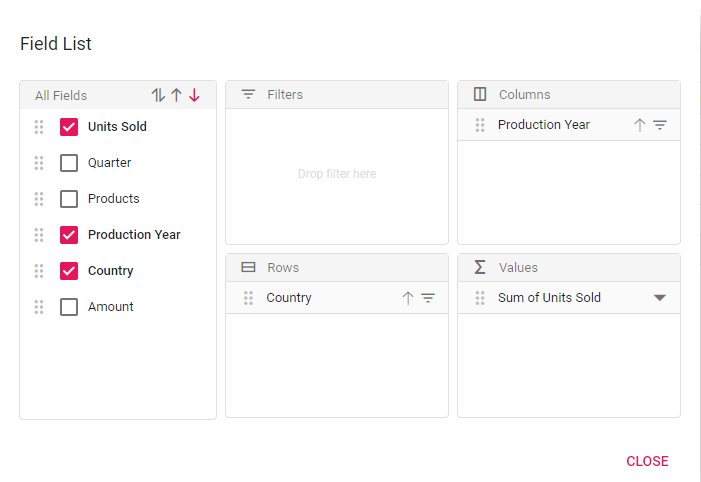
To display the fields in descending order by default, set the DefaultFieldListOrder property to Descending in the Load event.
@Html.EJS().PivotView("PivotView").Height(350).Load("onLoad").DataSourceSettings(dataSource => dataSource.DataSource((IEnumerable<object>)ViewBag.DataSource).ExpandAll(false).AllowLabelFilter(true)
.AllowValueFilter(true).FormatSettings(formatsettings =>
{
    formatsettings.Name("Amount").Format("C0").Add();
}).Rows(rows =>
{
    rows.Name("Country").Add();
}).Columns(columns =>
{
    columns.Name("Year").Caption("Production Year").Add();
}).Values(values =>
{
    values.Name("Sold").Caption("Units Sold").Add();
})).ShowFieldList(true).ShowGroupingBar(true).Render()

<script>
    function onLoad(args) {
        args.defaultFieldListOrder = 'Descending';
    }
</script>
public ActionResult Index()
{
var data = GetPivotData();
ViewBag.DataSource = data;
return View();
}
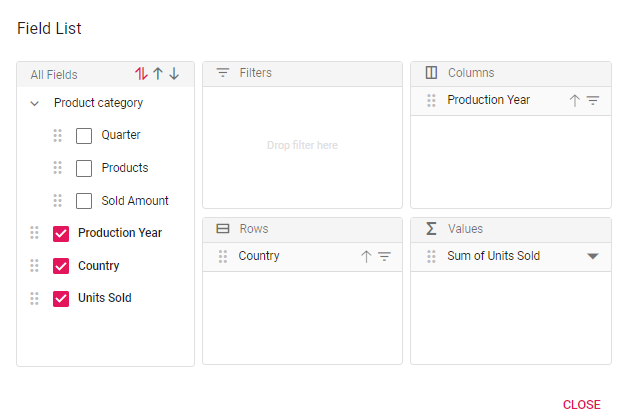
Group fields under desired folder name
In the field list UI, you can display fields by grouping them under the desired folder name. It can only be configured via code-behind by setting the GroupName property in FieldMapping.
NOTE
You can only group fields to one level using the
GroupNameproperty.
@using Syncfusion.EJ2.PivotView

@Html.EJS().PivotView("PivotView").Height(340).DataSourceSettings(dataSource => dataSource.DataSource((IEnumerable<object>)ViewBag.DataSource).ExpandAll(false).AllowLabelFilter(true).AllowValueFilter(true)
 .FormatSettings(formatsettings =>
 {
     formatsettings.Name("Amount").Format("C0").MaximumSignificantDigits(10).MinimumSignificantDigits(1).UseGrouping(true).Add();
 }).Rows(rows =>
 {
     rows.Name("Country").Add();
 }).Columns(columns =>
 {
     columns.Name("Year").Caption("Production Year").Add();
 }).Values(values =>
 {
     values.Name("Sold").Caption("Units Sold").Add();
 })).FieldMapping(fields=>
 {
     fields.Name("Quarter").GroupName("Product category").Add();
     fields.Name("Products").GroupName("Product category").Add();
     fields.Name("Amount").GroupName("Product category").Caption("Sold Amount").Add();
 }).ShowGroupingBar(true).ShowFieldList(true).Render()
public ActionResult Index()
{
var data = GetPivotData();
ViewBag.DataSource = data;
return View();
}
Add or remove fields
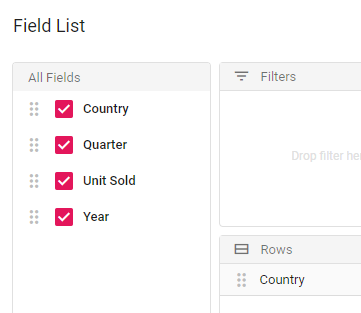
Using check box besides each field, end user can select or unselect to add or remove fields respectively from the report at runtime.
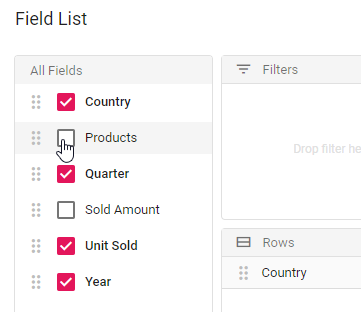
Remove specific field(s) from displaying
When a data source is bound to the component, fields will be automatically populated inside the Field List. In such case, user can also restrict specific field(s) from displaying. To do so, set the appropriate field name(s) in ExcludeFields property belonging to PivotViewDataSourceSettings class.
@Html.EJS().PivotView("PivotView").Height("300").DataSourceSettings(dataSource => dataSource.DataSource((IEnumerable<object>)ViewBag.DataSource).ExpandAll(false).EnableSorting(true).AllowLabelFilter(true).AllowValueFilter(true)
    .FormatSettings(formatsettings =>
    {
        formatsettings.Name("Amount").Format("C0").MaximumSignificantDigits(10).MinimumSignificantDigits(1).UseGrouping(true).Add();
    }).Rows(rows =>
    {
        rows.Name("Country").Add(); rows.Name("Products").Add();
    }).Columns(columns =>
    {
        columns.Name("Year").Caption("Year").Add(); columns.Name("Quarter").Add();
    }).Values(values =>
    {
        values.Name("Sold").Caption("Units Sold").Add(); values.Name("Amount").Caption("Sold Amount").Add();
    }).ExcludeFields(ViewBag.Excludefields)).ShowFieldList(true).Render()
public ActionResult Index()
{
var data = GetPivotData();
ViewBag.DataSource = data;
ViewBag.Excludefields = new string[] { "Products", "Amount" };
return View();
}
Re-arranging fields
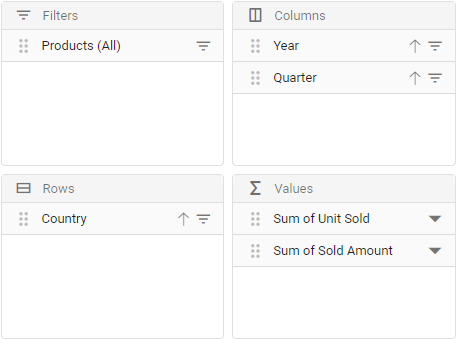
In-order to re-arrange, drag any field from the field list and drop it into the column, row, value, or filter axis using the drag-and-drop holder. It helps end user to alter the report at runtime.
Filtering members
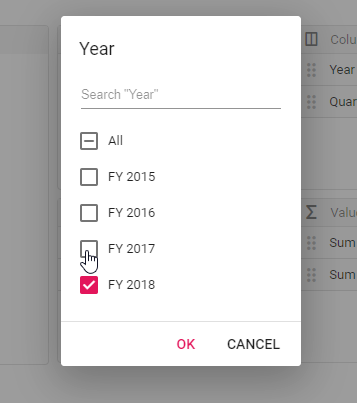
Using the filter icon besides each field in row, column and filter axes, members can be either included or excluded at runtime. To know more about member filtering, refer here.
![]()

Sorting members
Using the sort icon besides each field in row and column axes, members can be arranged either in ascending or descending order at runtime. To know more about member sorting, refer here.
![]()

Calculated fields
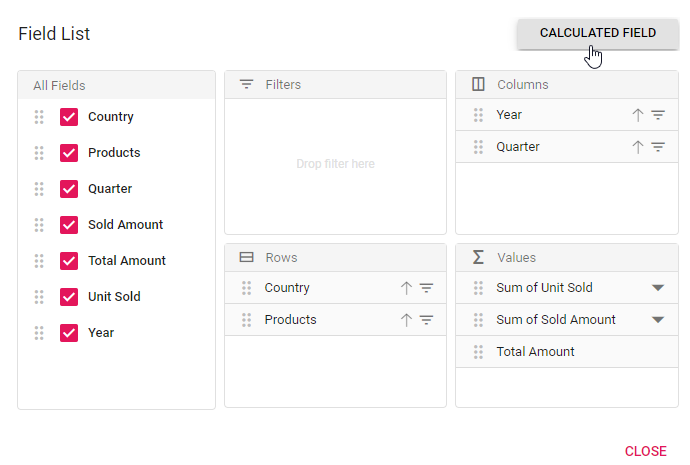
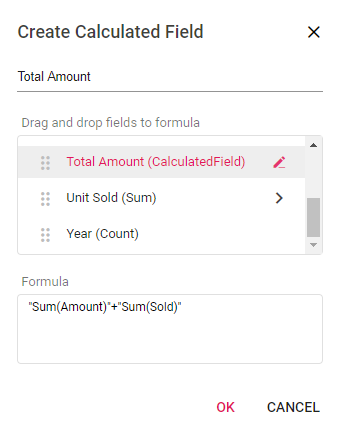
The calculated field support allows end user to add a new calculated field based on the available fields from the bound data source using basic arithmetic operators. To enable this support in Field List UI, set the AllowCalculatedField property in PivotView class to true in pivot table. Now a button will be seen automatically inside the field list UI which will invoke the calculated field dialog on click. To know more about calculated field, refer here.

Changing aggregation type of value fields at runtime
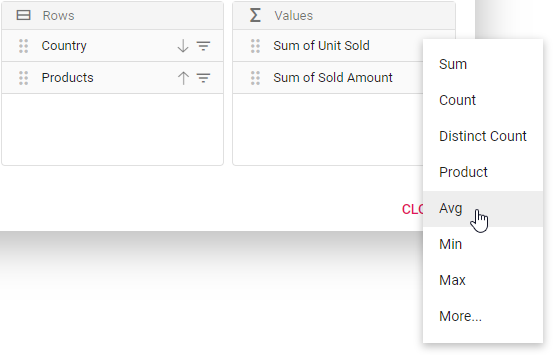
End user can perform calculations over a group of values using the aggregation option. The value fields bound to the field list, appears with a dropdown icon, helps to select an appropriate aggregation type at runtime. On selection, the values in the Pivot Table will be changed dynamically. To know more about aggregation, refer here.
![]()

Defer layout update
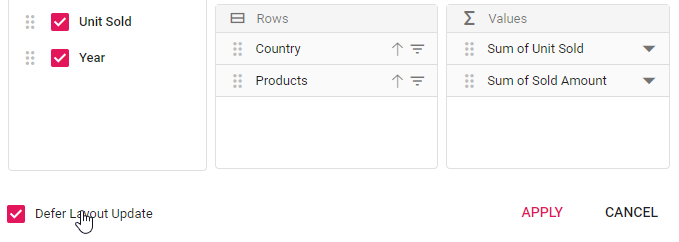
Defer layout update support to update the pivot table only on demand and not during every user action. To enable this support in Field List UI, set the AllowDeferLayoutUpdate property in PivotView class to true in pivot table. Now a check box inside Field List UI will be seen in checked state, allowing pivot table to update only on demand. To know more about defer layout, refer here.
Show built-in Field List (Popup) over specific target
By passing the target element to the built-in field list dialog module in the dataBound event, the field list dialog will be displayed over the appropriate target element on a web page. By default, the Pivot Table’s parent element is used as the target element to display the built-in field list dialog.
The sample code below shows the built-in field list dialog using document.body as the target element.
@using Syncfusion.EJ2.PivotView

@Html.EJS().PivotView("PivotView").Height("300").Width(650).DataSourceSettings(dataSourceSettings => dataSourceSettings.DataSource((IEnumerable<object>)ViewBag.DataSource).ExpandAll(false)
.FormatSettings(formatsettings =>
{
    formatsettings.Name("Amount").Format("C0").MaximumSignificantDigits(10).MinimumSignificantDigits(1).UseGrouping(true).Add();
}).Rows(rows =>
{
    rows.Name("Country").Add(); rows.Name("Products").Add();
}).Columns(columns =>
{
    columns.Name("Year").Caption("Year").Add(); columns.Name("Quarter").Add();
}).Values(values =>
{
    values.Name("Sold").Caption("Units Sold").Add(); values.Name("Amount").Caption("Sold Amount").Add();
})).DataBound("ondataBound").ShowFieldList(true).Render()

<script>
    function ondataBound(args) {
        var pivotTableObj = document.getElementById('PivotView').ej2_instances[0];
        pivotTableObj.pivotFieldListModule.dialogRenderer.fieldListDialog.target = document.body;
    }
</script>
public ActionResult Index()
{
var data = GetPivotData();
ViewBag.DataSource = data;
return View();
}
Show field list using toolbar
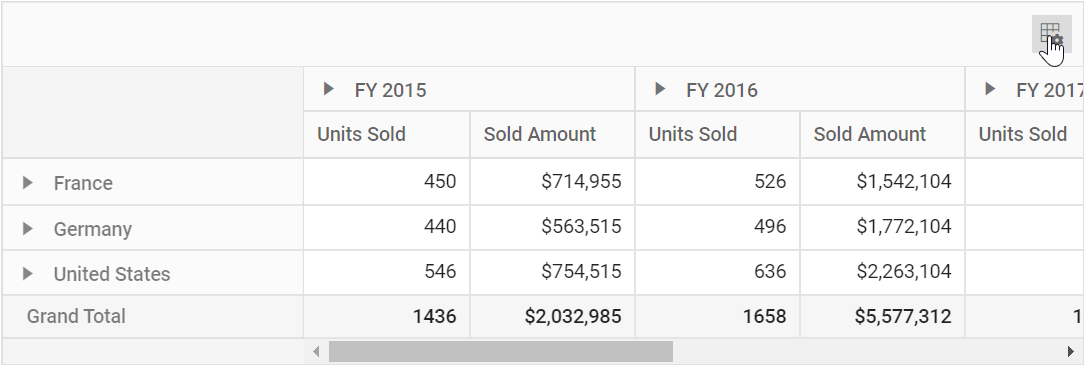
It can also be viewed in toolbar by setting ShowFieldList and ShowToolbar properties in PivotView class to true. Also, include the item FieldList within the Toolbar property in PivotView class. When toolbar is enabled, field list icon will be automatically added into the toolbar and the icon won’t appear on top left corner in the pivot table component.
@using Syncfusion.EJ2.PivotView

@Html.EJS().PivotView("pivotview").Width("100%").Height("300").ShowToolbar(true).ShowFieldList(true).AllowExcelExport(true).AllowNumberFormatting(true).AllowConditionalFormatting(true).AllowPdfExport(true).ShowToolbar(true).AllowCalculatedField(true).DataSourceSettings(dataSource => dataSource.DataSource((IEnumerable<object>)ViewBag.DataSource).ExpandAll(false).EnableSorting(true)
.FormatSettings(formatsettings =>
{
    formatsettings.Name("Amount").Format("C0").MaximumSignificantDigits(10).MinimumSignificantDigits(1).UseGrouping(true).Add();
})
.Rows(rows =>
{
    rows.Name("Country").Add(); rows.Name("Products").Add();
})
.Columns(columns =>
{
    columns.Name("Year").Add(); columns.Name("Quarter").Add();
})
.Values(values =>
{
    values.Name("Sold").Caption("Units Sold").Add();
    values.Name("Amount").Caption("Sold Amount").Add();
})
).Toolbar(new List<string>() { "FieldList" }).Render()
public ActionResult Index()
{
var data = GetPivotData();
ViewBag.DataSource = data;
return View();
}
Set caption to fields which isn’t bound to the report
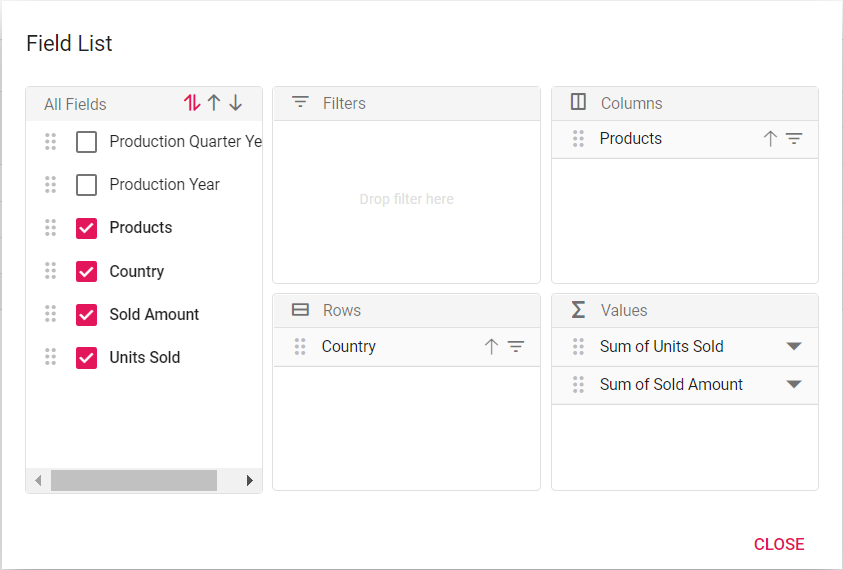
One can set the caption to all fields from the data source even if it is not bound to the actual report. It can be achieved using the EnginePopulated event. On doing so, caption of the respective field will be displayed in both grouping bar and field list.
In the sample, we have set caption to the fields Year and Quarter dynamically.
@Html.EJS().PivotView("PivotView").Height("300").EnginePopulated("onGridEnginePopulate").DataSourceSettings(dataSource => dataSource.DataSource((IEnumerable<object>)ViewBag.DataSource)
    .FormatSettings(formatsettings =>
    {
        formatsettings.Name("Amount").Format("C0").MaximumSignificantDigits(10).MinimumSignificantDigits(1).UseGrouping(true).Add();
    }).Rows(rows =>
    {
        rows.Name("Country").Add();
    }).Columns(columns =>
    {
        columns.Name("Products").Add();
    }).Values(values =>
    {
        values.Name("Sold").Caption("Units Sold").Add();
        values.Name("Amount").Caption("Sold Amount").Add();
    })).ShowFieldList(true).Render()


     <script>
    var pivotObj;
    function onGridEnginePopulate(args) {
        pivotObj = document.getElementById('PivotView').ej2_instances[0];
         Object.keys(pivotObj.engineModule.fieldList).forEach((key, index) => {
                if (key === 'Quarter') {
                    pivotObj.engineModule.fieldList[key].caption = 'Production Quarter Year';
                }
                else if (key === 'Year') {
                    pivotObj.engineModule.fieldList[key].caption = 'Production Year';
                }
      });

    }
</script>
public IActionResult Index()
{
var data = GetPivotData();
ViewBag.DataSource = data;
return View();
}
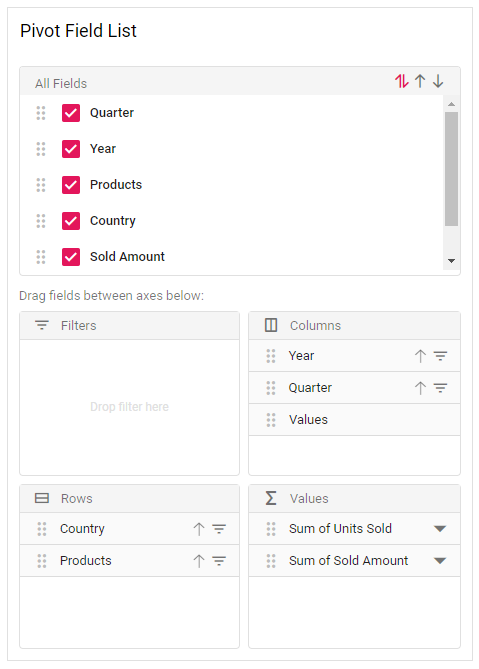
During runtime, the Values button in the field list can be moved to a different position (i.e., different index) among other fields in the column or row axis. To enable the Values button, set the showValuesButton property to true.
NOTE
This support is only available for relational data sources.
@using Syncfusion.EJ2.PivotView

@Html.EJS().PivotView("PivotView").Height("300").EnginePopulated("onGridEnginePopulate").Render()
<br />
@Html.EJS().PivotFieldList("PivotFieldList").RenderMode(Mode.Fixed).DataSourceSettings(dataSource => dataSource.DataSource((IEnumerable<object>)ViewBag.DataSource).ExpandAll(false).EnableSorting(true)
 .FormatSettings(formatsettings =>
 {
     formatsettings.Name("Amount").Format("C0").MaximumSignificantDigits(10).MinimumSignificantDigits(1).UseGrouping(true).Add();
 }).Rows(rows =>
 {
     rows.Name("Country").Add(); rows.Name("Products").Add();
 }).Columns(columns =>
 {
     columns.Name("Year").Caption("Year").Add(); columns.Name("Quarter").Add();
 }).Values(values =>
 {
     values.Name("Sold").Caption("Units Sold").Add(); values.Name("Amount").Caption("Sold Amount").Add();
 })).EnginePopulated("onFieldListEnginePopulate").ShowValuesButton(true).Render()

<style>
    #Static_FieldList {
        width: 400px;
    }
</style>

<script>
    var pivotObj; var fieldlistObj;
    function onGridEnginePopulate(args) {
        pivotObj = document.getElementById('PivotView').ej2_instances[0];
        fieldlistObj = document.getElementById('PivotFieldList').ej2_instances[0];
        if (fieldlistObj) {
            fieldlistObj.update(pivotObj);
        }
    }
    function onFieldListEnginePopulate(args) {
        pivotObj = document.getElementById('PivotView').ej2_instances[0];
        fieldlistObj = document.getElementById('PivotFieldList').ej2_instances[0];
        fieldlistObj.updateView(pivotObj);
    }
</script>
public ActionResult Index()
{
var data = GetPivotData();
ViewBag.DataSource = data;
return View();
}
Events
EnginePopulated
The EnginePopulated event is available in both Pivot Table and Field List.
-
The event
EnginePopulatedis triggered in field list whenever the report gets modified. The updated report is passed to the pivot table viaUpdateViewmethod written within this event to refresh the same. -
Likewise,
EnginePopulatedevent is triggered in pivot table whenever the report gets modified. The updated report is passed to the field list viaUpdatemethod written within this event to refresh the same.
The event EnginePopulated is triggered after engine is populated. It has following parameters - DataSourceSettings, PivotFieldList and PivotValues.
NOTE
This event is not required for Popup field list since it is a in built one.
@using Syncfusion.EJ2.PivotView

@Html.EJS().PivotView("PivotView").Height("300").EnginePopulated("onGridEnginePopulate").Render()
<br />
@Html.EJS().PivotFieldList("Static_FieldList").RenderMode(Mode.Fixed).DataSourceSettings(dataSource => dataSource.DataSource((IEnumerable<object>)ViewBag.DataSource).ExpandAll(false).EnableSorting(true)
 .FormatSettings(formatsettings =>
 {
     formatsettings.Name("Amount").Format("C0").MaximumSignificantDigits(10).MinimumSignificantDigits(1).UseGrouping(true).Add();
 }).Rows(rows =>
 {
     rows.Name("Country").Add(); rows.Name("Products").Add();
 }).Columns(columns =>
 {
     columns.Name("Year").Caption("Year").Add(); columns.Name("Quarter").Add();
 }).Values(values =>
 {
     values.Name("Sold").Caption("Units Sold").Add(); values.Name("Amount").Caption("Sold Amount").Add();
 })).EnginePopulated("onFieldListEnginePopulate").Render()

<style>
    #Static_FieldList {
        width: 400px;
    }
</style>

<script>
    var pivotObj; var fieldlistObj;
    function onGridEnginePopulate(args) {
        pivotObj = document.getElementById('PivotView').ej2_instances[0];
        fieldlistObj = document.getElementById('PivotFieldList').ej2_instances[0];
        if (fieldlistObj) {
            fieldlistObj.update(pivotObj);
        }
    }
    function onFieldListEnginePopulate(args) {
        pivotObj = document.getElementById('PivotView').ej2_instances[0];
        fieldlistObj = document.getElementById('PivotFieldList').ej2_instances[0];
        fieldlistObj.updateView(pivotObj);
    }
</script>
public ActionResult Index()
{
var data = GetPivotData();
ViewBag.DataSource = data;
return View();
}FieldListRefreshed
The event FieldListRefreshed is triggered whenever there is any change done in the field list UI. It has following parameter - DataSourceSettings and PivotValues. It allows user to identify each field list update. This event is applicable only for static field list.
@using Syncfusion.EJ2.PivotView

   @Html.EJS().PivotView("PivotGrid").Height("300").DataSource(dataSource => dataSource.Data((IEnumerable<object>)ViewBag.Data).FieldListRefreshed("fieldListRefreshed").ExpandAll(false).EnableSorting(true).AllowLabelFilter(true).AllowValueFilter(true)
    .FormatSettings(formatsettings =>
    {
        formatsettings.Name("Amount").Format("C0").MaximumSignificantDigits(10).MinimumSignificantDigits(1).UseGrouping(true).Add();
    }).Rows(rows =>
    {
        rows.Name("Country").Add(); rows.Name("Products").Add();
    }).Columns(columns =>
    {
        columns.Name("Year").Caption("Year").Add(); columns.Name("Quarter").Add();
    }).Values(values =>
    {
        values.Name("Sold").Caption("Units Sold").Add(); values.Name("Amount").Caption("Sold Amount").Add();
    })).ShowFieldList(true).Render()

<script>
    function fieldListRefreshed(args) {
        //Triggers, whenever field list get refreshed.
    }
</script>
public ActionResult Index()
{
var data = GetPivotData();
ViewBag.DataSource = data;
return View();
}FieldDropped
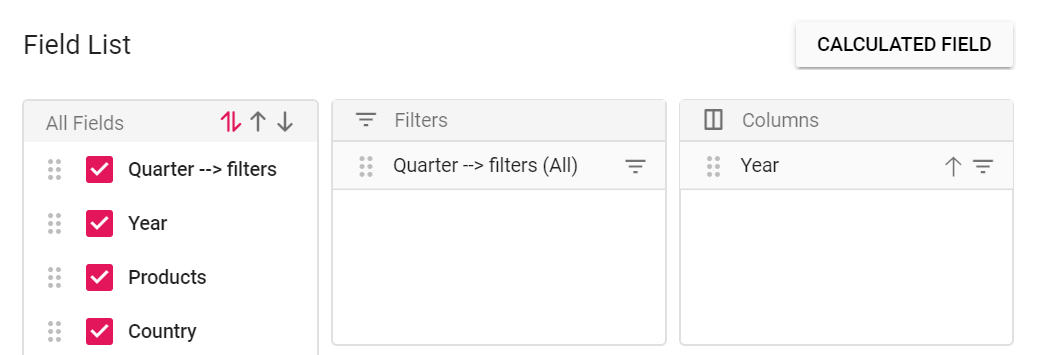
The event OnFieldDropped fires whenever a field is dropped in an axis. It has following parameters - DroppedAxis, DroppedField and DataSourceSettings. In this illustration, we have modified the DroppedField caption through this event at runtime.
@using Syncfusion.EJ2.PivotView

@Html.EJS().PivotView("PivotView").Height("300").DataSourceSettings(dataSource => dataSource.DataSource((IEnumerable<object>)ViewBag.DataSource).ExpandAll(false).EnableSorting(true).AllowLabelFilter(true).AllowValueFilter(true)
 .FormatSettings(formatsettings =>
 {
     formatsettings.Name("Amount").Format("C0").MaximumSignificantDigits(10).MinimumSignificantDigits(1).UseGrouping(true).Add();
 }).Rows(rows =>
 {
     rows.Name("Country").Add(); rows.Name("Products").Add();
 }).Columns(columns =>
 {
     columns.Name("Year").Caption("Year").Add(); columns.Name("Quarter").Add();
 }).Values(values =>
 {
     values.Name("Sold").Caption("Units Sold").Add(); values.Name("Amount").Caption("Sold Amount").Add();
 })
 ).ShowFieldList(true).OnFieldDropped("onFieldDropped").Render()

<script>
    var pivotGridObj;
    function onFieldDropped(args) {
        args.droppedField.caption = args.droppedField.name + " --> " + args.droppedAxis;
    }
</script>
public ActionResult Index()
{
var data = GetPivotData();
ViewBag.data = data;
return View();
}
ActionBegin
The event actionBegin triggers when the UI actions such as sorting, filtering, aggregation or edit calculated field, that are present in the field list UI begin. This allows user to identify the current action being performed at runtime. It has the following parameters:
-
dataSourceSettings: It holds the current data source settings such as input data source, rows, columns, values, filters, format settings and so on. -
actionName: It holds the name of the current action began. The following are the UI actions and their names:
| Action | Action Name |
|---|---|
Sort icon |
Sort field |
Filter icon |
Filter field |
Aggregation (Value type drop down and menu) |
Aggregate field |
Edit icon |
Edit calculated field |
Calculated field button |
Open calculated field dialog |
Field list |
Open field list |
Field list tree – Sort icon |
Sort field tree |
-
fieldInfo: It holds the selected field information.
NOTE
This option is applicable only when the field based UI actions are performed such as filtering, sorting, removing field from grouping bar, editing and aggregation type change.
-
cancel: It allows user to restrict the current action.
In the below sample, opening pop-up field list can be restricted by setting the args.cancel option to true in the actionBegin event.
@using Syncfusion.EJ2.PivotView

@Html.EJS().PivotView("PivotView").Height("300").DataSourceSettings(dataSource => dataSource.DataSource((IEnumerable<object>)ViewBag.DataSource).ExpandAll(false).EnableSorting(true).AllowLabelFilter(true).AllowValueFilter(true)
 .FormatSettings(formatsettings =>
 {
     formatsettings.Name("Amount").Format("C0").MaximumSignificantDigits(10).MinimumSignificantDigits(1).UseGrouping(true).Add();
 }).Rows(rows =>
 {
     rows.Name("Country").Add(); rows.Name("Products").Add();
 }).Columns(columns =>
 {
     columns.Name("Year").Caption("Year").Add(); columns.Name("Quarter").Add();
 }).Values(values =>
 {
     values.Name("Sold").Caption("Units Sold").Add(); values.Name("Amount").Caption("Sold Amount").Add();
 })
 ).ShowFieldList(true).ActionBegin("actionBegin").Render()

<script>
    function actionBegin(args) {
        if (args.actionName == 'Open field list') {
            args.cancel = true;
        }
    }
</script>
public ActionResult Index()
{
var data = GetPivotData();
ViewBag.DataSource = data;
return View();
}ActionComplete
The event actionComplete triggers when the UI actions such as sorting, filtering, aggregation or edit calculated field, that are present in the field list UI, is completed. This allows user to identify the current UI actions being completed at runtime. It has the following parameters:
-
dataSourceSettings: It holds the current data source settings such as input data source, rows, columns, values, filters, format settings and so on. -
actionName: It holds the name of the current action completed. The following are the UI actions and their names:
| Action | Action Name |
|---|---|
Sort icon |
Field sorted |
Filter icon |
Field filtered |
Aggregation(Value type drop down and menu) |
Field aggregated |
Edit icon |
Calculated field edited |
Calculated field button |
Calculated field applied |
Field list |
Field list closed |
Field list tree – Sort icon |
Field tree sorted |
-
fieldInfo: It holds the selected field information.
NOTE
This option is applicable only when the field based UI actions are performed such as filtering, sorting, removing field from grouping bar, editing and aggregation type change.
-
actionInfo: It holds the unique information about the current UI action. For example, if sorting is completed, the event argument contains information such as sort order and the field name.
@using Syncfusion.EJ2.PivotView

@Html.EJS().PivotView("PivotView").Height("300").DataSourceSettings(dataSource => dataSource.DataSource((IEnumerable<object>)ViewBag.DataSource).ExpandAll(false).EnableSorting(true).AllowLabelFilter(true).AllowValueFilter(true)
 .FormatSettings(formatsettings =>
 {
     formatsettings.Name("Amount").Format("C0").MaximumSignificantDigits(10).MinimumSignificantDigits(1).UseGrouping(true).Add();
 }).Rows(rows =>
 {
     rows.Name("Country").Add(); rows.Name("Products").Add();
 }).Columns(columns =>
 {
     columns.Name("Year").Caption("Year").Add(); columns.Name("Quarter").Add();
 }).Values(values =>
 {
     values.Name("Sold").Caption("Units Sold").Add(); values.Name("Amount").Caption("Sold Amount").Add();
 })
 ).ShowFieldList(true).ActionComplete("actionComplete").Render()

<script>
    function actionComplete(args) {
        if (args.actionName == 'Field list closed') {
            // Triggers when the field list dialog is closed.
        }
    }
</script>
public ActionResult Index()
{
var data = GetPivotData();
ViewBag.DataSource = data;
return View();
}ActionFailure
The event actionFailure triggers when the current UI action fails to achieve the desired result. It has the following parameters:
-
actionName: It holds the name of the current action failed. The following are the UI actions and their names:
| Action | Action Name |
|---|---|
Sort icon |
Sort field |
Filter icon |
Filter field |
Aggregation (Value type drop down and menu) |
Aggregate field |
Edit icon |
Edit calculated field |
Calculated field button |
Open calculated field dialog |
Field list |
Open field list |
Field list tree – Sort icon |
Sort field tree |
-
errorInfo: It holds the error information of the current UI action.
@using Syncfusion.EJ2.PivotView

@Html.EJS().PivotView("PivotView").Height("300").DataSourceSettings(dataSource => dataSource.DataSource((IEnumerable<object>)ViewBag.DataSource).ExpandAll(false).EnableSorting(true).AllowLabelFilter(true).AllowValueFilter(true)
 .FormatSettings(formatsettings =>
 {
     formatsettings.Name("Amount").Format("C0").MaximumSignificantDigits(10).MinimumSignificantDigits(1).UseGrouping(true).Add();
 }).Rows(rows =>
 {
     rows.Name("Country").Add(); rows.Name("Products").Add();
 }).Columns(columns =>
 {
     columns.Name("Year").Caption("Year").Add(); columns.Name("Quarter").Add();
 }).Values(values =>
 {
     values.Name("Sold").Caption("Units Sold").Add(); values.Name("Amount").Caption("Sold Amount").Add();
 })
 ).ShowFieldList(true).ActionFailure("actionFailure").Render()

<script>
    function actionFailure(args) {
        if (args.actionName == 'Open field list') {
            // Triggers when the current UI action fails to achieve the desired result.
        }
    }
</script>
public ActionResult Index()
{
var data = GetPivotData();
ViewBag.DataSource = data;
return View();
}