Pivot Chart in ASP.NET MVC Pivot Table Component
24 Apr 202624 minutes to read
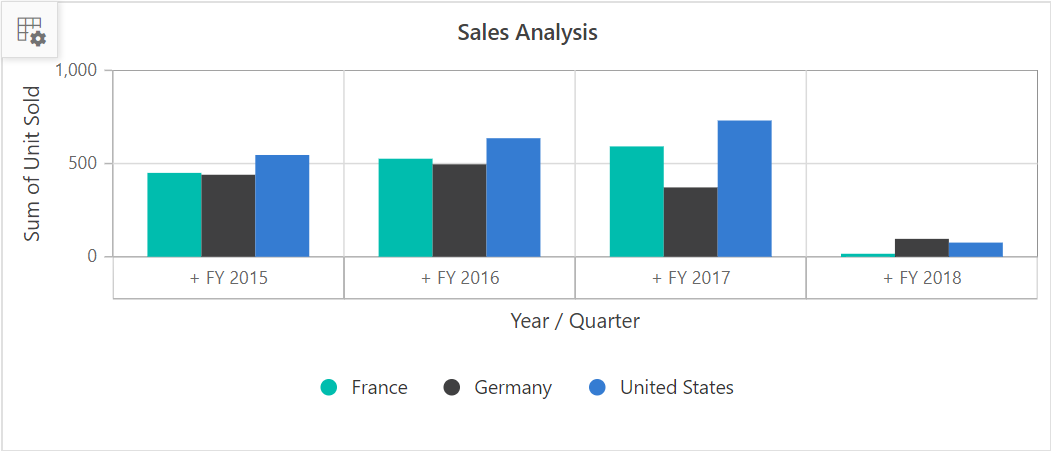
The Pivot Chart in the Syncfusion ASP.NET MVC Pivot Table component helps users visualize aggregated values in a clear and graphical format. It provides essential options like drill down and drill up operations, over 15 chart types, and various display settings for series, axes, legends, export, print, and tooltips. The main purpose of the Pivot Chart is to present Pivot Table data in a way that is easy to understand and interact with.
Users can display the pivot chart component individually with pivot values and modify the report dynamically using the field list and grouping bar. The PivotViewDisplayOption property in PivotView class allows users to control the visibility of both the grid and chart components. This property includes the following options:
-
View: Determines whether the Pivot Table component displays only the grid, only the chart, or both components. -
Primary: Specifies which component (grid or chart) appears as the primary view during initial loading. This option applies only when theViewproperty is set to Both.
To use the Pivot Chart, be sure to inject the
PivotChartServicemodule into your application.
The following sample shows the pivot chart component based on the pivot report bound to it.
@using Syncfusion.EJ2.PivotView

@Html.EJS().PivotView("PivotView").Height("300").DataSourceSettings(dataSourceSettings => dataSourceSettings.DataSource((IEnumerable<object>)ViewBag.DataSource).ExpandAll(false)
.FormatSettings(formatsettings =>
{
    formatsettings.Name("Amount").Format("C0").MaximumSignificantDigits(10).MinimumSignificantDigits(1).UseGrouping(true).Add();
}).Rows(rows =>
{
    rows.Name("Country").Add(); rows.Name("Products").Add();
}).Columns(columns =>
{
    columns.Name("Year").Caption("Year").Add(); columns.Name("Quarter").Add();
}).Values(values =>
{
    values.Name("Sold").Caption("Units Sold").Add(); values.Name("Amount").Caption("Sold Amount").Add();
})).DisplayOption(new PivotViewDisplayOption { View = View.Chart }).ChartSettings(chartSettings => chartSettings.ChartSeries(chartSeries => chartSeries.Type(ChartSeriesType.Column))).Render()
public ActionResult Index()
{
var data = GetPivotData();
ViewBag.DataSource = data;
return View();
}Data Binding
The Pivot Table component supports both local and remote data binding options to populate data in the pivot chart. Users can bind data to the component using the DataSource property, which accepts either an instance of DataManager for remote data sources or a JavaScript object array collection for local data. For further details, refer here.
Chart Types
The Pivot Chart offers 21 different chart types, allowing users to visualize and analyze data in various ways. You can choose any of these chart types based on your needs:
- Line
- Column
- Area
- Bar
- StepArea
- StackingLine
- StackingColumn
- StackingArea
- StackingBar
- StepLine
- Pareto
- Bubble
- Scatter
- Spline
- SplineArea
- StackingLine100
- StackingColumn100
- StackingBar100
- StackingArea100
- Polar
- Radar
By default, the ChartSeriesType.Line chart type is displayed in the Pivot Chart. Users can change the chart type at any time using the Type property under PivotChartSeries.
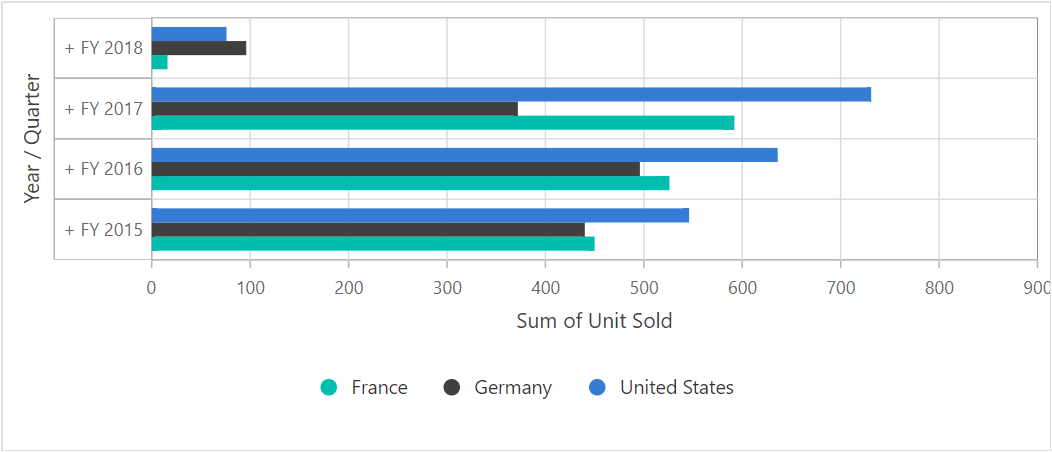
For example, to display a ChartSeriesType.Bar chart, set the chart type to ‘Bar’ within the Pivot Chart settings. Review the following code samples to see how to set this option:
@using Syncfusion.EJ2.PivotView

@Html.EJS().PivotView("PivotView").Height("300").DataSourceSettings(dataSourceSettings => dataSourceSettings.DataSource((IEnumerable<object>)ViewBag.DataSource).ExpandAll(false)
.FormatSettings(formatsettings =>
{
    formatsettings.Name("Amount").Format("C0").MaximumSignificantDigits(10).MinimumSignificantDigits(1).UseGrouping(true).Add();
}).Rows(rows =>
{
    rows.Name("Country").Add(); rows.Name("Products").Add();
}).Columns(columns =>
{
    columns.Name("Year").Caption("Year").Add(); columns.Name("Quarter").Add();
}).Values(values =>
{
    values.Name("Sold").Caption("Units Sold").Add(); values.Name("Amount").Caption("Sold Amount").Add();
})).DisplayOption(new PivotViewDisplayOption { View = View.Chart }).ChartSettings(chartSettings => chartSettings.ChartSeries(chartSeries => chartSeries.Type(ChartSeriesType.Bar))).Render()
public ActionResult Index()
{
var data = GetPivotData();
ViewBag.DataSource = data;
return View();
}
Accumulation Charts
Pivot Chart supports four types of accumulation charts:
- Pie
- Doughnut
- Funnel
- Pyramid
You can use any of these chart types to visualize your aggregated data clearly. To select a specific accumulation chart, set the Type property in the PivotChartSeries option.
In the code example below, the Pie chart is displayed by default. You can switch to other accumulation chart types, such as Doughnut, Funnel, or Pyramid, using the dropdown list.
@using Syncfusion.EJ2.PivotView
<div class="control-section" style="overflow:auto">
    <div id="dropdown-control" style="margin-bottom:5px;">
        <table style="width: 350px;">
            <tbody>
                <tr style="height: 50px">
                    <td>
                        <div>
                            <b>Chart Type:</b>
                        </div>
                    </td>
                    <td>
                        <div>
                            <select id="charttypes" name="ddl-view-mode">
                                <option value='Pie' selected>Pie</option>
                                <option value='Doughnut'>DoughNut</option>
                                <option value='Pyramid'>Pyramid</option>
                                <option value='Funnel'>Funnel</option>
                            </select>
                        </div>
                    </td>
                </tr>
            </tbody>
        </table>
    </div>
    <div class="content-wrapper">
        @Html.EJS().PivotView("PivotView").Height("300").ShowFieldList(true).DataSourceSettings(dataSourceSettings => dataSourceSettings.DataSource((IEnumerable<object>)ViewBag.DataSource).ExpandAll(false)
        .EnableSorting(true).Rows(rows =>
        {
            rows.Name("Country").Add();
            rows.Name("Products").Add();
        })
        .Columns(columns =>
        {
            columns.Name("Year").Add();
            columns.Name("Quarter").Add();
        })
        .Values(values =>
        {
            values.Name("Amount").Caption("Sales Amount").Add();values.Name("Sold").Caption("Units Sold").Add();
        })
        .FormatSettings(formatsettings =>
        {
            formatsettings.Name("Amount").Format("C").Add();
        })
        .Filters(filters =>
        {
            filters.Name("Product_Categories").Caption("Product Categories").Add();
        })).DisplayOption(new PivotViewDisplayOption { View = View.Chart }).ChartSettings(chartSettings => chartSettings.ChartSeries(chartseries =>chartseries.Type(ChartSeriesType.Pie))).Render();
    </div>
</div>
<script>
    var chartTypesDropDown = new ej.dropdowns.DropDownList({
        floatLabelType: "Auto",
        change: function (args) {
            var pivotObj = document.getElementById('PivotView').ej2_instances[0];
            pivotObj.chartSettings.chartSeries.type = args.value;
        }
    });
    chartTypesDropDown.appendTo("#charttypes");
</script>
public ActionResult Index()
{
var data = GetPivotData();
ViewBag.DataSource = data;
return View();
}
Drill down and up
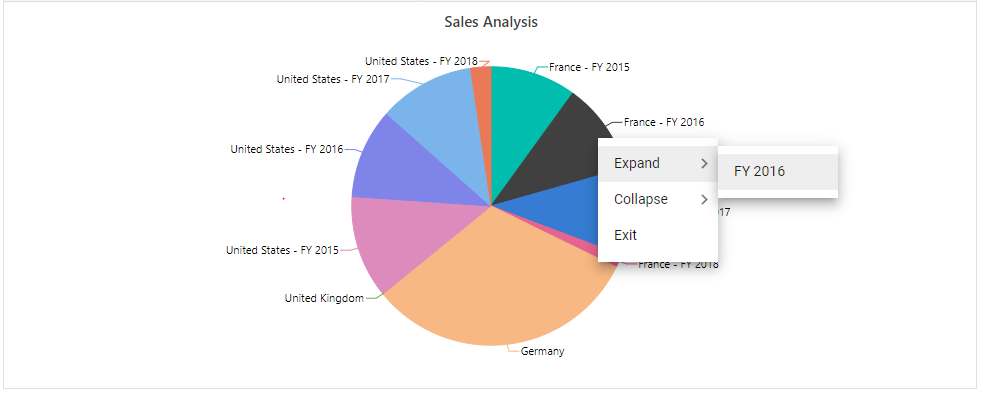
In accumulation charts, you can use the drill down and drill up options to explore data at different levels. When you click on a chart series, a built-in context menu appears with the following options:
- Expand: Drill down to view more detailed data for the selected series, continuing until the lowest level is reached.
- Collapse: Drill up to view higher-level, summarized information for that series, returning to the top level as needed.
- Exit: Close the context menu without making any changes.
You can use the drill operation for row headers only in accumulation charts.
@using Syncfusion.EJ2.PivotView
@Html.EJS().PivotView("PivotView").Height("300").ShowFieldList(true).DataSourceSettings(dataSourceSettings => dataSourceSettings.DataSource((IEnumerable<object>)ViewBag.DataSource).ExpandAll(false)
.EnableSorting(true).Rows(rows =>
{
    rows.Name("Country").Add();
    rows.Name("Year").Add();
    rows.Name("Quarter").Add();
})
.Columns(columns =>
{
  columns.Name("Products").Add();
})
.Values(values =>
{
    values.Name("Amount").Caption("Sales Amount").Add();values.Name("Sold").Caption("Units Sold").Add();
})
.FormatSettings(formatsettings =>
{
    formatsettings.Name("Amount").Format("C").Add();
})
.Filters(filters =>
{
    filters.Name("Product_Categories").Caption("Product Categories").Add();
})).DisplayOption(new PivotViewDisplayOption { View = View.Chart }).ChartSettings(chartSettings =>chartSettings.ChartSeries(chartSeries =>chartSeries.Type(ChartSeriesType.Pie))).Render();
public ActionResult Index()
{
var data = GetPivotData();
ViewBag.DataSource = data;
return View();
}
Column Headers and Delimiters
In accumulation charts, only the values from a single column in the pivot chart are displayed. By default, the first column is used. If you want to show values from a different column, you can specify the column headers with the columnHeader property in ChartSettings.
If the column has more than one header, enter all the headers separated by a delimiter, such as Germany-Road Bikes. You can set your preferred delimiter using the columnDelimiter property in ChartSettings. This allows you to display the correct values in your accumulation chart according to how your columns are grouped in the Pivot Table.
@using Syncfusion.EJ2.PivotView
@Html.EJS().PivotView("PivotView").Height("300").ShowFieldList(true).DataSourceSettings(dataSourceSettings => dataSourceSettings.DataSource((IEnumerable<object>)ViewBag.DataSource).ExpandAll(false)
.EnableSorting(true).DrilledMembers(drilledmembers =>
{
    drilledmembers.Name("Year").Items(new string[] { "FY 2016" }).Add();
})
.Rows(rows =>
{
    rows.Name("Country").Add();
    rows.Name("Products").Add();
})
.Columns(columns =>
{
    columns.Name("Year").Add();
    columns.Name("Quarter").Add();
})
.Values(values =>
{
    values.Name("Amount").Caption("Sales Amount").Add();values.Name("Sold").Caption("Units Sold").Add();
})
.FormatSettings(formatsettings =>
{
    formatsettings.Name("Amount").Format("C").Add();
})
.Filters(filters =>
{
    filters.Name("Product_Categories").Caption("Product Categories").Add();
})).DisplayOption(new PivotViewDisplayOption { View = View.Chart }).ChartSettings(chartSettings =>chartSettings.ChartSeries(chartSeries =>
{
    chartSeries.Type(ChartSeriesType.Doughnut);

}).ColumnHeader( "FY 2016-Q2" ).ColumnDelimiter("-")).Render();
public ActionResult Index()
{
var data = GetPivotData();
ViewBag.DataSource = data;
ViewBag.drilledMembers = new string[] { "FY 2015", "FY 2016" };
return View();
}
Label Customization
By default, the data labels in accumulation charts display the header name. You can control their visibility using the visible property in the dataLabel settings.
To improve label arrangement and prevent overlapping, the Smart Labels option arranges labels efficiently. You can disable this option by setting the enableSmartLabels property to false in the ChartSettings.
The position property in dataLabel allows you to specify where the data label appears. The available options are:
-
Outside: Places the label outside the chart point. This is the default option. -
Inside: Places the label inside the chart point.
In the following code sample, the data labels are placed inside the chart points.
@using Syncfusion.EJ2.PivotView

@Html.EJS().PivotView("PivotView").Height("300").ShowFieldList(true).DataSourceSettings(dataSourceSettings => dataSourceSettings.DataSource((IEnumerable<object>)ViewBag.DataSource).ExpandAll(false)
.EnableSorting(true).Rows(rows =>
{
    rows.Name("Country").Add();
    rows.Name("Products").Add();
})
.Columns(columns =>
{
    columns.Name("Year").Add();
    columns.Name("Quarter").Add();
})
.Values(values =>
{
    values.Name("Amount").Caption("Sales Amount").Add();values.Name("Sold").Caption("Units Sold").Add();
})
.FormatSettings(formatsettings =>
{
    formatsettings.Name("Amount").Format("C").Add();
})
.Filters(filters =>
{
    filters.Name("Product_Categories").Caption("Product Categories").Add();
})).DisplayOption(new PivotViewDisplayOption { View = View.Chart }).ChartSettings(chartSettings => chartSettings.ChartSeries(chartSeries =>chartSeries.Type(ChartSeriesType.Pyramid).DataLabel(datalabel=> datalabel.Position("Inside")))).Render()
public ActionResult Index()
{
var data = GetPivotData();
ViewBag.DataSource = data;
ViewBag.position = Position;
return View();
}
public PivotViewPivotChartDataLabel Position = new PivotViewPivotChartDataLabel { Position = "Inside" };
The Connector Line appears when data labels are positioned outside the chart. You can style this connector line using the connectorStyle property in dataLabel to modify its color, length, width, and other properties. In the example below, the connector line appearance is changed to show a different style.
@using Syncfusion.EJ2.PivotView

@Html.EJS().PivotView("PivotView").Height("300").ShowFieldList(true).DataSourceSettings(dataSourceSettings => dataSourceSettings.DataSource((IEnumerable<object>)ViewBag.DataSource).ExpandAll(false)
.EnableSorting(true).Rows(rows =>
{
    rows.Name("Country").Add();
    rows.Name("Products").Add();
})
.Columns(columns =>
{
    columns.Name("Year").Add();
    columns.Name("Quarter").Add();
})
.Values(values =>
{
    values.Name("Amount").Caption("Sales Amount").Add();values.Name("Sold").Caption("Units Sold").Add();
})
.FormatSettings(formatsettings =>
{
    formatsettings.Name("Amount").Format("C").Add();
})
.Filters(filters =>
{
    filters.Name("Product_Categories").Caption("Product Categories").Add();
})).DisplayOption(new PivotViewDisplayOption { View = View.Chart }).ChartSettings(chartSettings => chartSettings.ChartSeries(chartSeries =>chartSeries.Type(ChartSeriesType.Funnel).DataLabel(datalabel=>
{
    datalabel.Position("OutSide");
    datalabel.ConnectorStyle(connector=>connector.Color("#f4429e").DashArray("5,3").Length("50px").Width(2));
}))).Render()
public ActionResult Index()
{
var data = GetPivotData();
ViewBag.DataSource = data;
ViewBag.position = Position;
return View();
}
public PivotViewPivotChartDataLabel Position = new PivotViewPivotChartDataLabel { Position = "OutSide" };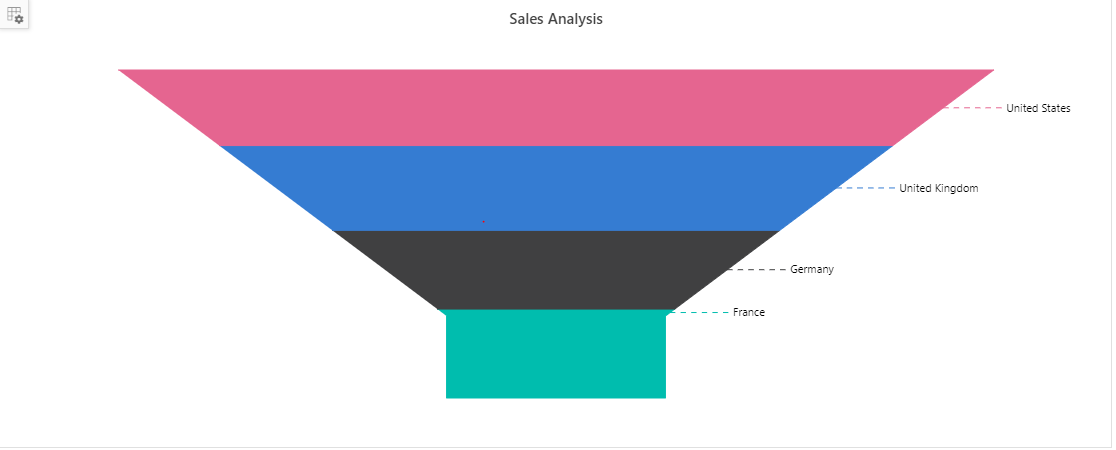
Pie and Doughnut Customization
You can draw pie and doughnut charts within a specific range by using the startAngle and endAngle properties in the PivotChartSeries configuration. The default value for the startAngle property is 0, and the endAngle property is 360. By modifying these properties, you can create semi-pie and semi-doughnut charts.
@using Syncfusion.EJ2.PivotView
@Html.EJS().PivotView("PivotView").Height("300").ShowFieldList(true).DataSourceSettings(dataSourceSettings => dataSourceSettings.DataSource((IEnumerable<object>)ViewBag.DataSource).ExpandAll(false)
.EnableSorting(true).Rows(rows =>
{
    rows.Name("Country").Add();
    rows.Name("Products").Add();
})
.Columns(columns =>
{
    columns.Name("Year").Add();
    columns.Name("Quarter").Add();
})
.Values(values =>
{
    values.Name("Amount").Caption("Sales Amount").Add();values.Name("Sold").Caption("Units Sold").Add();
})
.FormatSettings(formatsettings =>
{
    formatsettings.Name("Amount").Format("C").Add();
})
.Filters(filters =>
{
    filters.Name("Product_Categories").Caption("Product Categories").Add();
})).DisplayOption(new PivotViewDisplayOption { View = View.Chart }).ChartSettings(chartSettings =>
chartSettings.ChartSeries(chartSeries =>
    {
        chartSeries.Type(ChartSeriesType.Doughnut);
        chartSeries.StartAngle(270);
        chartSeries.EndAngle(90);
    }
)).Render()
public ActionResult Index()
{
var data = GetPivotData();
ViewBag.DataSource = data;
return View();
}
You can convert a pie chart to a doughnut chart and vice-versa using the innerRadius property in the PivotChartSeries configuration. When this property is set to a value greater than 0 percent, the chart appears as a doughnut instead of a pie chart.
This property accepts values only in percentage format.
@using Syncfusion.EJ2.PivotView
@Html.EJS().PivotView("PivotView").Height("300").ShowFieldList(true).DataSourceSettings(dataSourceSettings => dataSourceSettings.DataSource((IEnumerable<object>)ViewBag.DataSource).ExpandAll(false)
.EnableSorting(true).Rows(rows =>
{
    rows.Name("Country").Add();
    rows.Name("Products").Add();
})
.Columns(columns =>
{
    columns.Name("Year").Add();
    columns.Name("Quarter").Add();
})
.Values(values =>
{
    values.Name("Amount").Caption("Sales Amount").Add();values.Name("Sold").Caption("Units Sold").Add();
})
.FormatSettings(formatsettings =>
{
    formatsettings.Name("Amount").Format("C").Add();
})
.Filters(filters =>
{
    filters.Name("Product_Categories").Caption("Product Categories").Add();
})).DisplayOption(new PivotViewDisplayOption { View = View.Chart }).ChartSettings(chartSettings =>
chartSettings.ChartSeries(chartSeries =>
    {
        chartSeries.Type(ChartSeriesType.Pie);
        chartSeries.InnerRadius("140");
    }
)).Render()
public ActionResult Index()
{
var data = GetPivotData();
ViewBag.DataSource = data;
return View();
}
Exploding Series Points
You can make an individual point in a pivot chart stand out by enabling the exploding option. To do this, set the explode property in the PivotChartSeries to true. When this option is turned on, a chart point will separate from the rest of the series when a user clicks it with a mouse or taps it on a touch device. This makes it easier for users to highlight and identify specific data points in accumulation charts like Pie, Doughnut, Funnel, or Pyramid.
@using Syncfusion.EJ2.PivotView
@Html.EJS().PivotView("PivotView").Height("300").ShowFieldList(true).DataSourceSettings(dataSourceSettings => dataSourceSettings.DataSource((IEnumerable<object>)ViewBag.DataSource).ExpandAll(false)
.EnableSorting(true).Rows(rows =>
{
    rows.Name("Country").Add();
    rows.Name("Products").Add();
})
.Columns(columns =>
{
    columns.Name("Year").Add();
    columns.Name("Quarter").Add();
})
.Values(values =>
{
    values.Name("Amount").Caption("Sales Amount").Add();values.Name("Sold").Caption("Units Sold").Add();
})
.FormatSettings(formatsettings =>
{
    formatsettings.Name("Amount").Format("C").Add();
})
.Filters(filters =>
{
    filters.Name("Product_Categories").Caption("Product Categories").Add();
})).DisplayOption(new PivotViewDisplayOption { View = View.Chart }).ChartSettings(chartSettings =>
chartSettings.ChartSeries(chartSeries =>
    {
        chartSeries.Type(ChartSeriesType.Pie);
        chartSeries.Explode(true);
    }
)).Render();
public ActionResult Index()
{
var data = GetPivotData();
ViewBag.DataSource = data;
return View();
}
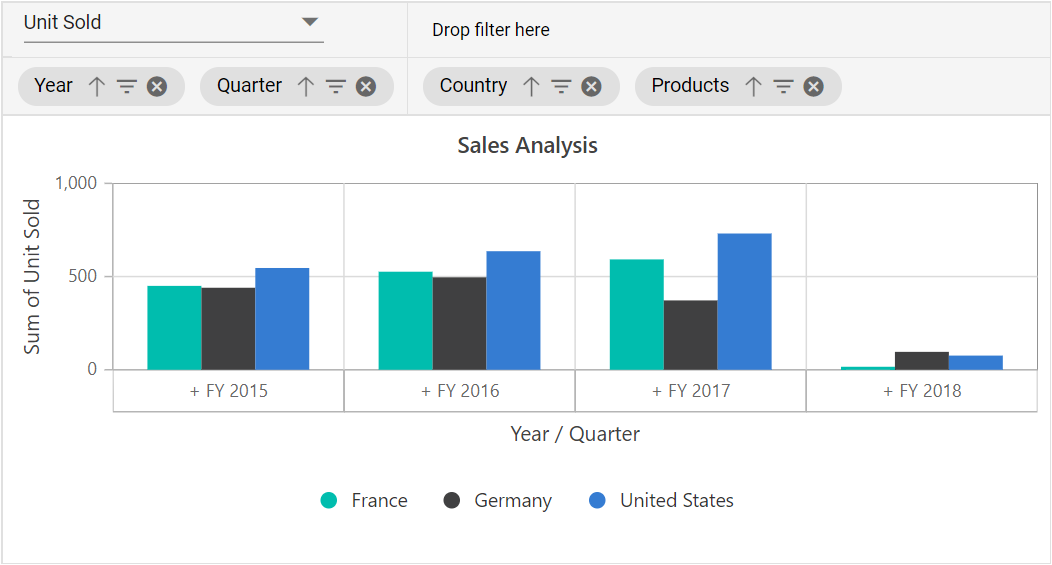
Field List
The field list makes it easy to add, remove, or rearrange fields in the pivot chart, so you can display exactly the data you need. To show the field list in the Pivot Chart, set the ShowFieldList pin PivotView class as true. When you make changes with the field list, the pivot chart updates right away to show the new results. To learn more about the field list and how it works, see the field list topic in the documentation.
The sample below demonstrates the field list shown in Popup mode within the pivot chart.
@using Syncfusion.EJ2.PivotView

@Html.EJS().PivotView("PivotView").Height("300").DataSourceSettings(dataSourceSettings => dataSourceSettings.DataSource((IEnumerable<object>)ViewBag.DataSource).ExpandAll(false)
.FormatSettings(formatsettings =>
{
    formatsettings.Name("Amount").Format("C0").MaximumSignificantDigits(10).MinimumSignificantDigits(1).UseGrouping(true).Add();
}).Rows(rows =>
{
    rows.Name("Country").Add(); rows.Name("Products").Add();
}).Columns(columns =>
{
    columns.Name("Year").Caption("Year").Add(); columns.Name("Quarter").Add();
}).Values(values =>
{
    values.Name("Sold").Caption("Units Sold").Add(); values.Name("Amount").Caption("Sold Amount").Add();
})).DisplayOption(new PivotViewDisplayOption { View = View.Chart }).ChartSettings(chartSettings => chartSettings.ChartSeries(chartSeries => chartSeries.Type(ChartSeriesType.Column))).ShowFieldList(true).Render()
public ActionResult Index()
{
var data = GetPivotData();
ViewBag.DataSource = data;
return View();
}
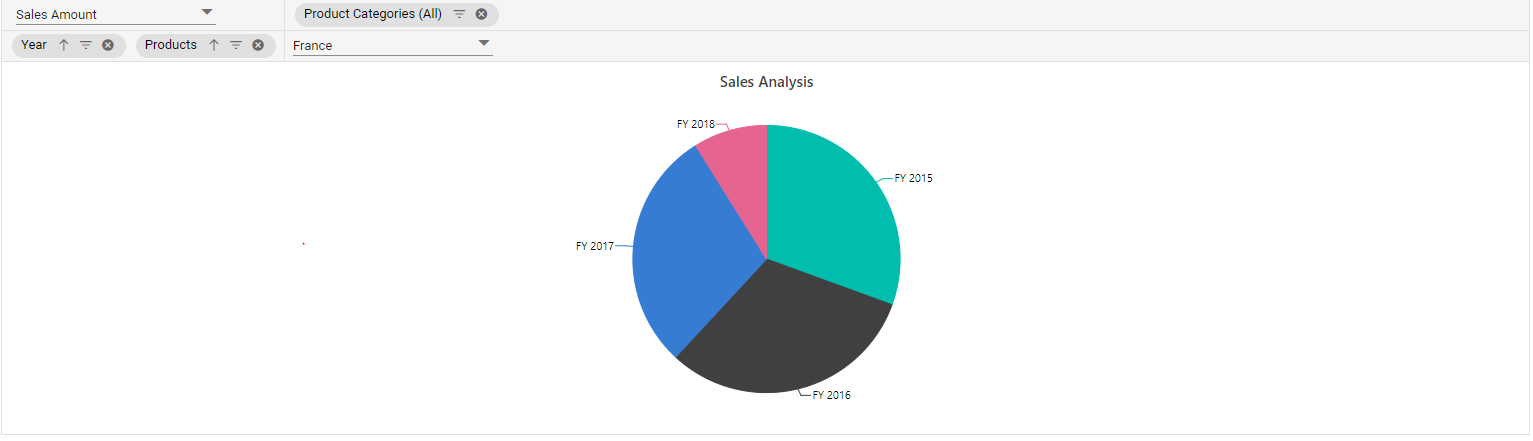
Grouping Bar
You can display the grouping bar in the Pivot Chart by setting the ShowGroupingBar in PivotView class as true. When enabled, the grouping bar in the pivot chart shows a drop-down list on the value axis. This drop-down lets users select from the value fields defined in PivotViewDataSourceSettings. Users can switch between these fields to update the chart based on the selected value field. This method of selection is the default behavior in the Pivot Chart component. For more details about how the grouping bar works, refer to the grouping bar documentation.
When there are multiple axes, buttons appear on the value axis instead of the drop-down list.
@using Syncfusion.EJ2.PivotView

@Html.EJS().PivotView("PivotView").Height("300").DataSourceSettings(dataSourceSettings => dataSourceSettings.DataSource((IEnumerable<object>)ViewBag.DataSource).ExpandAll(false)
.FormatSettings(formatsettings =>
{
    formatsettings.Name("Amount").Format("C0").MaximumSignificantDigits(10).MinimumSignificantDigits(1).UseGrouping(true).Add();
}).Rows(rows =>
{
    rows.Name("Country").Add(); rows.Name("Products").Add();
}).Columns(columns =>
{
    columns.Name("Year").Caption("Year").Add(); columns.Name("Quarter").Add();
}).Values(values =>
{
    values.Name("Sold").Caption("Units Sold").Add(); values.Name("Amount").Caption("Sold Amount").Add();
})).DisplayOption(new PivotViewDisplayOption { View = View.Chart }).ChartSettings(chartSettings => chartSettings.ChartSeries(chartSeries => chartSeries.Type(ChartSeriesType.Column))).ShowGroupingBar(true).Render()
public ActionResult Index()
{
var data = GetPivotData();
ViewBag.DataSource = data;
return View();
}
When using accumulation charts, the drop-down list appears on the column axis. This list contains the column headers available in the Pivot Chart. Users can switch column headers using this drop-down, and the accumulation chart will update with the selected header.
@using Syncfusion.EJ2.PivotView
@Html.EJS().PivotView("PivotView").Height("300").DisplayOption(new PivotViewDisplayOption { View = View.Chart }).ShowFieldList(true).DataSourceSettings(dataSourceSettings => dataSourceSettings.DataSource((IEnumerable<object>)ViewBag.Data).ExpandAll(false)
.EnableSorting(true).Rows(rows =>
{
    rows.Name("Country").Add();
    rows.Name("Products").Add();
})
.Columns(columns =>
{
    columns.Name("Year").Add();
    columns.Name("Quarter").Add();
})
.Values(values =>
{
    values.Name("Amount").Caption("Sales Amount").Add();values.Name("Sold").Caption("Units Sold").Add();
})
.FormatSettings(formatsettings =>
{
    formatsettings.Name("Amount").Format("C").Add();
})
.Filters(filters =>
{
    filters.Name("Product_Categories").Caption("Product Categories").Add();
})).ChartSettings(chartSettings =>
chartSettings.ChartSeries(chartSeries =>chartSeries.Type(ChartSeriesType.Pie)
)).ShowGroupingBar(true).Render();
public ActionResult Index()
{
var data = GetPivotData();
ViewBag.DataSource = data;
return View();
}
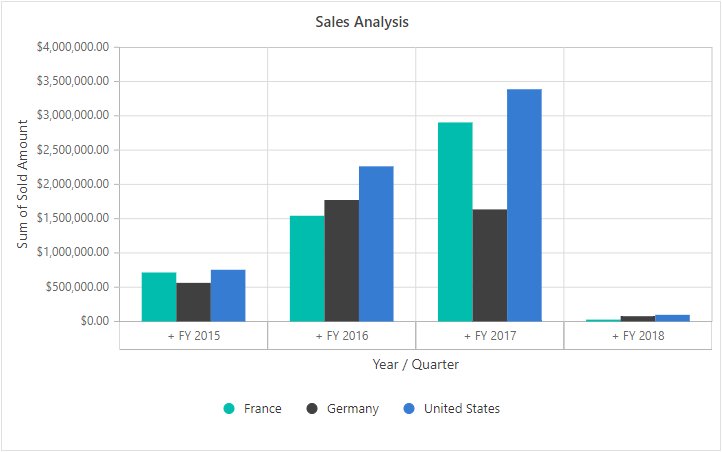
Single Axis
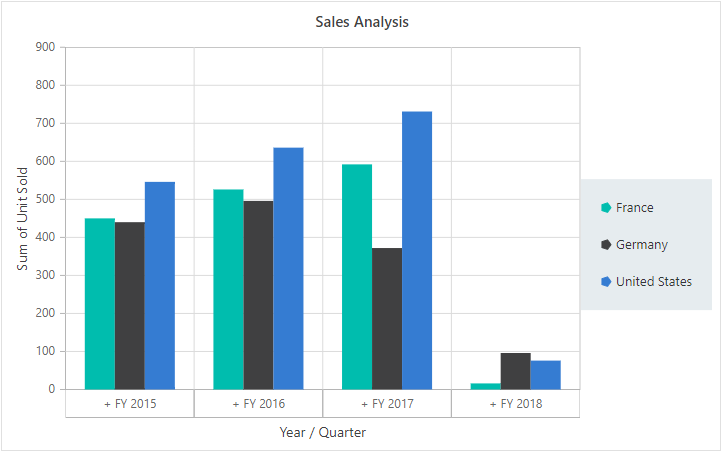
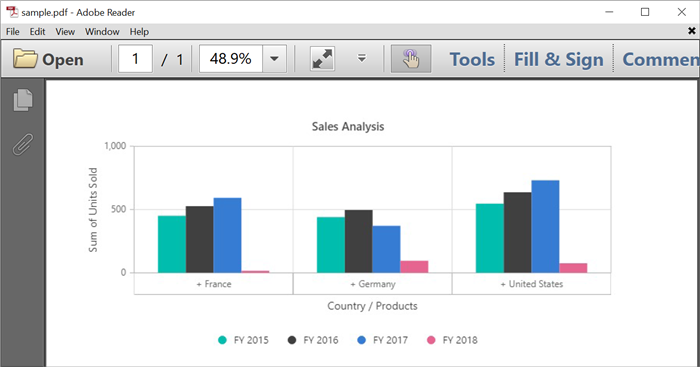
By default, the pivot chart uses the first value field (measure) from your report as the value axis. If you want to display data using a different value field, you can do this easily. Use the Value in ChartSettings class. This option lets you show a specific value field in the pivot chart, allowing you to focus on the data you need.
@using Syncfusion.EJ2.PivotView

@Html.EJS().PivotView("PivotView").Height("300").DataSourceSettings(dataSourceSettings => dataSourceSettings.DataSource((IEnumerable<object>)ViewBag.DataSource).ExpandAll(false)
.FormatSettings(formatsettings =>
{
    formatsettings.Name("Amount").Format("C0").MaximumSignificantDigits(10).MinimumSignificantDigits(1).UseGrouping(true).Add();
}).Rows(rows =>
{
    rows.Name("Country").Add(); rows.Name("Products").Add();
}).Columns(columns =>
{
    columns.Name("Year").Caption("Year").Add(); columns.Name("Quarter").Add();
}).Values(values =>
{
    values.Name("Sold").Caption("Units Sold").Add(); values.Name("Amount").Caption("Sold Amount").Add();
})).DisplayOption(new PivotViewDisplayOption { View = View.Chart }).ChartSettings(chartSettings => chartSettings.Value("Amount").Title("Sales Analysis").ChartSeries(chartSeries => chartSeries.Type(ChartSeriesType.Column))).Render()
public ActionResult Index()
{
var data = GetPivotData();
ViewBag.DataSource = data;
return View();
}
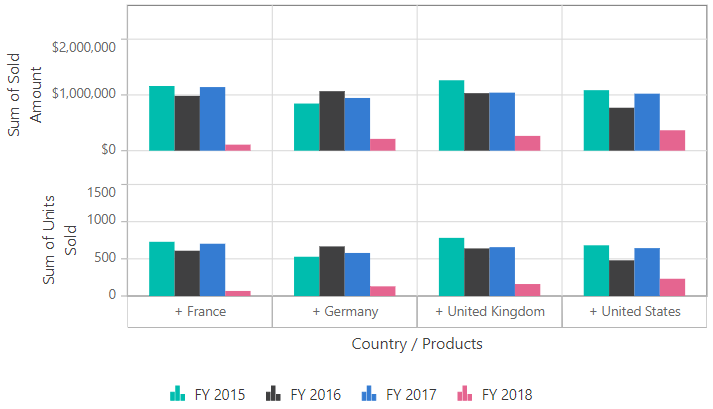
Multiple Axis
The pivot chart can be drawn with multiple value fields by setting the EnableMultipleAxis in ChartSettings class as true. In the following code sample, the pivot chart displays both value fields “Sold” and “Amount” from the PivotViewDataSourceSettings.
Multiple axis support is not applicable for accumulation chart types like pie, doughnut, pyramid, and funnel.
@using Syncfusion.EJ2.PivotView

@Html.EJS().PivotView("PivotView").Height("300").DataSourceSettings(dataSourceSettings => dataSourceSettings.DataSource((IEnumerable<object>)ViewBag.DataSource).ExpandAll(false)
.FormatSettings(formatsettings =>
{
    formatsettings.Name("Amount").Format("C0").MaximumSignificantDigits(10).MinimumSignificantDigits(1).UseGrouping(true).Add();
}).Rows(rows =>
{
    rows.Name("Country").Add(); rows.Name("Products").Add();
}).Columns(columns =>
{
    columns.Name("Year").Caption("Year").Add(); columns.Name("Quarter").Add();
}).Values(values =>
{
    values.Name("Sold").Caption("Units Sold").Add(); values.Name("Amount").Caption("Sold Amount").Add();
})).DisplayOption(new PivotViewDisplayOption { View = View.Chart }).ChartSettings(chartSettings => chartSettings.EnableMultipleAxis(true).ChartSeries(chartSeries => chartSeries.Type(ChartSeriesType.Column))).Render()
public ActionResult Index()
{
var data = GetPivotData();
ViewBag.DataSource = data;
return View();
}
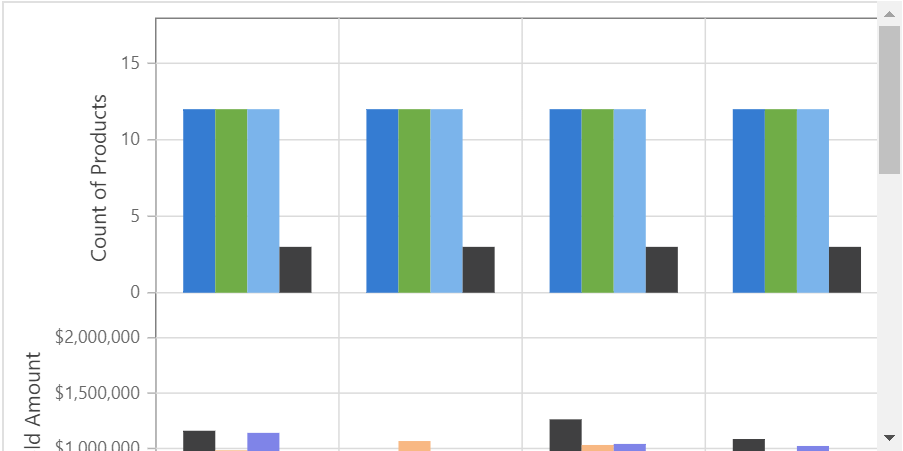
When binding more value fields, the result displays multiple pivot charts, with each chart shrinking within the parent container height. To prevent this behavior, set the EnableScrollOnMultiAxis property in ChartSettings to true. This ensures each pivot chart maintains a minimum height of “160px” to “180px” and displays a vertical scroll bar for better visibility.
@using Syncfusion.EJ2.PivotView

@Html.EJS().PivotView("PivotView").Height("300").DataSourceSettings(dataSourceSettings => dataSourceSettings.DataSource((IEnumerable<object>)ViewBag.DataSource).ExpandAll(false)
.FormatSettings(formatsettings =>
{
    formatsettings.Name("Amount").Format("C0").MaximumSignificantDigits(10).MinimumSignificantDigits(1).UseGrouping(true).Add();
}).Rows(rows =>
{
    rows.Name("Country").Add();
}).Columns(columns =>
{
    columns.Name("Year").Caption("Year").Add(); columns.Name("Quarter").Add();
}).Values(values =>
{
    values.Name("Sold").Caption("Units Sold").Add(); values.Name("Amount").Caption("Sold Amount").Add(); values.Name("Products").DataType("Count").Add();
})).DisplayOption(new PivotViewDisplayOption { View = View.Chart }).ChartSettings(chartSettings => chartSettings.EnableMultipleAxis(true).EnableScrollOnMultiAxis(true).ChartSeries(chartSeries => chartSeries.Type(ChartSeriesType.Column))).Render()
public ActionResult Index()
{
var data = GetPivotData();
ViewBag.DataSource = data;
return View();
}
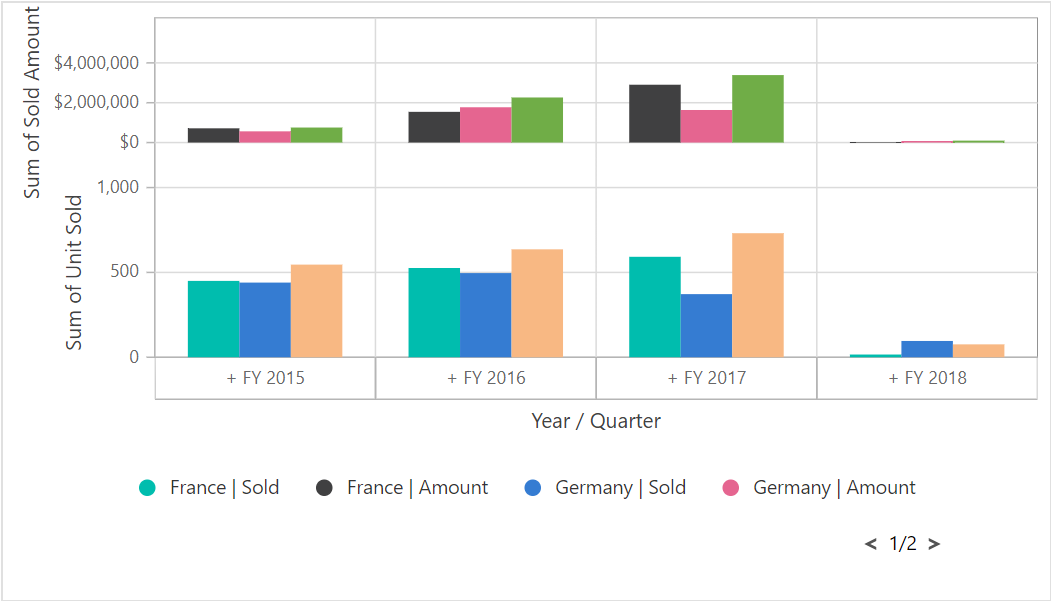
Meanwhile, there is another way to display multiple values in a chart. In this approach, the series drawn from multiple values are grouped and displayed in a single chart. And, based on the values, multiple Y axis scales will be framed with different ranges. This can be achieved by setting the properties EnableMultipleAxis as true and MultipleAxisMode as Single in ChartSettings.
In the following code sample, the pivot chart can be seen as a single chart with multiple value fields such as Sold and Amount that are drawn as multiple Y axis.
@using Syncfusion.EJ2.PivotView

@Html.EJS().PivotView("PivotView").Height("300").DataSourceSettings(dataSourceSettings => dataSourceSettings.DataSource((IEnumerable<object>)ViewBag.DataSource).ExpandAll(false)
.FormatSettings(formatsettings =>
{
    formatsettings.Name("Amount").Format("C0").MaximumSignificantDigits(10).MinimumSignificantDigits(1).UseGrouping(true).Add();
}).Rows(rows =>
{
    rows.Name("Country").Add(); rows.Name("Products").Add();
}).Columns(columns =>
{
    columns.Name("Year").Caption("Year").Add(); columns.Name("Quarter").Add();
}).Values(values =>
{
    values.Name("Sold").Caption("Units Sold").Add(); values.Name("Amount").Caption("Sold Amount").Add();
})).DisplayOption(new PivotViewDisplayOption { View = View.Chart }).ChartSettings(chartSettings => chartSettings.EnableMultipleAxis(true).MultipleAxisMode(MultipleAxisMode.Single).ChartSeries(chartSeries => chartSeries.Type(ChartSeriesType.Column))).Render()
public ActionResult Index()
{
var data = GetPivotData();
ViewBag.DataSource = data;
return View();
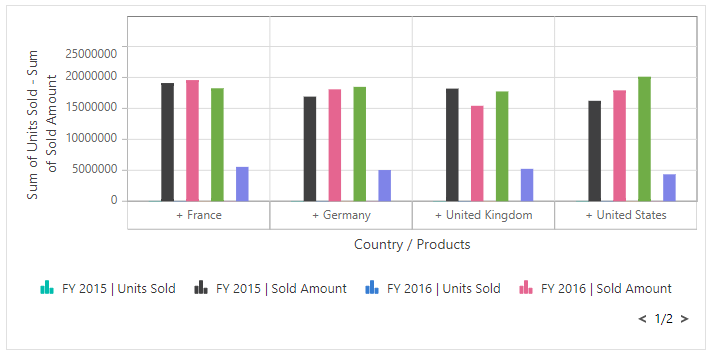
}Additionally, to display chart series for multiple values within a single y-axis, set the properties EnableMultipleAxis to true and the MultipleAxisMode to Combined, in the ChartSettings.
The y-axis range values will be formatted using the first value field on the value axis. For example, if the first value field is in currency format and the remaining value fields are in different number formats or no format, the y-axis range values will be displayed in the currency format of the first value field.
The pivot chart in the following code sample can be seen as a single chart with multiple value fields such as Sold and Amount drawn as a single y-axis.
@using Syncfusion.EJ2.PivotView

@Html.EJS().PivotView("PivotView").Height("450").DataSourceSettings(dataSourceSettings => dataSourceSettings.DataSource((IEnumerable<object>)ViewBag.DataSource).ExpandAll(false)
.FormatSettings(formatsettings =>
{
    formatsettings.Name("Amount").Format("C0").MaximumSignificantDigits(10).MinimumSignificantDigits(1).UseGrouping(true).Add();
}).Rows(rows =>
{
    rows.Name("Country").Add(); rows.Name("Products").Add();
}).Columns(columns =>
{
    columns.Name("Year").Caption("Production Year").Add(); columns.Name("Quarter").Add();
}).Values(values =>
{
    values.Name("Sold").Caption("Units Sold").Add(); values.Name("Amount").Caption("Sold Amount").Add();
})).DisplayOption(new PivotViewDisplayOption { View = View.Chart }).ChartSettings(chartSettings => chartSettings.EnableMultipleAxis(true).MultipleAxisMode(MultipleAxisMode.Combined).ChartSeries(chartSeries => chartSeries.Type(ChartSeriesType.Column))).Render()
public ActionResult Index()
{
var data = GetPivotData();
ViewBag.DataSource = data;
return View();
}
Show point color based on members
When you enable multiple axes in the pivot chart, you can use the ShowPointColorByMembers property in the ChartSettings to display the same color for each member on the column axis across all measures. Setting this property to true makes it easy for users to spot and compare each member throughout the entire chart.
In addition, users can show or hide specific members from all measures in the chart by clicking the corresponding legend item. This interaction allows users to focus on the members they want to analyze without distraction.
@using Syncfusion.EJ2.PivotView

@Html.EJS().PivotView("PivotView").Height("350").DataSourceSettings(dataSourceSettings => dataSourceSettings.DataSource((IEnumerable<object>)ViewBag.DataSource).ExpandAll(false).EnableSorting(true)
.FormatSettings(formatsettings =>
{
    formatsettings.Name("Amount").Format("C0").Add();
}).Rows(rows =>
{
    rows.Name("Country").Add(); rows.Name("Products").Add();
}).Columns(columns =>
{
    columns.Name("Year").Caption("Production Year").Add(); columns.Name("Quarter").Add();
}).Values(values =>
{
    values.Name("Sold").Caption("Units Sold").Add(); values.Name("Amount").Caption("Sold Amount").Add();
})).DisplayOption(new PivotViewDisplayOption { View = View.Chart }).ChartSettings(chartSettings => chartSettings.Value("Amount").EnableMultipleAxis(true).MultipleAxisMode(MultipleAxisMode.Stacked).ShowPointColorByMembers(true).ChartSeries(chartSeries => chartSeries.Type(ChartSeriesType.Column)).primaryYAxis(py => py.Border(Width("0")))).Render()
public ActionResult Index()
{
var data = GetPivotData();
ViewBag.DataSource = data;
return View();
}
Series customization
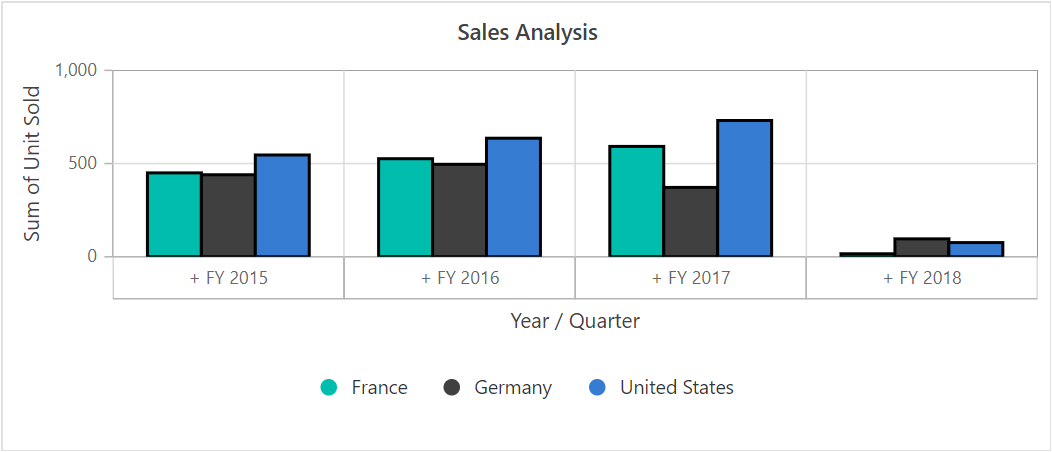
You can customize the series in the pivot chart by using the ChartSeries in ChartSettings class. Any changes you make to the ChartSeries property will apply to all series in the chart.
@using Syncfusion.EJ2.PivotView

@Html.EJS().PivotView("PivotView").Height("300").DataSourceSettings(dataSourceSettings => dataSourceSettings.DataSource((IEnumerable<object>)ViewBag.DataSource).ExpandAll(false)
.FormatSettings(formatsettings =>
{
    formatsettings.Name("Amount").Format("C0").MaximumSignificantDigits(10).MinimumSignificantDigits(1).UseGrouping(true).Add();
}).Rows(rows =>
{
    rows.Name("Country").Add(); rows.Name("Products").Add();
}).Columns(columns =>
{
    columns.Name("Year").Caption("Year").Add(); columns.Name("Quarter").Add();
}).Values(values =>
{
    values.Name("Sold").Caption("Units Sold").Add(); values.Name("Amount").Caption("Sold Amount").Add();
})).DisplayOption(new PivotViewDisplayOption { View = View.Chart }).ChartSettings(chartSettings => chartSettings.ChartSeries(chartSeries => chartSeries.Type(ChartSeriesType.Column).EnableTooltip(false).Border(border => border.Color("#000").Width(2)))).Render()
public ActionResult Index()
{
var data = GetPivotData();
ViewBag.DataSource = data;
return View();
}
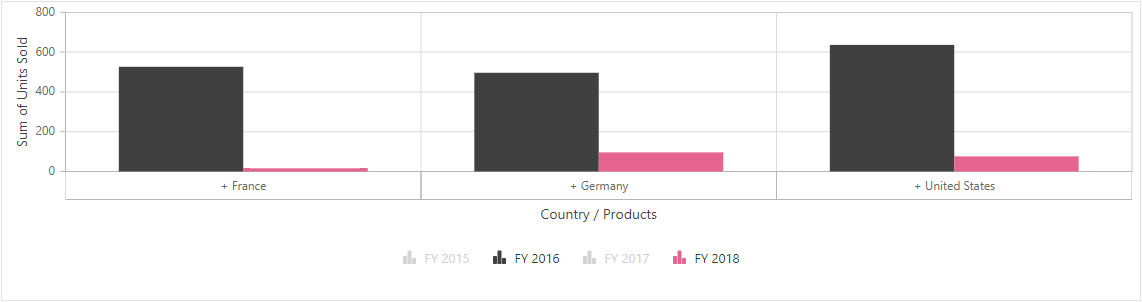
If you want to change each series separately, use the chartSeriesCreated event. This event happens after the pivot chart series are created, making it possible to work with each series one at a time.
The sample below shows how you can hide every even-numbered series in the pivot chart.
@using Syncfusion.EJ2.PivotView

@Html.EJS().PivotView("PivotView").Height("300").DataSourceSettings(dataSourceSettings => dataSourceSettings.DataSource((IEnumerable<object>)ViewBag.DataSource).ExpandAll(false)
.FormatSettings(formatsettings =>
{
    formatsettings.Name("Amount").Format("C0").MaximumSignificantDigits(10).MinimumSignificantDigits(1).UseGrouping(true).Add();
}).Rows(rows =>
{
    rows.Name("Country").Add(); rows.Name("Products").Add();
}).Columns(columns =>
{
    columns.Name("Year").Caption("Year").Add(); columns.Name("Quarter").Add();
}).Values(values =>
{
    values.Name("Sold").Caption("Units Sold").Add(); values.Name("Amount").Caption("Sold Amount").Add();
})).ChartSeriesCreated("chartSeriesCreated").DisplayOption(new PivotViewDisplayOption { View = View.Chart }).ChartSettings(chartSettings => chartSettings.ChartSeries(chartSeries => chartSeries.Type(ChartSeriesType.Column))).Render()

<script>
    function chartSeriesCreated(args) {
        for (var pos = 0; pos < args.series.length; pos++) {
            if (pos % 2 == 0) {
                args.series[pos].visible = false;
            }
        }
    }
</script>
public ActionResult Index()
{
var data = GetPivotData();
ViewBag.DataSource = data;
return View();
}
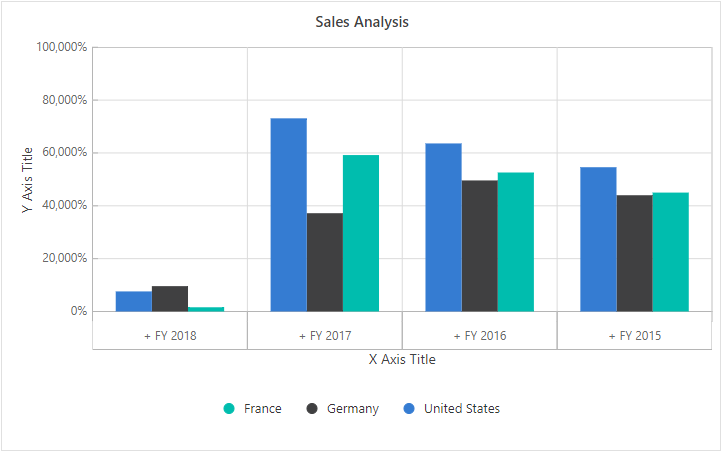
Axis Customization
Users can customize the x-axis and y-axis of the pivot chart using the PrimaryXAxis and PrimaryYAxis properties in ChartSettings class.
Please note that axis customization is not supported for accumulation chart types, such as pie, doughnut, pyramid, and funnel.
For example, in the sample below, the titles for the y-axis and x-axis are set to custom values.
@using Syncfusion.EJ2.PivotView

@Html.EJS().PivotView("PivotView").Height("300").DataSourceSettings(dataSourceSettings => dataSourceSettings.DataSource((IEnumerable<object>)ViewBag.DataSource).ExpandAll(false)
.FormatSettings(formatsettings =>
{
    formatsettings.Name("Amount").Format("C0").MaximumSignificantDigits(10).MinimumSignificantDigits(1).UseGrouping(true).Add();
}).Rows(rows =>
{
    rows.Name("Country").Add(); rows.Name("Products").Add();
}).Columns(columns =>
{
    columns.Name("Year").Caption("Year").Add(); columns.Name("Quarter").Add();
}).Values(values =>
{
    values.Name("Sold").Caption("Units Sold").Add(); values.Name("Amount").Caption("Sold Amount").Add();
})).DisplayOption(new PivotViewDisplayOption { View = View.Chart }).ChartSettings(chartSettings => chartSettings.ChartSeries(chartSeries => chartSeries.Type(ChartSeriesType.Column)).PrimaryXAxis(primaryXAxis => primaryXAxis.Title("X axis title")).PrimaryYAxis(primaryYAxis => primaryYAxis.Title("Y axis title"))).Render()
public ActionResult Index()
{
var data = GetPivotData();
ViewBag.DataSource = data;
return View();
}
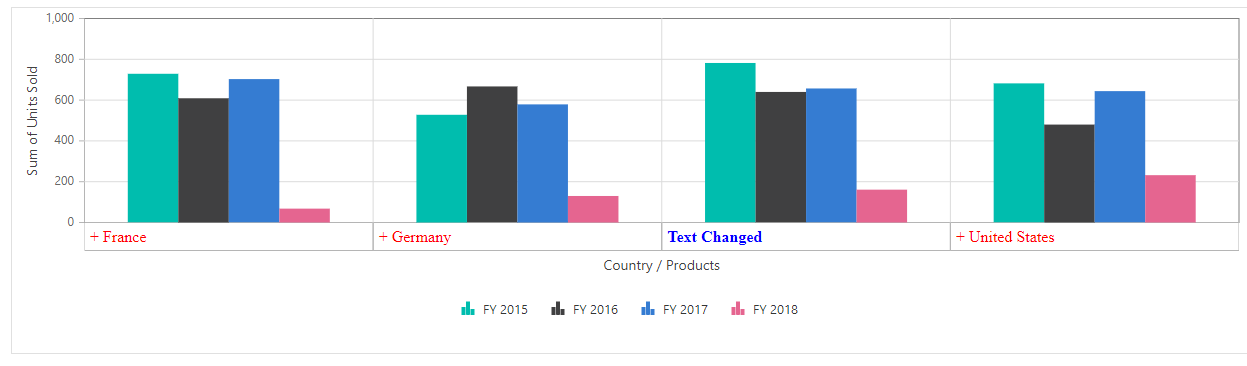
Users can also modify multi-level labels on the primary x-axis by using the MultiLevelLabelRender event in ChartSettings. This event is triggered whenever a multi-level label is rendered on the chart. The event provides the following options:
-
axis: Information about the current axis. -
text: Option to change the content of the multi-level label. -
textStyle: Option to adjust the font of the label. -
alignment: Option to set how the label text is aligned.
The example below shows how to update the text and style for multi-level labels on the pivot chart’s x-axis:
@using Syncfusion.EJ2.PivotView

@Html.EJS().PivotView("PivotView").Height("300").DataSourceSettings(dataSourceSettings => dataSourceSettings.DataSource((IEnumerable<object>)ViewBag.DataSource).ExpandAll(false)
.FormatSettings(formatsettings =>
{
    formatsettings.Name("Amount").Format("C0").MaximumSignificantDigits(10).MinimumSignificantDigits(1).UseGrouping(true).Add();
}).Rows(rows =>
{
    rows.Name("Country").Add(); rows.Name("Products").Add();
}).Columns(columns =>
{
    columns.Name("Year").Caption("Year").Add(); columns.Name("Quarter").Add();
}).Values(values =>
{
    values.Name("Sold").Caption("Units Sold").Add(); values.Name("Amount").Caption("Sold Amount").Add();
})).DisplayOption(new PivotViewDisplayOption { View = View.Chart }).ChartSettings(chartSettings => chartSettings.ChartSeries(chartSeries => chartSeries.Type(ChartSeriesType.Column)).MultiLevelLabelRender("multiLevelLabelRender")).Render()

<script>
    function multiLevelLabelRender(args) {
        args.alignment = 'Far';
        args.textStyle = { fontFamily: 'Bold', fontWeight: '400', size: '16px', color: 'red' };
        if (args.text === ' + United States') {
            args.text = 'Text Changed';
            args.alignment = 'Near';
            args.textStyle = { fontFamily: 'Bold', fontWeight: '800', size: '16px', color: 'Blue' };
        }
    }
</script>
public ActionResult Index()
{
var data = GetPivotData();
ViewBag.DataSource = data;
return View();
}
Legend customization
Users can easily change the legend in the pivot chart by using the LegendSettings option inside the ChartSettings property. By default, the legend is shown. If you want to hide it, set the Visible property in LegendSettings to false.
The pivot chart allows users to select from various legend shapes, including:
- Circle
- Rectangle
- VerticalLine
- Pentagon
- InvertedTriangle
- SeriesType (default)
- Triangle
- Diamond
- Cross
- HorizontalLine
The default shape for the legend is SeriesType, but you can change it by setting the LegendShape property in ChartSeries class.
Users can also choose where the legend appears in the pivot chart by setting the Position property in LegendSettings. The available positions include:
- Auto: Places the legend based on the chart area (default).
- Top: Shows the legend above the pivot chart.
- Left: Displays the legend to the left of the chart.
- Bottom: Places the legend below the chart.
- Right: Shows the legend on the right side.
- Custom: Positions the legend using specific x and y values you provide.
Note: Legends are not shown by default for accumulation charts such as pie, doughnut, pyramid, and funnel.
In the following code example, you can see how to set a different legend shape and position.
@using Syncfusion.EJ2.PivotView

@Html.EJS().PivotView("PivotView").Height("300").DataSourceSettings(dataSourceSettings => dataSourceSettings.DataSource((IEnumerable<object>)ViewBag.DataSource).ExpandAll(false)
.FormatSettings(formatsettings =>
{
    formatsettings.Name("Amount").Format("C0").MaximumSignificantDigits(10).MinimumSignificantDigits(1).UseGrouping(true).Add();
}).Rows(rows =>
{
    rows.Name("Country").Add(); rows.Name("Products").Add();
}).Columns(columns =>
{
    columns.Name("Year").Caption("Year").Add(); columns.Name("Quarter").Add();
}).Values(values =>
{
    values.Name("Sold").Caption("Units Sold").Add(); values.Name("Amount").Caption("Sold Amount").Add();
})).DisplayOption(new PivotViewDisplayOption { View = View.Chart }).ChartSettings(chartSettings => chartSettings.ChartSeries(chartSeries => chartSeries.Type(ChartSeriesType.Column).LegendShape("Pentagon")).LegendSettings(legendSettings => legendSettings.Position("Right"))).Render()
public ActionResult Index()
{
var data = GetPivotData();
ViewBag.DataSource = data;
return View();
}
User interaction
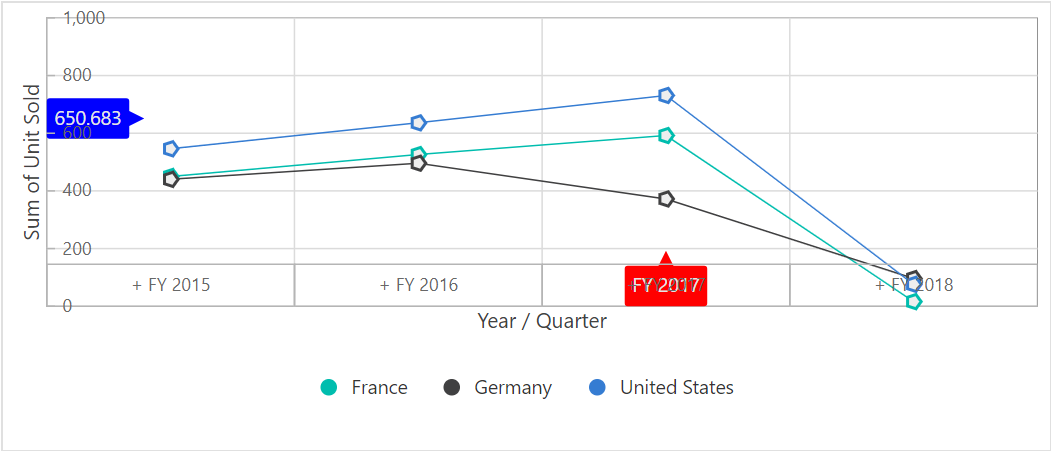
Marker and crossHair
You can show and customize markers and crosshair’s on the pivot chart. To do this, use the MarkerSettings and CrosshairSettings options within the ChartSettings property.
If you want to display a tooltip when hovering over an axis crosshair, use the crosshairTooltip option.
Please note, marker and crosshair options do not work with accumulation chart types, such as pie, doughnut, pyramid, or funnel.
In the following code sample, both marker and crosshair options are enabled and set up using the above properties:
@using Syncfusion.EJ2.PivotView

@Html.EJS().PivotView("PivotView").Height("300").DataSourceSettings(dataSourceSettings => dataSourceSettings.DataSource((IEnumerable<object>)ViewBag.DataSource).ExpandAll(false)
.FormatSettings(formatsettings =>
{
    formatsettings.Name("Amount").Format("C0").MaximumSignificantDigits(10).MinimumSignificantDigits(1).UseGrouping(true).Add();
}).Rows(rows =>
{
    rows.Name("Country").Add(); rows.Name("Products").Add();
}).Columns(columns =>
{
    columns.Name("Year").Caption("Year").Add(); columns.Name("Quarter").Add();
}).Values(values =>
{
    values.Name("Sold").Caption("Units Sold").Add(); values.Name("Amount").Caption("Sold Amount").Add();
})).DisplayOption(new PivotViewDisplayOption { View = View.Chart }).ChartSettings(chartSettings => chartSettings.ChartSeries(chartSeries => chartSeries.Type(ChartSeriesType.Line).Marker(marker => marker.Fill("#EEE").Height(10).Width(10).Shape("Pentagon").Visible(true))).Crosshair(crosshair => crosshair.Enable(true)).PrimaryXAxis(primaryXAxis => primaryXAxis.CrosshairTooltip(crosshairTooltip => crosshairTooltip.Enable(true).Fill("#ff0000"))).PrimaryYAxis(primaryYAxis => primaryYAxis.CrosshairTooltip(crosshairTooltip => crosshairTooltip.Enable(true).Fill("#0000FF")))).Render()
public ActionResult Index()
{
var data = GetPivotData();
ViewBag.DataSource = data;
return View();
}
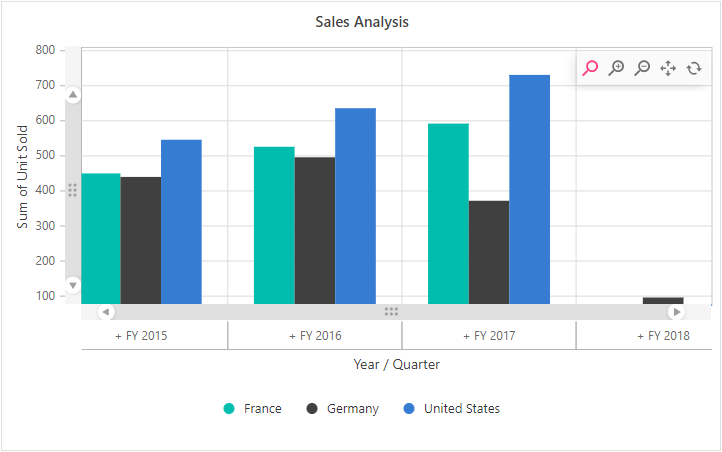
Zooming and panning
Users can customize the zooming and panning options in the pivot chart by using the ChartZoomSettings property within ChartSettings. The pivot chart supports four zooming options:
-
EnablePinchZooming– Zooms by pinching on touch devices. -
EnableSelectionZooming– Zooms into a selected region on the chart. -
EnableDeferredZooming– Applies zooming only after the selection is complete, which helps improve performance for large data. -
EnableMouseWheelZooming– Zooms using the mouse wheel.
The direction of zooming can be controlled using the Mode in ZoomSettings class. The available options are:
-
x: zooms horizontally, -
y: zooms vertically, -
x,y: zooms both horizontally and vertically.
When the pivot chart is zoomed, a toolbar appears at the top of the chart with tools for Zoom, Zoom In, Zoom Out, Pan, and Reset actions. This toolbar can be customized using the ToolbarItems in ZoomSettings class.
Zooming and panning are not available for accumulation chart types, such as pie, doughnut, pyramid, and funnel.
In the code sample below, all four zooming types are enabled, along with the toolbar options for the pivot chart.
@using Syncfusion.EJ2.PivotView

@Html.EJS().PivotView("PivotView").Height("300").DataSourceSettings(dataSourceSettings => dataSourceSettings.DataSource((IEnumerable<object>)ViewBag.DataSource).ExpandAll(false)
.FormatSettings(formatsettings =>
{
    formatsettings.Name("Amount").Format("C0").MaximumSignificantDigits(10).MinimumSignificantDigits(1).UseGrouping(true).Add();
}).Rows(rows =>
{
    rows.Name("Country").Add(); rows.Name("Products").Add();
}).Columns(columns =>
{
    columns.Name("Year").Caption("Year").Add(); columns.Name("Quarter").Add();
}).Values(values =>
{
    values.Name("Sold").Caption("Units Sold").Add(); values.Name("Amount").Caption("Sold Amount").Add();
})).DisplayOption(new PivotViewDisplayOption { View = View.Chart }).ChartSettings(chartSettings => chartSettings.ChartSeries(chartSeries => chartSeries.Type(ChartSeriesType.Column)).ZoomSettings(zoomSettings => zoomSettings.EnableDeferredZooming(true).EnableMouseWheelZooming(true).EnablePinchZooming(true).EnableSelectionZooming(true))).Render()
public ActionResult Index()
{
var data = GetPivotData();
ViewBag.DataSource = data;
return View();
}
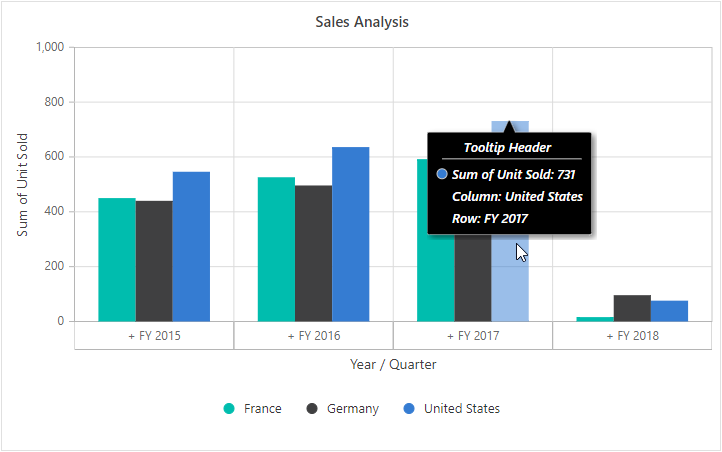
Tooltip
The tooltip in the Pivot Chart is enabled by default, showing detailed information about each data point when users move the pointer over the chart. Users can change how the tooltip looks and functions by using the TooltipSettings in ChartSettings class.
If users do not want to show the tooltip, they can disable it by setting the Enable in TooltipSettings class as false.
The code below shows how to change the default tooltip appearance and settings in the Pivot Chart.
@using Syncfusion.EJ2.PivotView

@Html.EJS().PivotView("PivotView").Height("300").DataSourceSettings(dataSourceSettings => dataSourceSettings.DataSource((IEnumerable<object>)ViewBag.DataSource).ExpandAll(false)
.FormatSettings(formatsettings =>
{
    formatsettings.Name("Amount").Format("C0").MaximumSignificantDigits(10).MinimumSignificantDigits(1).UseGrouping(true).Add();
}).Rows(rows =>
{
    rows.Name("Country").Add(); rows.Name("Products").Add();
}).Columns(columns =>
{
    columns.Name("Year").Caption("Year").Add(); columns.Name("Quarter").Add();
}).Values(values =>
{
    values.Name("Sold").Caption("Units Sold").Add(); values.Name("Amount").Caption("Sold Amount").Add();
})).DisplayOption(new PivotViewDisplayOption { View = View.Chart }).ChartSettings(chartSettings => chartSettings.ChartSeries(chartSeries => chartSeries.Type(ChartSeriesType.Column)).Tooltip(tooltip => tooltip.EnableMarker(true).Fill("#FFF").Opacity(1).TextStyle(textStyle => textStyle.Color("#000")).Border(border => border.Color("#000")))).Render()
public ActionResult Index()
{
var data = GetPivotData();
ViewBag.DataSource = data;
return View();
}
Export
You can export the pivot chart to various file formats by using the chartExport method. This method requires the type parameter, which specifies the file format. The supported export formats are:
- PNG
- JPEG
- SVG
Other optional parameters for the chartExport method include:
-
pdfExportProperties: Lets you set specific export options for the PDF format. -
isMultipleExport: Use this to export several charts or reports into one PDF document. -
pdfDoc: Allows you to include another external PDF document as part of the export. -
isBlob: If enabled, saves the PDF as blob data.
The example below shows how to export the pivot chart using an external button labeled “Export”:
@using Syncfusion.EJ2.PivotView

@Html.EJS().Button("chartexport").Content("Export").IsPrimary(true).Render()

@Html.EJS().PivotView("PivotView").Height("300").DataSourceSettings(dataSourceSettings => dataSourceSettings.DataSource((IEnumerable<object>)ViewBag.DataSource).ExpandAll(false)
.FormatSettings(formatsettings =>
{
    formatsettings.Name("Amount").Format("C0").MaximumSignificantDigits(10).MinimumSignificantDigits(1).UseGrouping(true).Add();
}).Rows(rows =>
{
    rows.Name("Country").Add(); rows.Name("Products").Add();
}).Columns(columns =>
{
    columns.Name("Year").Caption("Year").Add(); columns.Name("Quarter").Add();
}).Values(values =>
{
    values.Name("Sold").Caption("Units Sold").Add(); values.Name("Amount").Caption("Sold Amount").Add();
})).AllowPdfExport(true).DisplayOption(new PivotViewDisplayOption { View = View.Chart }).ChartSettings(chartSettings => chartSettings.ChartSeries(chartSeries => chartSeries.Type(ChartSeriesType.Column))).Render()

<script>
    var pivotObj;
    document.getElementById("chartexport").onclick = function () {
        pivotObj = document.getElementById("PivotView").ej2_instances[0];
        pivotObj.chartExport("PNG", "result");
    }
</script>
public ActionResult Index()
{
var data = GetPivotData();
ViewBag.DataSource = data;
return View();
}
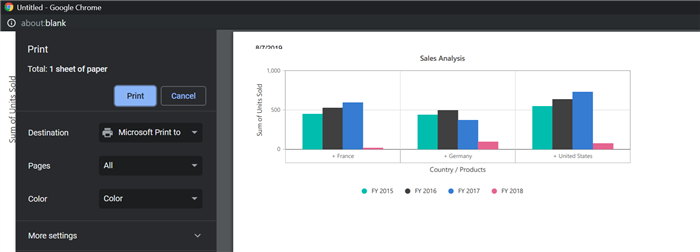
You can print the current view of the pivot chart directly from the browser by using the printChart method. This allows you to create a physical or digital copy of your pivot chart as displayed on the screen.
In the example below, clicking an external button labeled “Print Chart” calls the printChart method and prints the rendered pivot chart.
@using Syncfusion.EJ2.PivotView

@Html.EJS().Button("chartprint").Content("Print").IsPrimary(true).Render()

@Html.EJS().PivotView("PivotView").Height("300").DataSourceSettings(dataSourceSettings => dataSourceSettings.DataSource((IEnumerable<object>)ViewBag.DataSource).ExpandAll(false)
.FormatSettings(formatsettings =>
{
    formatsettings.Name("Amount").Format("C0").MaximumSignificantDigits(10).MinimumSignificantDigits(1).UseGrouping(true).Add();
}).Rows(rows =>
{
    rows.Name("Country").Add(); rows.Name("Products").Add();
}).Columns(columns =>
{
    columns.Name("Year").Caption("Year").Add(); columns.Name("Quarter").Add();
}).Values(values =>
{
    values.Name("Sold").Caption("Units Sold").Add(); values.Name("Amount").Caption("Sold Amount").Add();
})).DisplayOption(new PivotViewDisplayOption { View = View.Chart }).ChartSettings(chartSettings => chartSettings.ChartSeries(chartSeries => chartSeries.Type(ChartSeriesType.Column))).Render()

<script>
    var pivotObj;
    document.getElementById("chartprint").onclick = function () {
        pivotObj = document.getElementById("PivotView").ej2_instances[0];
        pivotObj.printChart();
    }
</script>
public ActionResult Index()
{
var data = GetPivotData();
ViewBag.DataSource = data;
return View();
}