How can I help you?
Grouping Bar
21 Dec 202224 minutes to read
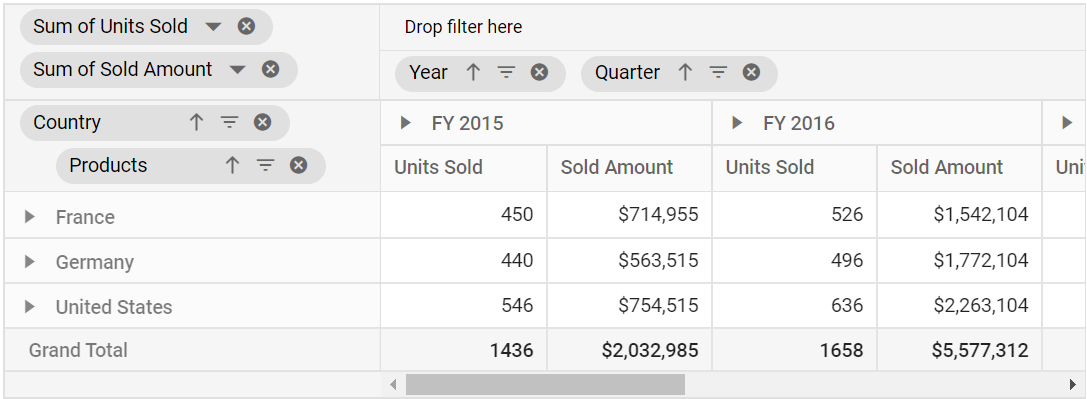
The Grouping Bar option in pivot table automatically populates fields from the bound data source and allows end users to drag fields between different axes such as columns, rows, values, and filters, and create pivot table at runtime. It can be enabled by setting the showGroupingBar property in ejs-pivotview tag to true.
Similar to Field List, Grouping Bar UI also comes with basic interactions like,
- Re-arranging fields through drag-and-drop operation between row, column, value and filter axes.
- Remove fields from the existing report using remove icon.
- Add fields to the report using fields panel option.
- Filtering members of specific fields using filter icon.
- Sorting members of specific fields using sort icon.
NOTE
The grouping bar provides some additional options to customize it’s UI using
e-groupingBarSettingsproperty.
@model List<PivotTableSample.Controllers.PivotData>

@Html.EJS().PivotView("PivotView").Width("100%").Height("300").DataSourceSettings(dataSource => dataSource.DataSource((IEnumerable<object>)Model).ExpandAll(false).EnableSorting(true).AllowLabelFilter(true).AllowValueFilter(true)
.FormatSettings(formatsettings =>
{
	formatsettings.Name("Amount").Format("C0").MaximumSignificantDigits(10).MinimumSignificantDigits(1).UseGrouping(true).Add();
}).Rows(rows =>
{
	rows.Name("Country").Add(); rows.Name("Products").Add();
}).Columns(columns =>
{
	columns.Name("Year").Caption("Year").Add(); columns.Name("Quarter").Add();
}).Values(values =>
{
	values.Name("Sold").Caption("Units Sold").Add(); values.Name("Amount").Caption("Sold Amount").Add();
})).ShowGroupingBar(true).Render()
public ActionResult Index()
{
var data = GetPivotData();
ViewBag.DataSource = data;
return View();
}
public List<PivotData> GetPivotData()
{
List<PivotData> pivotData = new List<PivotData>();
pivotData.Add(new PivotData { Sold = 31, Amount = 52824, Country = "France", Products = "Mountain Bikes", Year = "FY 2015", Quarter = "Q1" });
pivotData.Add(new PivotData { Sold = 51, Amount = 86904, Country = "France", Products = "Mountain Bikes", Year = "FY 2015", Quarter = "Q2" });
pivotData.Add(new PivotData { Sold = 90, Amount = 153360, Country = "France", Products = "Mountain Bikes", Year = "FY 2015", Quarter = "Q3" });
pivotData.Add(new PivotData { Sold = 25, Amount = 42600, Country = "France", Products = "Mountain Bikes", Year = "FY 2015", Quarter = "Q4" });
pivotData.Add(new PivotData { Sold = 27, Amount = 46008, Country = "France", Products = "Mountain Bikes", Year = "FY 2016", Quarter = "Q1" });
pivotData.Add(new PivotData { Sold = 49, Amount = 83496, Country = "France", Products = "Mountain Bikes", Year = "FY 2016", Quarter = "Q2" });
pivotData.Add(new PivotData { Sold = 95, Amount = 161880, Country = "France", Products = "Mountain Bikes", Year = "FY 2016", Quarter = "Q3" });
pivotData.Add(new PivotData { Sold = 67, Amount = 114168, Country = "France", Products = "Mountain Bikes", Year = "FY 2016", Quarter = "Q4" });
pivotData.Add(new PivotData { Sold = 75, Amount = 127800, Country = "France", Products = "Mountain Bikes", Year = "FY 2017", Quarter = "Q1" });
pivotData.Add(new PivotData { Sold = 67, Amount = 114168, Country = "France", Products = "Mountain Bikes", Year = "FY 2017", Quarter = "Q2" });
pivotData.Add(new PivotData { Sold = 69, Amount = 117576, Country = "France", Products = "Mountain Bikes", Year = "FY 2017", Quarter = "Q3" });
pivotData.Add(new PivotData { Sold = 90, Amount = 153360, Country = "France", Products = "Mountain Bikes", Year = "FY 2017", Quarter = "Q4" });
pivotData.Add(new PivotData { Sold = 16, Amount = 27264, Country = "France", Products = "Mountain Bikes", Year = "FY 2018", Quarter = "Q1" });
pivotData.Add(new PivotData { Sold = 83, Amount = 124422, Country = "France", Products = "Road Bikes", Year = "FY 2015", Quarter = "Q1" });
pivotData.Add(new PivotData { Sold = 57, Amount = 85448, Country = "France", Products = "Road Bikes", Year = "FY 2015", Quarter = "Q2" });
pivotData.Add(new PivotData { Sold = 20, Amount = 29985, Country = "France", Products = "Road Bikes", Year = "FY 2015", Quarter = "Q3" });
pivotData.Add(new PivotData { Sold = 67, Amount = 70008, Country = "France", Products = "Road Bikes", Year = "FY 2016", Quarter = "Q1" });
pivotData.Add(new PivotData { Sold = 89, Amount = 60496, Country = "France", Products = "Road Bikes", Year = "FY 2016", Quarter = "Q2" });
pivotData.Add(new PivotData { Sold = 75, Amount = 801880, Country = "France", Products = "Road Bikes", Year = "FY 2016", Quarter = "Q3" });
pivotData.Add(new PivotData { Sold = 57, Amount = 204168, Country = "France", Products = "Road Bikes", Year = "FY 2016", Quarter = "Q4" });
pivotData.Add(new PivotData { Sold = 75, Amount = 737800, Country = "France", Products = "Road Bikes", Year = "FY 2017", Quarter = "Q1" });
pivotData.Add(new PivotData { Sold = 87, Amount = 884168, Country = "France", Products = "Road Bikes", Year = "FY 2017", Quarter = "Q2" });
pivotData.Add(new PivotData { Sold = 39, Amount = 729576, Country = "France", Products = "Road Bikes", Year = "FY 2017", Quarter = "Q3" });
pivotData.Add(new PivotData { Sold = 90, Amount = 38860, Country = "France", Products = "Road Bikes", Year = "FY 2017", Quarter = "Q4" });
pivotData.Add(new PivotData { Sold = 93, Amount = 139412, Country = "France", Products = "Road Bikes", Year = "FY 2015", Quarter = "Q4" });
pivotData.Add(new PivotData { Sold = 51, Amount = 92824, Country = "Germany", Products = "Mountain Bikes", Year = "FY 2015", Quarter = "Q1" });
pivotData.Add(new PivotData { Sold = 61, Amount = 76904, Country = "Germany", Products = "Mountain Bikes", Year = "FY 2015", Quarter = "Q2" });
pivotData.Add(new PivotData { Sold = 70, Amount = 43360, Country = "Germany", Products = "Mountain Bikes", Year = "FY 2015", Quarter = "Q3" });
pivotData.Add(new PivotData { Sold = 85, Amount = 62600, Country = "Germany", Products = "Mountain Bikes", Year = "FY 2015", Quarter = "Q4" });
pivotData.Add(new PivotData { Sold = 97, Amount = 86008, Country = "Germany", Products = "Mountain Bikes", Year = "FY 2016", Quarter = "Q1" });
pivotData.Add(new PivotData { Sold = 69, Amount = 93496, Country = "Germany", Products = "Mountain Bikes", Year = "FY 2016", Quarter = "Q2" });
pivotData.Add(new PivotData { Sold = 45, Amount = 301880, Country = "Germany", Products = "Mountain Bikes", Year = "FY 2016", Quarter = "Q3" });
pivotData.Add(new PivotData { Sold = 77, Amount = 404168, Country = "Germany", Products = "Mountain Bikes", Year = "FY 2016", Quarter = "Q4" });
pivotData.Add(new PivotData { Sold = 15, Amount = 137800, Country = "Germany", Products = "Mountain Bikes", Year = "FY 2017", Quarter = "Q1" });
pivotData.Add(new PivotData { Sold = 37, Amount = 184168, Country = "Germany", Products = "Mountain Bikes", Year = "FY 2017", Quarter = "Q2" });
pivotData.Add(new PivotData { Sold = 49, Amount = 89576, Country = "Germany", Products = "Mountain Bikes", Year = "FY 2017", Quarter = "Q3" });
pivotData.Add(new PivotData { Sold = 40, Amount = 33360, Country = "Germany", Products = "Mountain Bikes", Year = "FY 2017", Quarter = "Q4" });
pivotData.Add(new PivotData { Sold = 96, Amount = 77264, Country = "Germany", Products = "Mountain Bikes", Year = "FY 2018", Quarter = "Q1" });
pivotData.Add(new PivotData { Sold = 23, Amount = 24422, Country = "Germany", Products = "Road Bikes", Year = "FY 2015", Quarter = "Q1" });
pivotData.Add(new PivotData { Sold = 67, Amount = 75448, Country = "Germany", Products = "Road Bikes", Year = "FY 2015", Quarter = "Q2" });
pivotData.Add(new PivotData { Sold = 70, Amount = 52345, Country = "Germany", Products = "Road Bikes", Year = "FY 2015", Quarter = "Q3" });
pivotData.Add(new PivotData { Sold = 13, Amount = 135612, Country = "Germany", Products = "Road Bikes", Year = "FY 2015", Quarter = "Q4" });
pivotData.Add(new PivotData { Sold = 57, Amount = 90008, Country = "Germany", Products = "Road Bikes", Year = "FY 2016", Quarter = "Q1" });
pivotData.Add(new PivotData { Sold = 29, Amount = 90496, Country = "Germany", Products = "Road Bikes", Year = "FY 2016", Quarter = "Q2" });
pivotData.Add(new PivotData { Sold = 45, Amount = 301880, Country = "Germany", Products = "Road Bikes", Year = "FY 2016", Quarter = "Q3" });
pivotData.Add(new PivotData { Sold = 77, Amount = 404168, Country = "Germany", Products = "Road Bikes", Year = "FY 2016", Quarter = "Q4" });
pivotData.Add(new PivotData { Sold = 15, Amount = 137800, Country = "Germany", Products = "Road Bikes", Year = "FY 2017", Quarter = "Q1" });
pivotData.Add(new PivotData { Sold = 37, Amount = 184168, Country = "Germany", Products = "Road Bikes", Year = "FY 2017", Quarter = "Q2" });
pivotData.Add(new PivotData { Sold = 99, Amount = 829576, Country = "Germany", Products = "Road Bikes", Year = "FY 2017", Quarter = "Q3" });
pivotData.Add(new PivotData { Sold = 80, Amount = 38360, Country = "Germany", Products = "Road Bikes", Year = "FY 2017", Quarter = "Q4" });
pivotData.Add(new PivotData { Sold = 91, Amount = 67824, Country = "United States", Products = "Mountain Bikes", Year = "FY 2015", Quarter = "Q1" });
pivotData.Add(new PivotData { Sold = 81, Amount = 99904, Country = "United States", Products = "Mountain Bikes", Year = "FY 2015", Quarter = "Q2" });
pivotData.Add(new PivotData { Sold = 70, Amount = 49360, Country = "United States", Products = "Mountain Bikes", Year = "FY 2015", Quarter = "Q3" });
pivotData.Add(new PivotData { Sold = 65, Amount = 69600, Country = "United States", Products = "Mountain Bikes", Year = "FY 2015", Quarter = "Q4" });
pivotData.Add(new PivotData { Sold = 57, Amount = 90008, Country = "United States", Products = "Mountain Bikes", Year = "FY 2016", Quarter = "Q1" });
pivotData.Add(new PivotData { Sold = 29, Amount = 90496, Country = "United States", Products = "Mountain Bikes", Year = "FY 2016", Quarter = "Q2" });
pivotData.Add(new PivotData { Sold = 85, Amount = 391880, Country = "United States", Products = "Mountain Bikes", Year = "FY 2016", Quarter = "Q3" });
pivotData.Add(new PivotData { Sold = 97, Amount = 904168, Country = "United States", Products = "Mountain Bikes", Year = "FY 2016", Quarter = "Q4" });
pivotData.Add(new PivotData { Sold = 85, Amount = 237800, Country = "United States", Products = "Mountain Bikes", Year = "FY 2017", Quarter = "Q1" });
pivotData.Add(new PivotData { Sold = 77, Amount = 384168, Country = "United States", Products = "Mountain Bikes", Year = "FY 2017", Quarter = "Q2" });
pivotData.Add(new PivotData { Sold = 99, Amount = 829576, Country = "United States", Products = "Mountain Bikes", Year = "FY 2017", Quarter = "Q3" });
pivotData.Add(new PivotData { Sold = 80, Amount = 38360, Country = "United States", Products = "Mountain Bikes", Year = "FY 2017", Quarter = "Q4" });
pivotData.Add(new PivotData { Sold = 76, Amount = 97264, Country = "United States", Products = "Mountain Bikes", Year = "FY 2018", Quarter = "Q1" });
pivotData.Add(new PivotData { Sold = 53, Amount = 94422, Country = "United States", Products = "Road Bikes", Year = "FY 2015", Quarter = "Q1" });
pivotData.Add(new PivotData { Sold = 90, Amount = 45448, Country = "United States", Products = "Road Bikes", Year = "FY 2015", Quarter = "Q2" });
pivotData.Add(new PivotData { Sold = 29, Amount = 92345, Country = "United States", Products = "Road Bikes", Year = "FY 2015", Quarter = "Q3" });
pivotData.Add(new PivotData { Sold = 67, Amount = 235612, Country = "United States", Products = "Road Bikes", Year = "FY 2015", Quarter = "Q4" });
pivotData.Add(new PivotData { Sold = 97, Amount = 90008, Country = "United States", Products = "Road Bikes", Year = "FY 2016", Quarter = "Q1" });
pivotData.Add(new PivotData { Sold = 79, Amount = 90496, Country = "United States", Products = "Road Bikes", Year = "FY 2016", Quarter = "Q2" });
pivotData.Add(new PivotData { Sold = 95, Amount = 501880, Country = "United States", Products = "Road Bikes", Year = "FY 2016", Quarter = "Q3" });
pivotData.Add(new PivotData { Sold = 97, Amount = 104168, Country = "United States", Products = "Road Bikes", Year = "FY 2016", Quarter = "Q4" });
pivotData.Add(new PivotData { Sold = 95, Amount = 837800, Country = "United States", Products = "Road Bikes", Year = "FY 2017", Quarter = "Q1" });
pivotData.Add(new PivotData { Sold = 87, Amount = 684168, Country = "United States", Products = "Road Bikes", Year = "FY 2017", Quarter = "Q2" });
pivotData.Add(new PivotData { Sold = 109, Amount = 29576, Country = "United States", Products = "Road Bikes", Year = "FY 2017", Quarter = "Q3" });
return pivotData;
}
public class PivotData
{
public int Sold { get; set; }
public double Amount { get; set; }
public string Country { get; set; }
public string Products { get; set; }
public string Year { get; set; }
public string Quarter { get; set; }
}
Show or hide fields panel
The fields panel, which is positioned above the grouping bar, displays the fields that are available in the data source but are not bound in the report. The fields can be dragged and dropped into the appropriate axis. In addition, any field removed from any axes will be automatically added to the fields panel. The fields panel can be displayed by setting the showFieldsPanel property in the e-groupingBarSettings to true.
@using Syncfusion.EJ2.PivotView

@Html.EJS().PivotView("PivotView").Width("100%").Height("300").GroupingBarSettings( new PivotViewGroupingBarSettings {
ShowFieldsPanel =false }).DataSourceSettings(dataSource => dataSource.DataSource((IEnumerable<object>)ViewBag.DataSource).ExpandAll(false).EnableSorting(true)
.FormatSettings(formatsettings =>
{
formatsettings.Name("Amount").Format("C0").MaximumSignificantDigits(10).MinimumSignificantDigits(1).UseGrouping(true).Add();
}).Rows(rows =>
{
rows.Name("Country").Add();
}).Columns(columns =>
{
columns.Name("Year").Add();
}).Values(values =>
{
values.Name("Sold").Caption("Units Sold").Add();
})).ShowGroupingBar(true).Render()
public ActionResult Index()
{
var data = GetPivotData();
ViewBag.DataSource = data;
return View();
}
Show or hide all filter icon
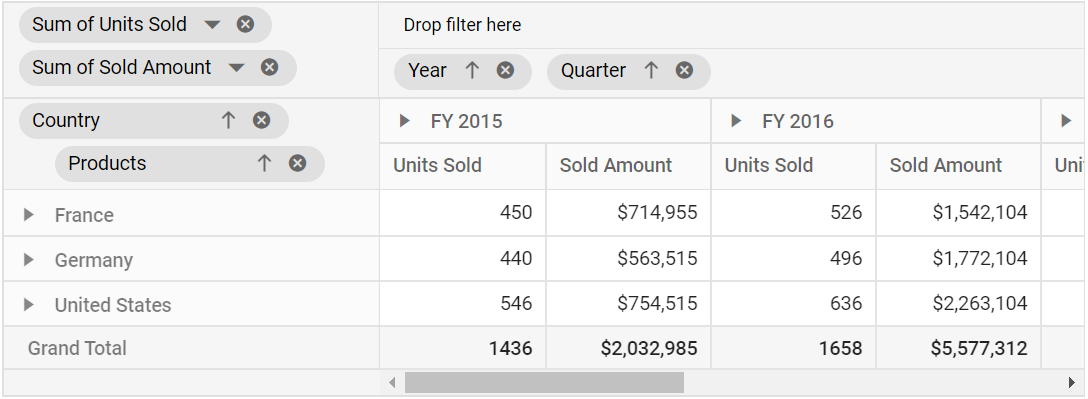
The Grouping Bar has an option to filter members of particular fields at runtime in pivot table. In-order to filter members in a field, click the filter icon and check/uncheck members that needs to be displayed. By default, filter icon besides each field is enabled in the grouping bar. To disable the filter icon, set the property showFilterIcon in e-groupingBarSettings tag to false.
NOTE
By default, the filter icon is enabled in the grouping bar.
@using Syncfusion.EJ2.PivotView

@Html.EJS().PivotView("PivotView").Width("100%").Height("300").GroupingBarSettings( new PivotViewGroupingBarSettings {
ShowFilterIcon =false }).DataSourceSettings(dataSource => dataSource.DataSource((IEnumerable<object>)ViewBag.DataSource).ExpandAll(false).EnableSorting(true)
.FormatSettings(formatsettings =>
{
formatsettings.Name("Amount").Format("C0").MaximumSignificantDigits(10).MinimumSignificantDigits(1).UseGrouping(true).Add();
}).Rows(rows =>
{
rows.Name("Country").Add(); rows.Name("Products").Add();
}).Columns(columns =>
{
columns.Name("Year").Add(); columns.Name("Quarter").Add();
}).Values(values =>
{
values.Name("Sold").Caption("Units Sold").Add(); values.Name("Amount").Caption("Sold Amount").Add();
})).ShowGroupingBar(true).Render()
public ActionResult Index()
{
var data = GetPivotData();
ViewBag.DataSource = data;
return View();
}
Show or hide specific filter icon
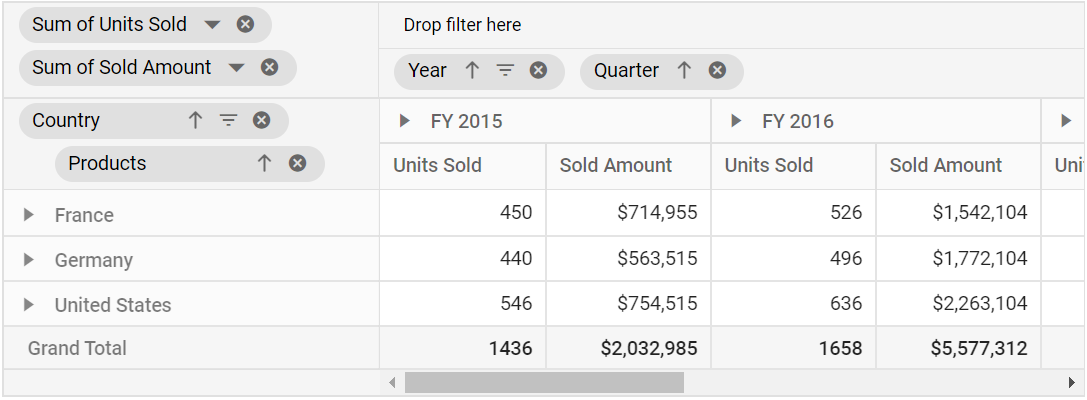
To disable the filter icon for a specific field, set the property showFilterIcon to false to the corresponding field in e-datasourcesettings.
In the below sample, the filter icon of “Quarter” and “Products” fields have been hidden.
@using Syncfusion.EJ2.PivotView

@Html.EJS().PivotView("PivotView").Width("100%").Height("300").DataSourceSettings(dataSource => dataSource.DataSource((IEnumerable<object>)ViewBag.DataSource).ExpandAll(false).EnableSorting(true)
.FormatSettings(formatsettings =>
{
formatsettings.Name("Amount").Format("C0").MaximumSignificantDigits(10).MinimumSignificantDigits(1).UseGrouping(true).Add();
}).Rows(rows =>
{
rows.Name("Country").Add(); rows.Name("Products").ShowFilterIcon(false).Add();
}).Columns(columns =>
{
columns.Name("Year").Add(); columns.Name("Quarter").ShowFilterIcon(false).Add();
}).Values(values =>
{
values.Name("Sold").Caption("Units Sold").Add(); values.Name("Amount").Caption("Sold Amount").Add();
})).ShowGroupingBar(true).Render()
public ActionResult Index()
{
var data = GetPivotData();
ViewBag.DataSource = data;
return View();
}
Show or hide all sort icon
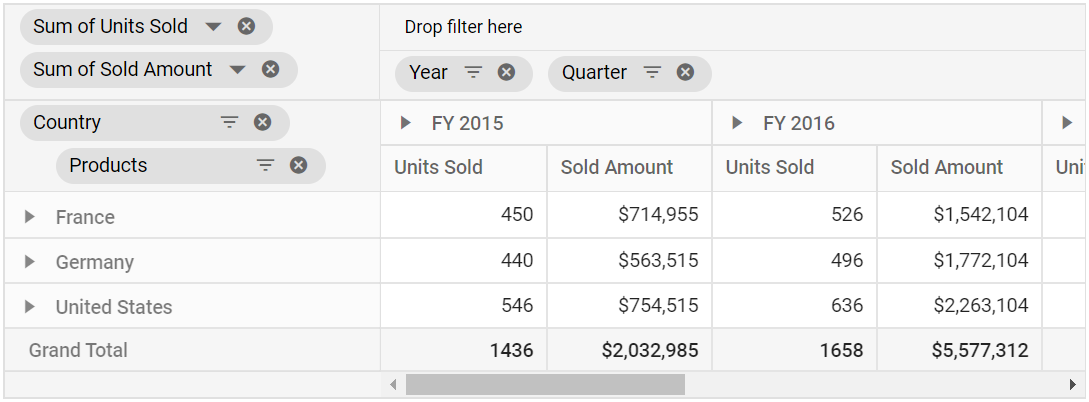
The Grouping Bar has an option to order members of a particular fields either in ascending or descending at runtime. In order to sort a field, click the sort icon and to reverse its sort direction, once again click the same sort icon. By default, the sort icon besides each field is enabled in the grouping bar and members will be arranged in ascending order. To disable the sort option, set the property showSortIcon in e-groupingBarSettings tag to false.
NOTE
By default, the sort icon is enabled in the grouping bar.
@using Syncfusion.EJ2.PivotView

@Html.EJS().PivotView("PivotView").Width("100%").Height("300").GroupingBarSettings( new PivotViewGroupingBarSettings {
ShowSortIcon =false }).DataSourceSettings(dataSource => dataSource.DataSource((IEnumerable<object>)ViewBag.DataSource).ExpandAll(false).EnableSorting(true)
.FormatSettings(formatsettings =>
{
formatsettings.Name("Amount").Format("C0").MaximumSignificantDigits(10).MinimumSignificantDigits(1).UseGrouping(true).Add();
}).Rows(rows =>
{
rows.Name("Country").Add(); rows.Name("Products").Add();
}).Columns(columns =>
{
columns.Name("Year").Add(); columns.Name("Quarter").Add();
}).Values(values =>
{
values.Name("Sold").Caption("Units Sold").Add(); values.Name("Amount").Caption("Sold Amount").Add();
})).ShowGroupingBar(true).Render()
public ActionResult Index()
{
var data = GetPivotData();
ViewBag.DataSource = data;
return View();
}
Show or hide specific sort icon
To disable the sort icon for a specific button, set the property showSortIcon to false to the corresponding field in e-datasourcesettings.
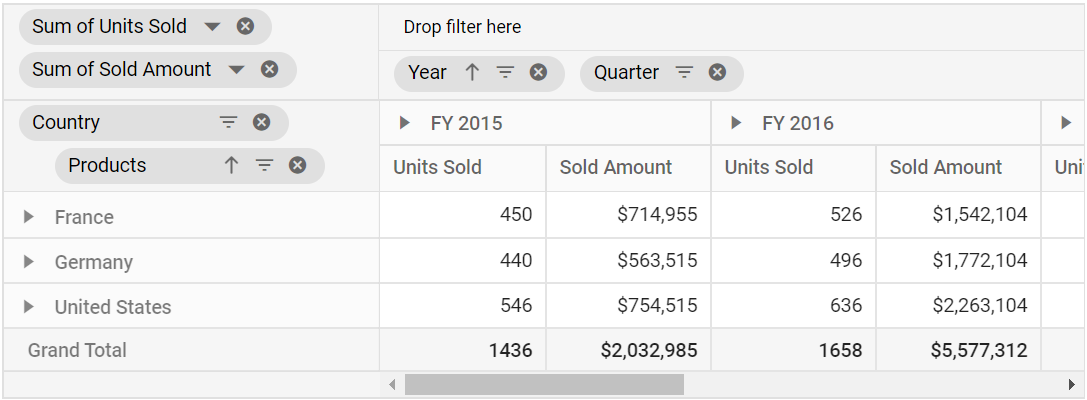
In the below sample, the sort icon of “Quarter” and “Country” fields have been hidden.
@using Syncfusion.EJ2.PivotView

@Html.EJS().PivotView("PivotView").Width("100%").Height("300").DataSourceSettings(dataSource => dataSource.DataSource((IEnumerable<object>)ViewBag.DataSource).ExpandAll(false).EnableSorting(true)
.FormatSettings(formatsettings =>
{
formatsettings.Name("Amount").Format("C0").MaximumSignificantDigits(10).MinimumSignificantDigits(1).UseGrouping(true).Add();
}).Rows(rows =>
{
rows.Name("Country").ShowSortIcon(false).Add(); rows.Name("Products").Add();
}).Columns(columns =>
{
columns.Name("Year").Add(); columns.Name("Quarter").ShowSortIcon(false).Add();
}).Values(values =>
{
values.Name("Sold").Caption("Units Sold").Add(); values.Name("Amount").Caption("Sold Amount").Add();
})).ShowGroupingBar(true).Render()
public ActionResult Index()
{
var data = GetPivotData();
ViewBag.DataSource = data;
return View();
}
Show or hide all remove icon
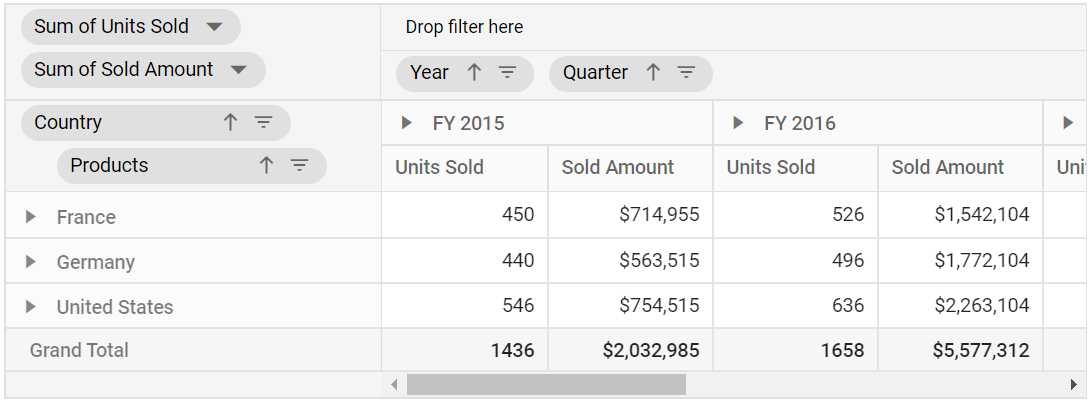
The Grouping Bar has an option to remove any field at runtime. To remove a field, just click the remove icon. By default, the remove icon besides each field is enabled in the grouping bar. To disable the remove icon, set the property showRemoveIcon in e-groupingBarSettings tag to false.
NOTE
By default, the remove icon is enabled in the grouping bar.
@using Syncfusion.EJ2.PivotView

@Html.EJS().PivotView("PivotView").Width("100%").Height("300").GroupingBarSettings( new PivotViewGroupingBarSettings {
ShowRemoveIcon =false }).DataSourceSettings(dataSource => dataSource.DataSource((IEnumerable<object>)ViewBag.DataSource).ExpandAll(false).EnableSorting(true)
.FormatSettings(formatsettings =>
{
formatsettings.Name("Amount").Format("C0").MaximumSignificantDigits(10).MinimumSignificantDigits(1).UseGrouping(true).Add();
}).Rows(rows =>
{
rows.Name("Country").Add(); rows.Name("Products").Add();
}).Columns(columns =>
{
columns.Name("Year").Add(); columns.Name("Quarter").Add();
}).Values(values =>
{
values.Name("Sold").Caption("Units Sold").Add(); values.Name("Amount").Caption("Sold Amount").Add();
})).ShowGroupingBar(true).Render()
public ActionResult Index()
{
var data = GetPivotData();
ViewBag.DataSource = data;
return View();
}
Show or hide specific remove icon
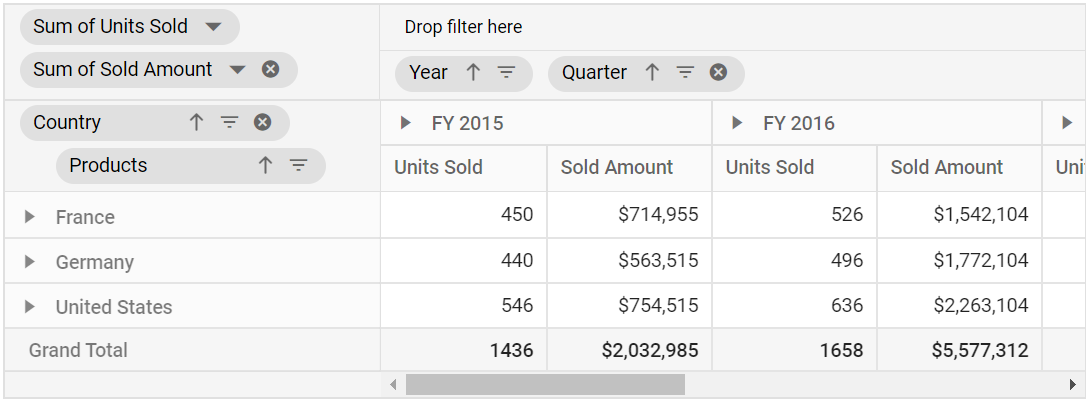
To disable the remove icon for a specific button, set the property showRemoveIcon to false to the corresponding field in e-datasourcesettings.
In the below sample, the remove icon of fields “Year”, “Sold” and “Products” have been hidden.
@using Syncfusion.EJ2.PivotView

@Html.EJS().PivotView("PivotView").Width("100%").Height("300").DataSourceSettings(dataSource => dataSource.DataSource((IEnumerable<object>)ViewBag.DataSource).ExpandAll(false).EnableSorting(true)
.FormatSettings(formatsettings =>
{
formatsettings.Name("Amount").Format("C0").MaximumSignificantDigits(10).MinimumSignificantDigits(1).UseGrouping(true).Add();
}).Rows(rows =>
{
rows.Name("Country").Add(); rows.Name("Products").ShowRemoveIcon(false).Add();
}).Columns(columns =>
{
columns.Name("Year").ShowRemoveIcon(false).Add(); columns.Name("Quarter").Add();
}).Values(values =>
{
values.Name("Sold").Caption("Units Sold").ShowRemoveIcon(false).Add(); values.Name("Amount").Caption("Sold Amount").Add();
})).ShowGroupingBar(true).Render()
public ActionResult Index()
{
var data = GetPivotData();
ViewBag.DataSource = data;
return View();
}
Disable all fields from dragging
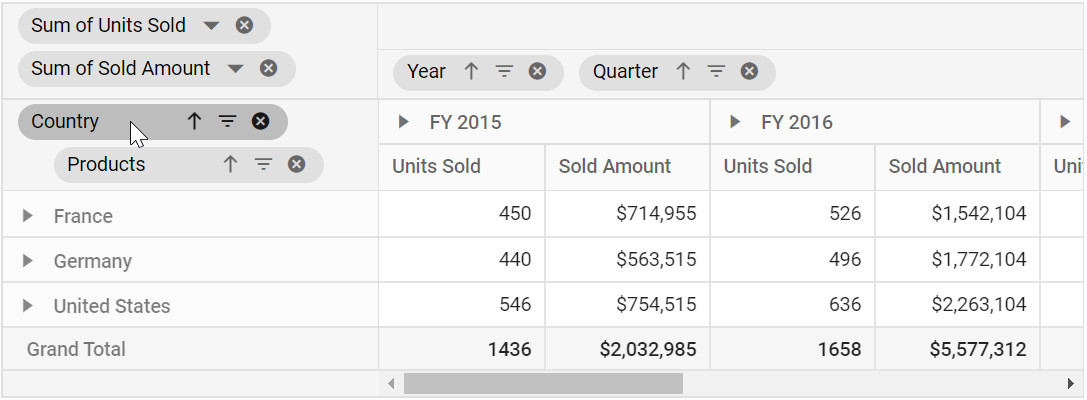
The Grouping Bar has an option to drag-and-drop fields between row, column, value and filter axes in-order to change report at runtime. By default, all fields are available for drag-and-drop operation in the grouping bar. To disable these fields, set the property allowDragAndDrop in e-groupingBarSettings tag to false. This will prevent end user from changing the current report.
@using Syncfusion.EJ2.PivotView

@Html.EJS().PivotView("PivotView").Width("100%").Height("300").GroupingBarSettings( new PivotViewGroupingBarSettings {
AllowDragAndDrop =false }).DataSourceSettings(dataSource => dataSource.DataSource((IEnumerable<object>)ViewBag.DataSource).ExpandAll(false).EnableSorting(true)
.FormatSettings(formatsettings =>
{
formatsettings.Name("Amount").Format("C0").MaximumSignificantDigits(10).MinimumSignificantDigits(1).UseGrouping(true).Add();
}).Rows(rows =>
{
rows.Name("Country").Add(); rows.Name("Products").Add();
}).Columns(columns =>
{
columns.Name("Year").Add(); columns.Name("Quarter").Add();
}).Values(values =>
{
values.Name("Sold").Caption("Units Sold").Add(); values.Name("Amount").Caption("Sold Amount").Add();
})).ShowGroupingBar(true).Render()
public ActionResult Index()
{
var data = GetPivotData();
ViewBag.DataSource = data;
return View();
}
Disable specific field from dragging
To disable dragging for a specific button, set the property allowDragAndDrop to false to the corresponding field in e-datasourcesettings.
In the below sample, the drag and drop of the fields “Year” and “Products” have been restricted.
@using Syncfusion.EJ2.PivotView

@Html.EJS().PivotView("PivotView").Width("100%").Height("300").DataSourceSettings(dataSource => dataSource.DataSource((IEnumerable<object>)ViewBag.DataSource).ExpandAll(false).EnableSorting(true)
.FormatSettings(formatsettings =>
{
formatsettings.Name("Amount").Format("C0").MaximumSignificantDigits(10).MinimumSignificantDigits(1).UseGrouping(true).Add();
}).Rows(rows =>
{
rows.Name("Country").Add(); rows.Name("Products").AllowDragAndDrop(false).Add();
}).Columns(columns =>
{
columns.Name("Year").AllowDragAndDrop(false).Add(); columns.Name("Quarter").Add();
}).Values(values =>
{
values.Name("Sold").Caption("Units Sold").Add(); values.Name("Amount").Caption("Sold Amount").Add();
})).ShowGroupingBar(true).Render()
public ActionResult Index()
{
var data = GetPivotData();
ViewBag.DataSource = data;
return View();
}Remove specific field(s) from displaying
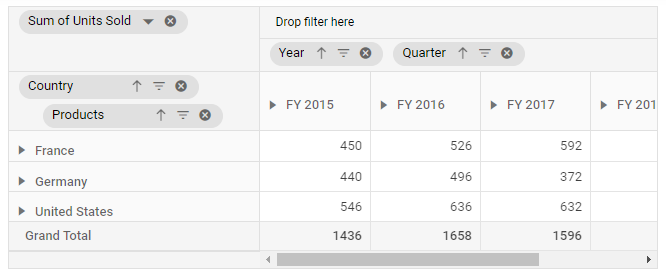
When a report is bound to the pivot table, fields will be automatically populated within the Grouping Bar. In this case, you can also prevent specific fields from being displayed. To do so, set the appropriate field name(s) in the excludeFields property of dataSourceSettings.
NOTE
The
excludeFieldsproperty setting will be reflected in the field list UI as well, and for more information, see this link.
@Html.EJS().PivotView("PivotView").Width("100%").Height("300").DataSourceSettings(dataSource => dataSource.DataSource((IEnumerable<object>)ViewBag.DataSource).ExpandAll(false).EnableSorting(true).AllowLabelFilter(true).AllowValueFilter(true)
    .FormatSettings(formatsettings =>
    {
        formatsettings.Name("Amount").Format("C0").MaximumSignificantDigits(10).MinimumSignificantDigits(1).UseGrouping(true).Add();
    }).Rows(rows =>
    {
        rows.Name("Country").Add(); rows.Name("Products").Add();
    }).Columns(columns =>
    {
        columns.Name("Year").Caption("Year").Add(); columns.Name("Quarter").Add();
    }).Values(values =>
    {
        values.Name("Sold").Caption("Units Sold").Add(); values.Name("Amount").Caption("Sold Amount").Add();
    }).ExcludeFields(ViewBag.Excludefields)).ShowGroupingBar(true).Render()
public ActionResult Index()
{
var data = GetPivotData();
ViewBag.DataSource = data;
ViewBag.Excludefields = new string[] { "Amount" };
return View();
}
Changing aggregation type of value fields at runtime
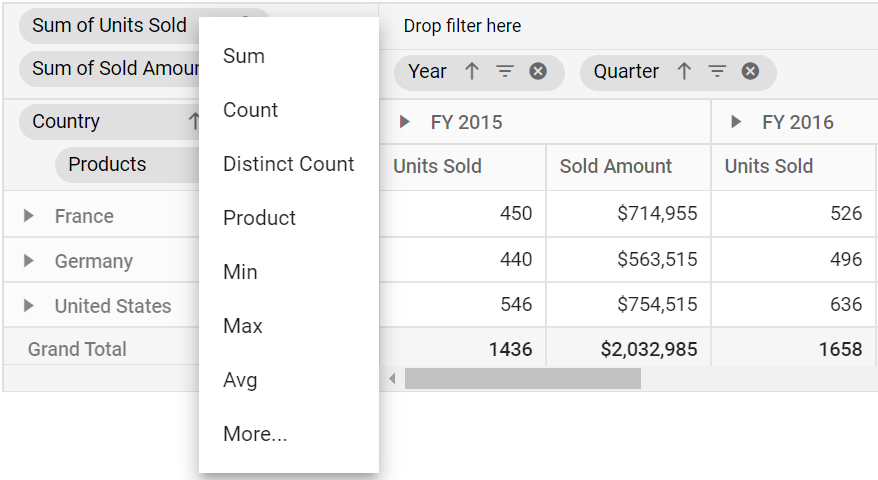
End user can perform calculations over a group of values using the aggregation option. The value fields bound to the field list, appears with a dropdown icon, helps to select an appropriate aggregation type at runtime. On selection, the values in the Pivot Table will be changed dynamically. By default, the icon to set aggregation type is enabled in the grouping bar. To disable this icon, set the property showValueTypeIcon in e-groupingBarSettings tag to false. To know more about aggregation, refer here.
@using Syncfusion.EJ2.PivotView

@Html.EJS().PivotView("PivotView").Width("100%").Height("300").GroupingBarSettings( new PivotViewGroupingBarSettings {
AllowDragAndDrop =false }).DataSourceSettings(dataSource => dataSource.DataSource((IEnumerable<object>)ViewBag.DataSource).ExpandAll(false).EnableSorting(true)
.FormatSettings(formatsettings =>
{
formatsettings.Name("Amount").Format("C0").MaximumSignificantDigits(10).MinimumSignificantDigits(1).UseGrouping(true).Add();
}).Rows(rows =>
{
rows.Name("Country").Add(); rows.Name("Products").Add();
}).Columns(columns =>
{
columns.Name("Year").Add(); columns.Name("Quarter").Add();
}).Values(values =>
{
values.Name("Sold").Caption("Units Sold").Add(); values.Name("Amount").Caption("Sold Amount").Add();
})).ShowGroupingBar(true).Render()
public ActionResult Index()
{
var data = GetPivotData();
ViewBag.DataSource = data;
return View();
}![]()
Show or hide specific dropdown icon
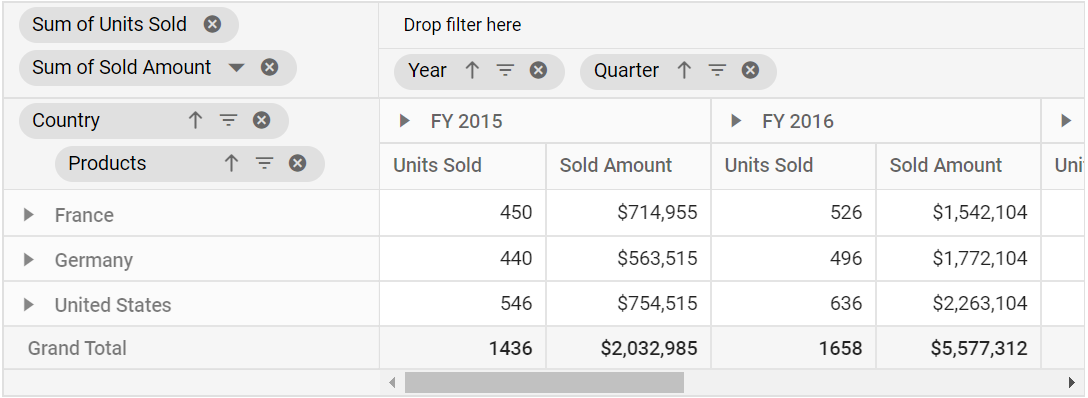
To disable the dropdown icon for a specific button, set the property showValueTypeIcon to false to the corresponding field in e-datasourcesettings.
In the below sample, the dropdown icon of field “Sold” is hidden.
@using Syncfusion.EJ2.PivotView

@Html.EJS().PivotView("PivotView").Width("100%").Height("300").DataSourceSettings(dataSource => dataSource.DataSource((IEnumerable<object>)ViewBag.DataSource).ExpandAll(false).EnableSorting(true)
.FormatSettings(formatsettings =>
{
formatsettings.Name("Amount").Format("C0").MaximumSignificantDigits(10).MinimumSignificantDigits(1).UseGrouping(true).Add();
}).Rows(rows =>
{
rows.Name("Country").Add(); rows.Name("Products").Add();
}).Columns(columns =>
{
columns.Name("Year").Add(); columns.Name("Quarter").Add();
}).Values(values =>
{
values.Name("Sold").Caption("Units Sold").ShowValueTypeIcon(false).Add(); values.Name("Amount").Caption("Sold Amount").Add();
})).ShowGroupingBar(true).Render()
public ActionResult Index()
{
var data = GetPivotData();
ViewBag.DataSource = data;
return View();
}
NOTE
The property
showFilterIcon,showSortIcon,showValueTypeIconandallowDragAndDropin fields ofe-datasourcesettingsare applicable for both grouping bar and field list.
Show values button
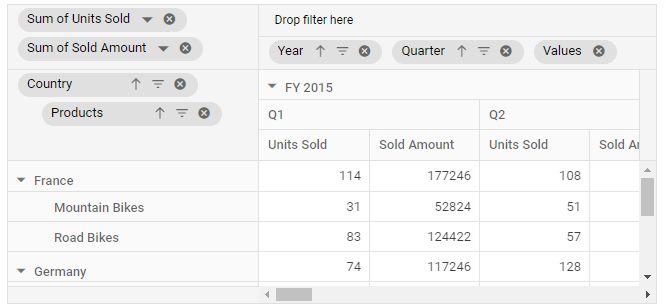
During runtime, the Values button in the grouping bar can be moved to a different position (i.e., different index) among other fields in the column or row axis. To enable the Values button, set the showValuesButton property to true.
NOTE
This support is only available for relational data sources.
@Html.EJS().PivotView("PivotView").Width("100%").ShowGroupingBar(true).ShowValuesButton(true).Height("350").DataSourceSettings(dataSource => dataSource.DataSource((IEnumerable<object>)ViewBag.DataSource).ExpandAll(true)
    .Rows(rows =>
    {
        rows.Name("Country").Add();
        rows.Name("Products").Add();
    })
    .Columns(columns =>
    {
        columns.Name("Year").Add();
        columns.Name("Quarter").Add();
    })
    .Values(values =>
    {
        values.Name("Sold").Caption("Units Sold").Add();
        values.Name("Amount").Add();
    })
   ).Render()
public ActionResult Index()
{
var data = GetPivotData();
ViewBag.DataSource = data;
return View();
}
Event
OnFieldDropped
The event onFieldDropped fires on whenever a field is dropped over an axis.
It has following parameters - droppedAxis, droppedField and dataSourceSettings. In this sample we have modified the droppedField caption based on the droppedAxis.
@using Syncfusion.EJ2.PivotView

@Html.EJS().PivotView("PivotView").Width("100%").Height("300").DataSourceSettings(dataSource => dataSource.DataSource((IEnumerable<object>)ViewBag.DataSource).ExpandAll(false).EnableSorting(true)
.FormatSettings(formatsettings =>
{
formatsettings.Name("Amount").Format("C0").MaximumSignificantDigits(10).MinimumSignificantDigits(1).UseGrouping(true).Add();
}).Rows(rows =>
{
rows.Name("Country").Add(); rows.Name("Products").Add();
}).Columns(columns =>
{
columns.Name("Year").Add(); columns.Name("Quarter").Add();
}).Values(values =>
{
values.Name("Sold").Caption("Units Sold").Add(); values.Name("Amount").Caption("Sold Amount").Add();
})).ShowGroupingBar(true).OnFieldDropped("onFieldDropped").Render()

<script>
    function onFieldDropped(args) {
        args.droppedField.caption = args.droppedField.name + " --> " + args.droppedAxis;
    }
</script>
public ActionResult Index()
{
var data = GetPivotData();
ViewBag.DataSource = data;
return View();
}FieldDragStart
The event fieldDragStart fires whenever a field drag starts from its axis. It allows the user to restrict the drag operation based on its parameters. It has the following parameters
-
fieldName: It holds the name of the appropriate field. -
fieldItem: It holds the complete definition of the appropriate field mentioned in data source settings. -
axis: It holds the axis name where the draggable field lies. -
cancel: It is a boolean property and by setting this to true, user can restrict the field from dragging.
In the below sample, the drag operation for the fields in row axis alone is restricted.
@using Syncfusion.EJ2.PivotView

@Html.EJS().PivotView("PivotView").Width("100%").Height("300").DataSourceSettings(dataSource => dataSource.DataSource((IEnumerable<object>)ViewBag.DataSource).ExpandAll(false).EnableSorting(true)
.FormatSettings(formatsettings =>
{
formatsettings.Name("Amount").Format("C0").MaximumSignificantDigits(10).MinimumSignificantDigits(1).UseGrouping(true).Add();
}).Rows(rows =>
{
rows.Name("Country").Add(); rows.Name("Products").Add();
}).Columns(columns =>
{
columns.Name("Year").Add(); columns.Name("Quarter").Add();
}).Values(values =>
{
values.Name("Sold").Caption("Units Sold").Add(); values.Name("Amount").Caption("Sold Amount").Add();
})).ShowGroupingBar(true).FieldDragStart("fieldDragStart").Render()

<script>
    function fieldDragStart(args) {
      if(args.axis === 'rows') {
        args.cancel = true;
      }
    }
</script>
public ActionResult Index()
{
var data = GetPivotData();
ViewBag.DataSource = data;
return View();
}FieldDrop
The event fieldDrop fires whenever a field is dropped into an axis. It allows the user to restrict the drop operation based on its parameters. It has the following parameters
-
fieldName: It holds the name of the appropriate field. -
dropField: It holds the complete definition of the appropriate field mentioned in data source settings. -
draggedAxis: It holds the axis name from where dragging was started. -
dropAxis: It holds the axis name where the field is dropped. -
dropPosition: It holds the dropped index among other existing fields in the axis. -
dataSourceSettings: It holds complete pivot report. -
cancel: It is a boolean property and by setting this to true, user can restrict the field from being dropped.
In the below sample, dropping of any fields in value axis alone is restricted.
@using Syncfusion.EJ2.PivotView

@Html.EJS().PivotView("PivotView").Width("100%").Height("300").DataSourceSettings(dataSource => dataSource.DataSource((IEnumerable<object>)ViewBag.DataSource).ExpandAll(false).EnableSorting(true)
.FormatSettings(formatsettings =>
{
formatsettings.Name("Amount").Format("C0").MaximumSignificantDigits(10).MinimumSignificantDigits(1).UseGrouping(true).Add();
}).Rows(rows =>
{
rows.Name("Country").Add(); rows.Name("Products").Add();
}).Columns(columns =>
{
columns.Name("Year").Add(); columns.Name("Quarter").Add();
}).Values(values =>
{
values.Name("Sold").Caption("Units Sold").Add(); values.Name("Amount").Caption("Sold Amount").Add();
})).ShowGroupingBar(true).FieldDrop("fieldDrop").Render()

<script>
    function fieldDrop(args) {
        if(args.dropAxis === 'values') {
              args.cancel = true;
        }
    }
</script>
public ActionResult Index()
{
var data = GetPivotData();
ViewBag.DataSource = data;
return View();
}FieldRemove
The event fieldRemove fires when removing any field from their axis. It helps the user to limit the elimination of a field based on its parameters. It has the following parameters
-
fieldName: It holds the name of the field to be removed. -
fieldItem: It holds the complete definition of the appropriate field mentioned in data source settings. -
axis: It holds the name of the axis from where it is to remove the field. -
dataSourceSettings: It holds complete pivot report. -
cancel: It is a boolean property and by setting this to true, user can restrict the field from removing.
In the below sample, the field “Country” could not be removed from report by any UI operations.
@using Syncfusion.EJ2.PivotView

@Html.EJS().PivotView("PivotView").Width("100%").Height("300").DataSourceSettings(dataSource => dataSource.DataSource((IEnumerable<object>)ViewBag.DataSource).ExpandAll(false).EnableSorting(true)
.FormatSettings(formatsettings =>
{
formatsettings.Name("Amount").Format("C0").MaximumSignificantDigits(10).MinimumSignificantDigits(1).UseGrouping(true).Add();
}).Rows(rows =>
{
rows.Name("Country").Add(); rows.Name("Products").Add();
}).Columns(columns =>
{
columns.Name("Year").Add(); columns.Name("Quarter").Add();
}).Values(values =>
{
values.Name("Sold").Caption("Units Sold").Add(); values.Name("Amount").Caption("Sold Amount").Add();
})).ShowGroupingBar(true).FieldRemove("fieldRemove").Render()

<script>
   function fieldRemove(args) {
        if(args.fieldName === 'Country') {
            args.cancel = true;
        }
    }
</script>
public ActionResult Index()
{
var data = GetPivotData();
ViewBag.DataSource = data;
return View();
}AggregateMenuOpen
The event aggregateMenuOpen fires while clicking dropdown icon of the value field button UI. It allows to customize the aggregate types to be displayed in the dropdown menu. It has the following parameters
-
fieldName: It holds the name of the field that opens the aggregate menu. -
aggregateTypes: It holds the aggregation types set for a field. -
displayMenuCount: It allows to set the menu count to be displayed initially. By default, its count is 7. -
cancel: It is a boolean property and by setting this to true, dropdown menu won’t be displayed.
In the below sample, the aggregate types of the field “Amount” has been customized in it’s dropdown menu.
@using Syncfusion.EJ2.PivotView

@Html.EJS().PivotView("PivotView").Width("100%").Height("300").DataSourceSettings(dataSource => dataSource.DataSource((IEnumerable<object>)ViewBag.DataSource).ExpandAll(false).EnableSorting(true)
.FormatSettings(formatsettings =>
{
formatsettings.Name("Amount").Format("C0").MaximumSignificantDigits(10).MinimumSignificantDigits(1).UseGrouping(true).Add();
}).Rows(rows =>
{
rows.Name("Country").Add(); rows.Name("Products").Add();
}).Columns(columns =>
{
columns.Name("Year").Add(); columns.Name("Quarter").Add();
}).Values(values =>
{
values.Name("Sold").Caption("Units Sold").Add(); values.Name("Amount").Caption("Sold Amount").Add();
})).ShowGroupingBar(true).AggregateMenuOpen("aggregateMenuOpen").Render()

<script>
  function  aggregateMenuOpen(args) {
        args.displayMenuCount = 4;
        if(args.fieldName === 'Amount') {
            args.aggregateTypes = ['Sum','Avg','Max'];
        }
    }
</script>
public ActionResult Index()
{
var data = GetPivotData();
ViewBag.DataSource = data;
return View();
}
NOTE
The events
aggregateMenuOpen,fieldRemove,fieldDrop,fieldDragStartandonFieldDroppedare applicable for both grouping bar and field list.
ActionBegin
The event actionBegin triggers when the UI action such as sorting, filtering, aggregation or edit calculated field, that are present in the grouping bar UI begin. This allows user to identify the current action being performed at runtime. It has the following parameters:
-
dataSourceSettings: It holds the current data source settings such as input data source, rows, columns, values, filters, format settings and so on. -
actionName: It holds the name of the current action began. The following are the UI actions and their names:
| Action | Action Name |
|---|---|
| Sort icon | Sort field |
| Filter icon | Filter field |
| Aggregation (Value type drop down and menu) | Aggregate field |
| Remove icon | Remove field |
| Edit icon | Edit calculated field |
-
fieldInfo: It holds the selected field information.
NOTE
This option is applicable only when the field based UI actions are performed such as filtering, sorting, removing field from grouping bar, editing and aggregation type change.
-
cancel: It allows user to restrict the current action.
In the below sample, grouping bar UI actions such as sorting and filtering can be restricted by setting the args.cancel option to true in the actionBegin event.
@using Syncfusion.EJ2.PivotView

@Html.EJS().PivotView("PivotView").Width("100%").Height("300").GroupingBarSettings( new PivotViewGroupingBarSettings {
AllowDragAndDrop =true }).DataSourceSettings(dataSource => dataSource.DataSource((IEnumerable<object>)ViewBag.DataSource).ExpandAll(false).EnableSorting(true)
.Rows(rows =>
{
rows.Name("Country").Add(); rows.Name("Products").Add();
}).Columns(columns =>
{
columns.Name("Year").Add(); columns.Name("Quarter").Add();
}).Values(values =>
{
values.Name("Sold").Caption("Units Sold").Add(); values.Name("Amount").Caption("Sold Amount").Add();
})).ShowGroupingBar(true).ActionBegin("actionBegin").Render()

<script>
    function actionBegin(args) {
        if (args.actionName == 'Sort field' || args.actionName == 'Filter field') {
            args.cancel = true;
        }
    }
</script>
public ActionResult Index()
{
var data = GetPivotData();
ViewBag.DataSource = data;
return View();
}ActionComplete
The event actionComplete triggers when the UI action such as as sorting, filtering, aggregation or edit calculated field, that are present in the grouping bar UI, is completed. This allows user to identify the current UI actions being completed at runtime. It has the following parameters:
-
dataSourceSettings: It holds the current data source settings such as input data source, rows, columns, values, filters, format settings and so on. -
actionName: It holds the name of the current action completed. The following are the UI actions and their names:
| Action | Action Name |
|---|---|
| Sort icon | Field sorted |
| Filter icon | Field filtered |
| Aggregation (Value type drop down and menu) | Field aggregated |
| Remove icon | Field removed |
| Edit icon | Calculated field edited |
-
fieldInfo: It holds the selected field information.
NOTE
This option is applicable only when the field based UI actions are performed such as filtering, sorting, removing field from grouping bar, editing and aggregation type change.
-
actionInfo: It holds the unique information about the current UI action. For example, if sorting is completed, the event argument contains information such as sort order and the field name.
@using Syncfusion.EJ2.PivotView

@Html.EJS().PivotView("PivotView").Width("100%").Height("300").GroupingBarSettings( new PivotViewGroupingBarSettings {
AllowDragAndDrop =true }).DataSourceSettings(dataSource => dataSource.DataSource((IEnumerable<object>)ViewBag.DataSource).ExpandAll(false).EnableSorting(true)
.Rows(rows =>
{
rows.Name("Country").Add(); rows.Name("Products").Add();
}).Columns(columns =>
{
columns.Name("Year").Add(); columns.Name("Quarter").Add();
}).Values(values =>
{
values.Name("Sold").Caption("Units Sold").Add(); values.Name("Amount").Caption("Sold Amount").Add();
})).ShowGroupingBar(true).ActionComplete("actionComplete").Render()

<script>
    function actionComplete(args) {
        if (args.actionName == 'Field sorted' || args.actionName == 'Field filtered') {
            // Triggers when the grouping bar UI actions such as sorting and filtering are completed.
        }
    }
</script>
public ActionResult Index()
{
var data = GetPivotData();
ViewBag.DataSource = data;
return View();
}ActionFailure
The event actionFailure triggers when the current UI action fails to achieve the desired result. It has the following parameters:
-
actionName: It holds the name of the current action failed. The following are the UI actions and their names:
| Action | Action Name |
|---|---|
| Sort icon | Sort field |
| Filter icon | Filter field |
| Aggregation (Value type drop down and menu) | Aggregate field |
| Remove icon | Remove field |
| Edit icon | Edit calculated field |
-
errorInfo: It holds the error information of the current UI action.
@using Syncfusion.EJ2.PivotView

@Html.EJS().PivotView("PivotView").Width("100%").Height("300").GroupingBarSettings( new PivotViewGroupingBarSettings {
AllowDragAndDrop =true }).DataSourceSettings(dataSource => dataSource.DataSource((IEnumerable<object>)ViewBag.DataSource).ExpandAll(false).EnableSorting(true)
.Rows(rows =>
{
rows.Name("Country").Add(); rows.Name("Products").Add();
}).Columns(columns =>
{
columns.Name("Year").Add(); columns.Name("Quarter").Add();
}).Values(values =>
{
values.Name("Sold").Caption("Units Sold").Add(); values.Name("Amount").Caption("Sold Amount").Add();
})).ShowGroupingBar(true).ActionFailure("actionFailure").Render()

<script>
    function actionFailure(args) {
        if (args.actionName == 'Sort field' || args.actionName == 'Filter field') {
            // Triggers when the current UI action fails to achieve the desired result.
        }
    }
</script>
public ActionResult Index()
{
var data = GetPivotData();
ViewBag.DataSource = data;
return View();
}