Show or hide totals in ASP.NET MVC Syncfusion® Pivot Table Control
6 Dec 20246 minutes to read
Show or hide grand totals
Allows to show or hide grand totals in rows and columns using the ShowGrandTotals property. To hide the grand totals in rows and columns, set the property ShowGrandTotals in PivotViewDataSourceSettings class to false.
End user can also hide grand totals for row or columns separately by setting the property ShowRowGrandTotals or ShowColumnGrandTotals in DataSourceSettings class to false respectively.
By default,
ShowGrandTotals,ShowRowGrandTotalsandShowColumnGrandTotalsproperties inPivotViewDataSourceSettingsclass are set as true.
@using Syncfusion.EJ2.PivotView

@Html.EJS().PivotView("PivotView").Width("100%").Height("300").GroupingBarSettings( new PivotViewGroupingBarSettings {
ShowRemoveIcon =false }).DataSourceSettings(dataSource => dataSource.DataSource((IEnumerable<object>)ViewBag.DataSource).ExpandAll(false).EnableSorting(true)
.FormatSettings(formatsettings =>
{
formatsettings.Name("Amount").Format("C0").MaximumSignificantDigits(10).MinimumSignificantDigits(1).UseGrouping(true).Add();
}).Rows(rows =>
{
rows.Name("Country").Add(); rows.Name("Products").Add();
}).Columns(columns =>
{
columns.Name("Year").Caption("Year").Add(); columns.Name("Quarter").Add();
}).Values(values =>
{
values.Name("Sold").Caption("Units Sold").Add(); values.Name("Amount").Caption("Sold Amount").Add();
}).ShowGrandTotals(false)).Render()
public ActionResult Index()
{
var data = GetPivotData();
ViewBag.DataSource = data;
return View();
}
Show grand totals at top or bottom
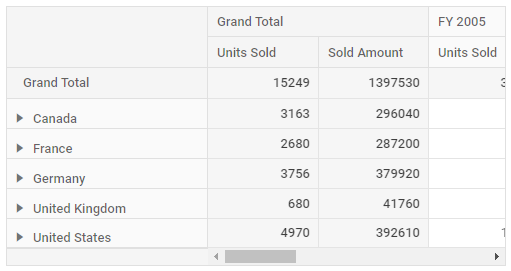
Allows to show grand totals either at top or bottom in rows and columns using the GrandTotalsPosition property. To show the grand totals at top in rows and columns, set the GrandTotalsPosition property in DataSourceSettings to Top.
@using Syncfusion.EJ2.PivotView

@Html.EJS().PivotView("PivotView").Width("100%").Height("300").DataSourceSettings(dataSource => dataSource.DataSource((IEnumerable<object>)ViewBag.DataSource)
.Rows(rows =>
{
rows.Name("Country").Add(); rows.Name("Products").Add();
}).Columns(columns =>
{
columns.Name("Year").Caption("Year").Add(); columns.Name("Quarter").Add();
}).Values(values =>
{
values.Name("Sold").Caption("Units Sold").Add(); values.Name("Amount").Caption("Sold Amount").Add();
}).GrandTotalsPosition(GrandTotalsPosition.Top)).Render()
public ActionResult Index()
{
var data = GetPivotData();
ViewBag.DataSource = data;
return View();
}
Show or hide sub-totals
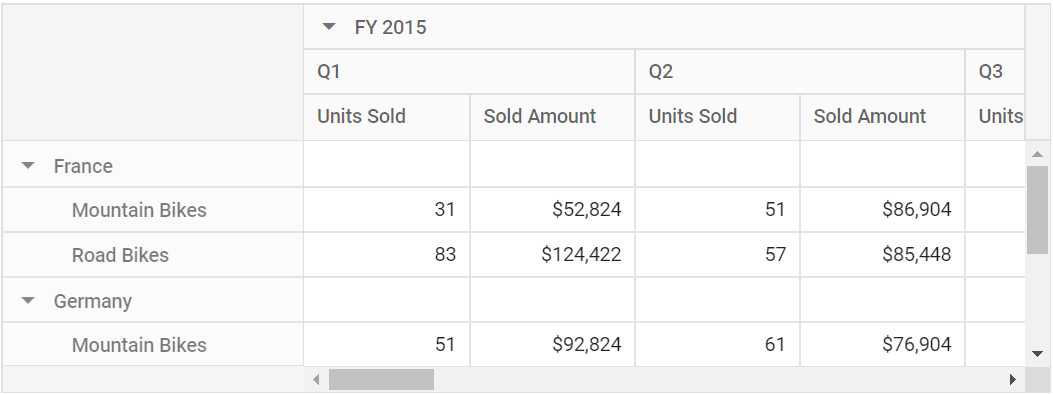
Allows to show or hide sub-totals in rows and columns using the ShowSubTotals property. To hide all the sub-totals in rows and columns, set the property ShowSubTotals in DataSourceSettings class to false. End user can also hide sub-totals for rows or columns separately by setting the property ShowRowSubTotals or ShowColumnSubTotals in DataSourceSettings class to false respectively.
By default,
ShowSubTotals,ShowRowSubTotalsandShowColumnSubTotalsinDataSourceSettingsclass are set as true.
@using Syncfusion.EJ2.PivotView

@Html.EJS().PivotView("PivotView").Width("100%").Height("300").DataSourceSettings(dataSource => dataSource.DataSource((IEnumerable<object>)ViewBag.DataSource).ExpandAll(false).EnableSorting(true)
.FormatSettings(formatsettings =>
{
    formatsettings.Name("Amount").Format("C0").MaximumSignificantDigits(10).MinimumSignificantDigits(1).UseGrouping(true).Add();
}).DrilledMembers(drilledmembers =>
{
    drilledmembers.Name("Country").Items(ViewBag.drilledMembers).Add();
}).Rows(rows =>
{
    rows.Name("Country").Add(); rows.Name("Products").Add();
}).Columns(columns =>
{
    columns.Name("Year").Caption("Year").Add(); columns.Name("Quarter").Add();
}).Values(values =>
{
    values.Name("Sold").Caption("Units Sold").Add(); values.Name("Amount").Caption("Sold Amount").Add();
}).ShowSubTotals(false)).Render()
public ActionResult Index()
{
var data = GetPivotData();
ViewBag.DataSource = data;
ViewBag.drilledMembers = new string[] { "France", "Germany" };
return View();
}
Show or hide sub-totals for specific fields
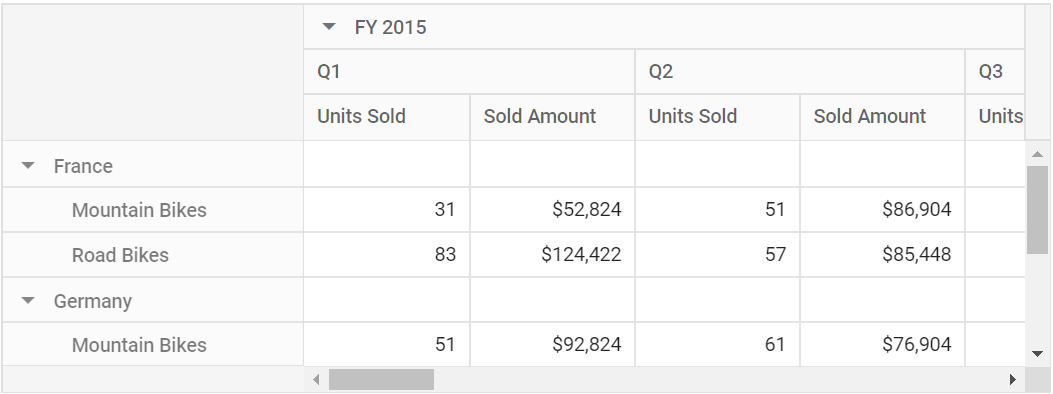
Allows to show or hide sub-totals for specific fields in rows and columns using the ShowSubTotals) property. To hide sub-totals for a specific field in row or column axis, set the property ShowSubTotals property in Row or Column class to false respectively.
By default,
ShowSubTotalsproperty inRoworColumnclass is set as true.
@using Syncfusion.EJ2.PivotView

@Html.EJS().PivotView("PivotView").Width("100%").Height("300").GroupingBarSettings(new PivotViewGroupingBarSettings
{
ShowSortIcon = false
}).DataSourceSettings(dataSource => dataSource.DataSource((IEnumerable<object>)ViewBag.DataSource).ExpandAll(true).EnableSorting(true)
.FormatSettings(formatsettings =>
{
formatsettings.Name("Amount").Format("C0").MaximumSignificantDigits(10).MinimumSignificantDigits(1).UseGrouping(true).Add();
}).Rows(rows =>
{
rows.Name("Country").ShowSubTotals(false).Add(); rows.Name("Products").Add();
}).Columns(columns =>
{
columns.Name("Year").ShowSubTotals(false).Caption("Year").Add(); columns.Name("Quarter").Add();
}).Values(values =>
{
values.Name("Sold").Caption("Units Sold").Add(); values.Name("Amount").Caption("Sold Amount").Add();
})).Render()
public ActionResult Index()
{
var data = GetPivotData();
ViewBag.DataSource = data;
return View();
}
Show sub-totals at top or bottom
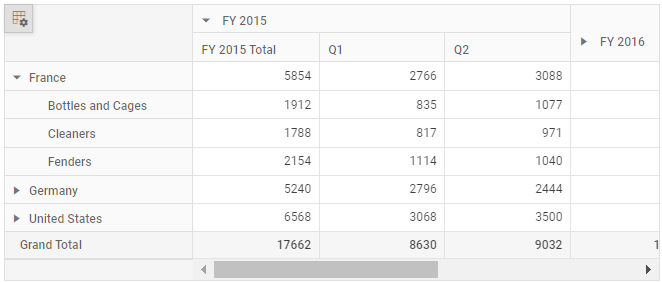
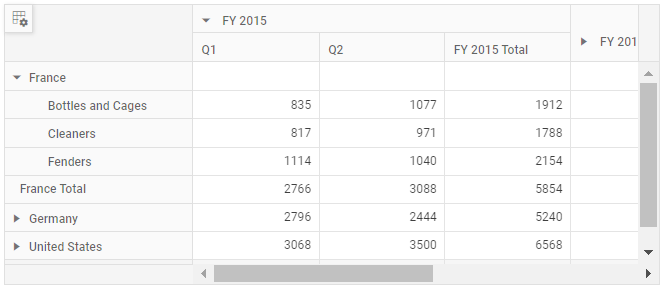
Allows to show sub-totals either at top or bottom of the header group in rows and columns by using the SubTotalsPosition property. By default, SubTotalsPosition property is set to Auto, which means that column sub-totals are displayed at the bottom and row sub-totals are displayed at the top of the header group in the pivot table.
To show sub-totals at top of the header group in rows and columns, set the SubTotalsPosition property in DataSourceSettings to Top.
@using Syncfusion.EJ2.PivotView

@Html.EJS().PivotView("PivotView").Width("100%").Height("300").GroupingBarSettings( new PivotViewGroupingBarSettings {
ShowRemoveIcon =false }).DataSourceSettings(dataSource => dataSource.DataSource((IEnumerable<object>)ViewBag.DataSource).ExpandAll(false).EnableSorting(true)
.FormatSettings(formatsettings =>
{
formatsettings.Name("Amount").Format("C0").MaximumSignificantDigits(10).MinimumSignificantDigits(1).UseGrouping(true).Add();
}).Rows(rows =>
{
rows.Name("Country").Add(); rows.Name("Products").Add();
}).Columns(columns =>
{
columns.Name("Year").Caption("Year").Add(); columns.Name("Quarter").Add();
}).Values(values =>
{
values.Name("Sold").Caption("Units Sold").Add(); values.Name("Amount").Caption("Sold Amount").Add();
}).SubTotalsPosition(SubTotalsPosition.Top)).Render()
public ActionResult Index()
{
var data = GetPivotData();
ViewBag.DataSource = data;
return View();
}
To show sub-totals at bottom of the header group in rows and columns, set the SubTotalsPosition property in DataSourceSettings to Bottom.
@using Syncfusion.EJ2.PivotView

@Html.EJS().PivotView("PivotView").Width("100%").Height("300").GroupingBarSettings( new PivotViewGroupingBarSettings {
ShowRemoveIcon =false }).DataSourceSettings(dataSource => dataSource.DataSource((IEnumerable<object>)ViewBag.DataSource).ExpandAll(false).EnableSorting(true)
.FormatSettings(formatsettings =>
{
formatsettings.Name("Amount").Format("C0").MaximumSignificantDigits(10).MinimumSignificantDigits(1).UseGrouping(true).Add();
}).Rows(rows =>
{
rows.Name("Country").Add(); rows.Name("Products").Add();
}).Columns(columns =>
{
columns.Name("Year").Caption("Year").Add(); columns.Name("Quarter").Add();
}).Values(values =>
{
values.Name("Sold").Caption("Units Sold").Add(); values.Name("Amount").Caption("Sold Amount").Add();
}).SubTotalsPosition(SubTotalsPosition.Bottom)).Render()
public ActionResult Index()
{
var data = GetPivotData();
ViewBag.DataSource = data;
return View();
}
Show or hide totals using toolbar
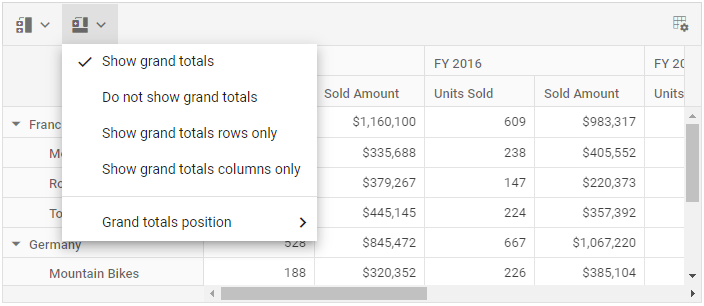
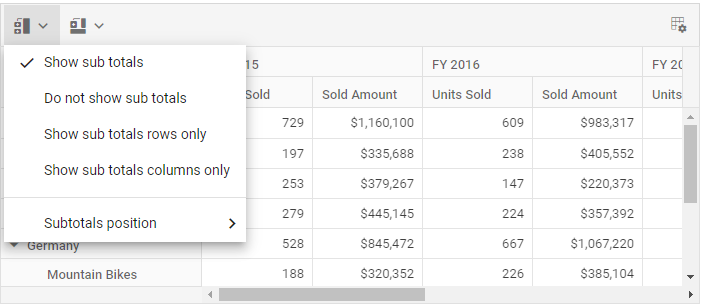
It can also be achieved using built-in toolbar options by setting the ShowToolbar property in PivotView class to true. Also, include the items GrandTotal and SubTotal within the Toolbar property in PivotView class. End user can now see “Show/Hide Grand totals” and “Show/Hide Sub totals” icons in toolbar UI automatically.
The grand totals and sub-totals can be dynamically displayed at the top or bottom of the pivot table’s row and column axes by using the built-in options “Grand totals position” and “Subtotals position” available in the grand totals and sub-totals drop down menus, respectively.
@using Syncfusion.EJ2.PivotView

@Html.EJS().PivotView("pivotview").Width("100%").Height("300").ShowToolbar(true).DataSourceSettings(dataSource => dataSource.DataSource((IEnumerable<object>)ViewBag.DataSource).ExpandAll(false).EnableSorting(true)
.FormatSettings(formatsettings =>
{
    formatsettings.Name("Amount").Format("C0").UseGrouping(true).Add();
})
.Rows(rows =>
{
    rows.Name("Country").Add(); rows.Name("Products").Add();
})
.Columns(columns =>
{
    columns.Name("Year").Add(); columns.Name("Quarter").Add();
})
.Values(values =>
{
    values.Name("Sold").Caption("Units Sold").Add();
    values.Name("Amount").Caption("Sold Amount").Add();
})
).Toolbar(new List<string>() { "SubTotal", "GrandTotal" }).Render()
public ActionResult Index()
{
var data = GetPivotData();
ViewBag.DataSource = data;
return View();
}