How can I help you?
Getting Started with Vue 2 Diagram Component
21 May 20268 minutes to read
This section explains how to create a Vue 2 application from scratch and build a simple diagram using the Syncfusion® Diagram component.
Ready to streamline your Syncfusion® Vue development? Discover the full potential of Syncfusion® Vue components with Syncfusion® AI Coding Assistant. Effortlessly integrate, configure, and enhance your projects with intelligent, context-aware code suggestions, streamlined setups, and real-time insights—all seamlessly integrated into your preferred AI-powered IDEs like VS Code, Cursor, Syncfusion® CodeStudio and more. Explore Syncfusion® AI Coding Assistant
Prerequisites
Before getting started, ensure that your development environment meets the system requirements for Syncfusion® Vue UI components
Before You Begin
This guide uses the Vue 2 application structure generated by Vue CLI.
The main files used in this guide are:
-
src/main.js— Application entry point where the Syncfusion® Vue Diagram plugin is registered. -
src/App.vue— Defines the root Vue component and renders the Diagram component. -
public/index.html— Root HTML file.
NOTE
This guide uses JavaScript for Vue 2 because Vue CLI generates a JavaScript-based Vue 2 application by default.
Step 1: Set up the Vue 2 environment
Use Vue CLI to create and manage Vue 2 applications. Vue CLI provides a standard project structure and development workflow for Vue 2 applications.
Install Vue CLI globally using the following command:
npm install -g @vue/cli
Step 2: Create a Vue 2 application
Create a new Vue 2 application using the following command.
vue create my-diagram-app
When prompted, select the Default ([Vue 2] babel, eslint) preset.
Navigate to the project folder:
cd my-diagram-app
Step 3: Install the Syncfusion® Vue Diagram package
All Syncfusion Essential® JS 2 packages are available in the npmjs.com registry.
Install the Vue Diagram package using the following command:
npm install @syncfusion/ej2-vue-diagrams --save
NOTE
Installing
@syncfusion/ej2-vue-diagramsautomatically installs the required dependency packages.
Step 4: Register the Diagram plugin
Import DiagramPlugin from @syncfusion/ej2-vue-diagrams and register it in the Vue application.
Update the src/main.js file as follows:
import Vue from 'vue';
import App from './App.vue';
import { DiagramPlugin } from '@syncfusion/ej2-vue-diagrams';

Vue.config.productionTip = false;
Vue.use(DiagramPlugin);

new Vue({
 render: h => h(App)
}).$mount('#app');
Step 5: Add the required CSS references
Add the required Syncfusion® styles to the src/App.vue file in the <style> section:
<style>
  @import '../node_modules/@syncfusion/ej2-base/styles/tailwind3.css';
  @import '../node_modules/@syncfusion/ej2-popups/styles/tailwind3.css';
  @import '../node_modules/@syncfusion/ej2-navigations/styles/tailwind3.css';
  @import '../node_modules/@syncfusion/ej2-vue-diagrams/styles/tailwind3.css';
</style>
NOTE
Syncfusion® provides multiple built-in themes. If your application uses a different theme, replace the
tailwind3.cssreferences with the corresponding theme file, such asmaterial3.css.
NOTE
The CSS references can also be moved to a separate global stylesheet if your application follows a centralized styling approach.
Step 6: Add the Diagram component
Add the ejs-diagram component to the Vue component template.
Update the src/App.vue file as follows:
<template>
  <ejs-diagram
    id="diagram"
    width="100%"
    height="580px"
  />
</template>

<script>
  export default {
    name: 'App'
  };
</script>

<style>
  @import '../node_modules/@syncfusion/ej2-base/styles/tailwind3.css';
  @import '../node_modules/@syncfusion/ej2-popups/styles/tailwind3.css';
  @import '../node_modules/@syncfusion/ej2-navigations/styles/tailwind3.css';
  @import '../node_modules/@syncfusion/ej2-vue-diagrams/styles/tailwind3.css';
</style>
At this stage, the Diagram component renders an empty canvas.
NOTE
The Diagram component must have a valid height. If the height is not set, the Diagram canvas may not be visible.
NOTE
In a Vue CLI-generated Vue 2 application, the root element is defined in
public/index.htmlas<div id="app"></div>, and the application is rendered fromsrc/main.js.
Step 7: Create your first Diagram with nodes and connectors
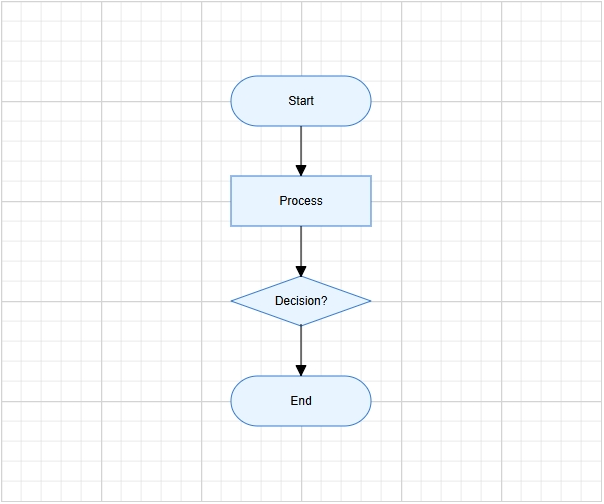
This section explains how to create a simple flowchart by adding nodes, customizing their appearance, and connecting them using connectors.
The following example creates a flowchart with four nodes: Start, Process, Decision, and End. It also applies common node and connector settings using the getNodeDefaults and getConnectorDefaults properties.
Update the src/App.vue file as follows:
<template>
  <ejs-diagram
    id="diagram"
    width="100%"
    height="580px"
    :nodes="nodes"
    :connectors="connectors"
    :getNodeDefaults="nodeDefaults"
    :getConnectorDefaults="connectorDefaults"
  />
</template>

<script>
const terminator = {
  type: 'Flow',
  shape: 'Terminator'
};

const process = {
  type: 'Flow',
  shape: 'Process'
};

const decision = {
  type: 'Flow',
  shape: 'Decision'
};

export default {
  name: 'App',
  data() {
    return {
      nodes: [
        {
          id: 'node1',
          offsetX: 300,
          offsetY: 100,
          shape: terminator,
          annotations: [
            {
              content: 'Start'
            }
          ]
        },
        {
          id: 'node2',
          offsetX: 300,
          offsetY: 200,
          shape: process,
          annotations: [
            {
              content: 'Process'
            }
          ]
        },
        {
          id: 'node3',
          offsetX: 300,
          offsetY: 300,
          shape: decision,
          annotations: [
            {
              content: 'Decision?'
            }
          ]
        },
        {
          id: 'node4',
          offsetX: 300,
          offsetY: 400,
          shape: terminator,
          annotations: [
            {
              content: 'End'
            }
          ]
        }
      ],
      connectors: [
        {
          id: 'connector1',
          sourceID: 'node1',
          targetID: 'node2'
        },
        {
          id: 'connector2',
          sourceID: 'node2',
          targetID: 'node3'
        },
        {
          id: 'connector3',
          sourceID: 'node3',
          targetID: 'node4'
        }
      ]
    };
  },
  methods: {
    nodeDefaults(node) {
      node.width = 140;
      node.height = 50;
      node.style = {
        fill: '#E8F4FF',
        strokeColor: '#357BD2'
      };
      return node;
    },
    connectorDefaults(connector) {
      connector.type = 'Orthogonal';
      connector.targetDecorator = {
        shape: 'Arrow',
        width: 10,
        height: 10
      };
      return connector;
    }
  }
};
</script>

<style>
@import '../node_modules/@syncfusion/ej2-base/styles/tailwind3.css';
@import '../node_modules/@syncfusion/ej2-popups/styles/tailwind3.css';
@import '../node_modules/@syncfusion/ej2-navigations/styles/tailwind3.css';
@import '../node_modules/@syncfusion/ej2-vue-diagrams/styles/tailwind3.css';
</style>
In this example:
-
offsetXandoffsetYdefine the position of each node. -
shapedefines the node shape configuration, andFlowShapeModel.shapespecifies flowchart shapes such asTerminator,Process, orDecision. - The
annotationsproperty adds text inside each node using thecontentfield. -
sourceIDandtargetIDdefine the connection between nodes. -
getNodeDefaultsapplies common width, height, fill color, and stroke color to all nodes. -
getConnectorDefaultsapplies common connector settings, such as orthogonal routing and target arrows.
Step 8: Run the application
Run the application using the following command:
npm run serve
Open the generated local URL in the browser. The application displays the flowchart diagram as shown below: