Excel Export in ASP.NET CORE Pivot Table component
24 Apr 202624 minutes to read
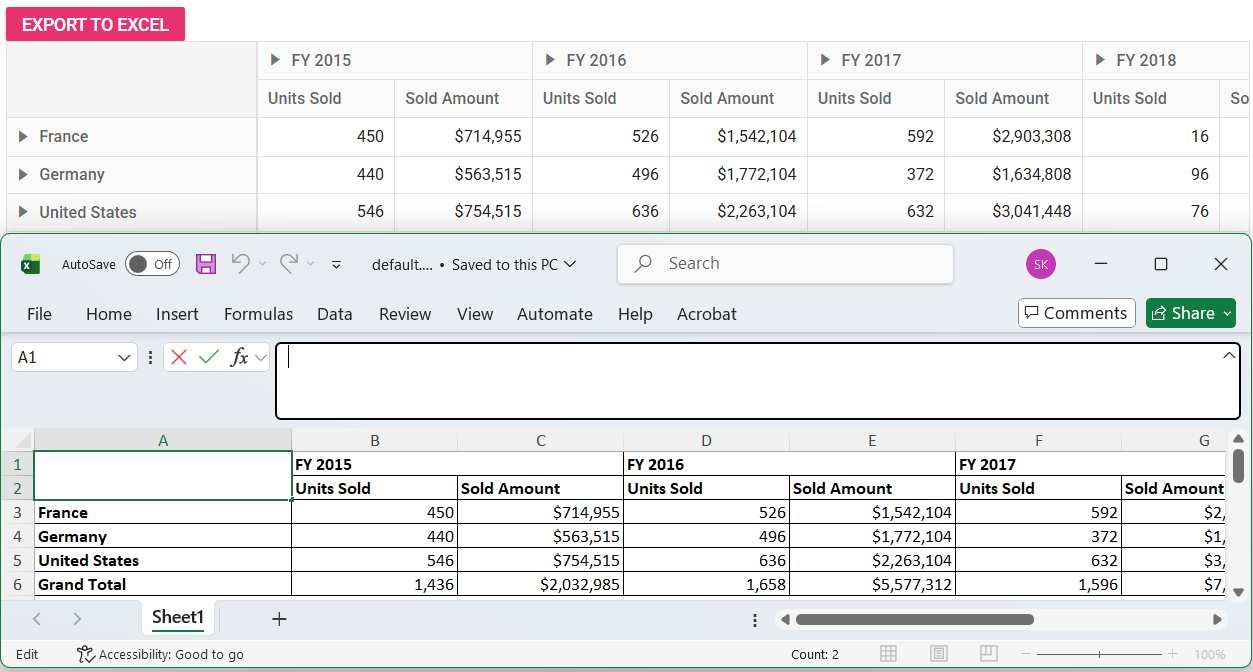
The Pivot Table component supports exporting pivot data to Excel and CSV file formats. This enables data sharing and analysis in spreadsheet applications such as Microsoft Excel, Google Sheets, and more. To enable the export functionality, inject the ExcelExport module into the Pivot Table and set the allowExcelExport property of the ejs-pivotview tag to true.
Export data to an Excel file
Pivot Table data can be exported to an Excel file (.xlsx format) while preserving all formatting and structure. This format is compatible with Microsoft Excel and other spreadsheet applications. To export the data to Excel, invoke the excelExport method.
The Pivot Table component can be exported to Excel format using options available in the toolbar. For more details,
referhere.
<ejs-button id="excel" content="Export To Excel" isPrimary="true"></ejs-button>

<ejs-pivotview id="PivotView" height="300" allowExcelExport="true">
    <e-datasourcesettings dataSource="@ViewBag.DataSource" expandAll="false">
        <e-formatsettings>
            <e-field name="Amount" format="C0" maximumSignificantDigits="10" minimumSignificantDigits="1" useGrouping="true"></e-field>
        </e-formatsettings>
        <e-rows>
            <e-field name="Country"></e-field>
            <e-field name="Products"></e-field>
        </e-rows>
        <e-columns>
            <e-field name="Year" caption="Year"></e-field>
            <e-field name="Quarter"></e-field>
        </e-columns>
        <e-values>
            <e-field name="Sold" caption="Units Sold"></e-field>
            <e-field name="Amount" caption="Sold Amount"></e-field>
        </e-values>
    </e-datasourcesettings>
</ejs-pivotview>

<script>
    var pivotObj;
    document.getElementById('excel').onclick = function () {
        pivotObj = document.getElementById('PivotView').ej2_instances[0];
        pivotObj.excelExport();
    }
</script>
public ActionResult Index()
{
var data = GetPivotData();
ViewBag.DataSource = data;
return View();
}
Export data to a CSV file
Pivot Table data can be exported to a plain text CSV file. The CSV format is lightweight and compatible with most spreadsheet and data analysis applications. To export the data to CSV, invoke the csvExport method.
The Pivot Table component can be exported to CSV format using options available in the toolbar. For more details,
referhere.
<ejs-button id="csv" content="Export To CSV" isPrimary="true"></ejs-button>

<ejs-pivotview id="PivotView" height="300" allowExcelExport="true">
    <e-datasourcesettings dataSource="@ViewBag.DataSource" expandAll="false">
        <e-formatsettings>
            <e-field name="Amount" format="C0" maximumSignificantDigits="10" minimumSignificantDigits="1" useGrouping="true"></e-field>
        </e-formatsettings>
        <e-rows>
            <e-field name="Country"></e-field>
            <e-field name="Products"></e-field>
        </e-rows>
        <e-columns>
            <e-field name="Year" caption="Year"></e-field>
            <e-field name="Quarter"></e-field>
        </e-columns>
        <e-values>
            <e-field name="Sold" caption="Units Sold"></e-field>
            <e-field name="Amount" caption="Sold Amount"></e-field>
        </e-values>
    </e-datasourcesettings>
</ejs-pivotview>

<script>
    var pivotObj;
    document.getElementById('csv').onclick = function () {
        pivotObj = document.getElementById('PivotView').ej2_instances[0];
        pivotObj.csvExport();
    }
</script>
public ActionResult Index()
{
var data = GetPivotData();
ViewBag.DataSource = data;
return View();
}
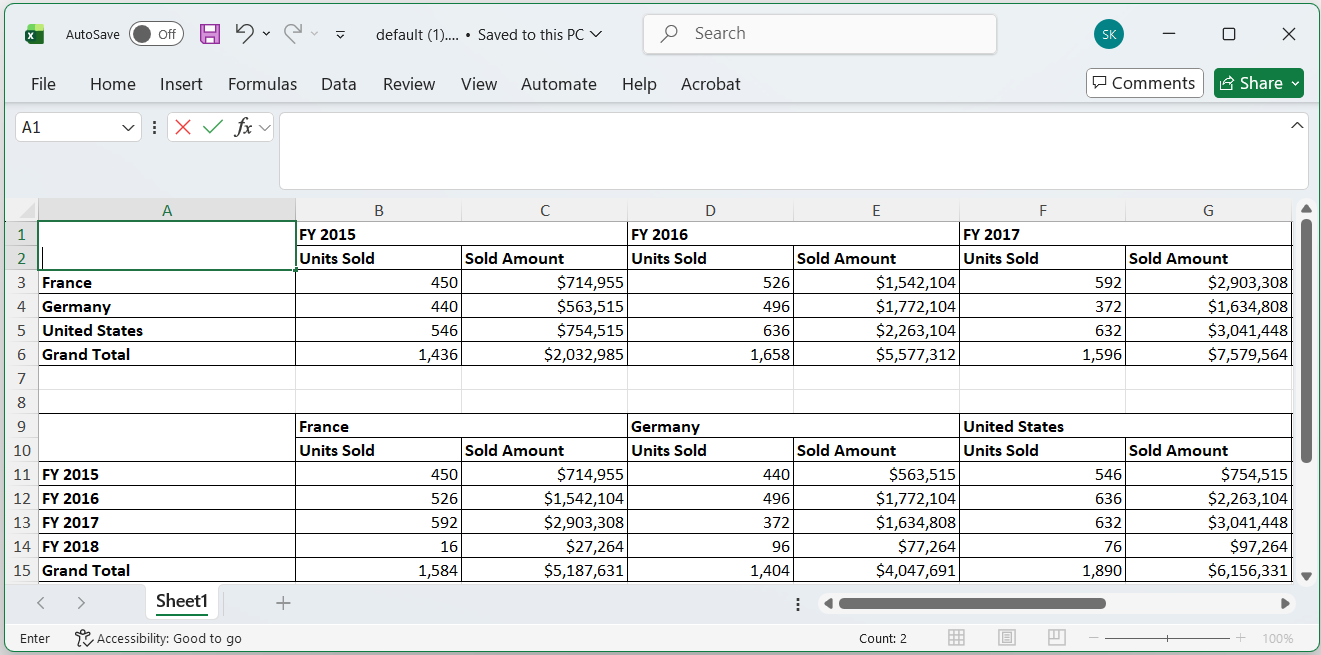
Exporting multiple pivot tables
Multiple Pivot Tables can be exported to a single Excel file, allowing for side-by-side comparison on the same or different worksheets. Each Pivot Table must be rendered with a unique HTML element ID. For example, PivotTable1 for the first table and PivotTable2 for the second. To export both Pivot Tables to a single Excel file, provide their IDs in the pivotTableIds property of the excelExportProperties.
Exporting to the same worksheet
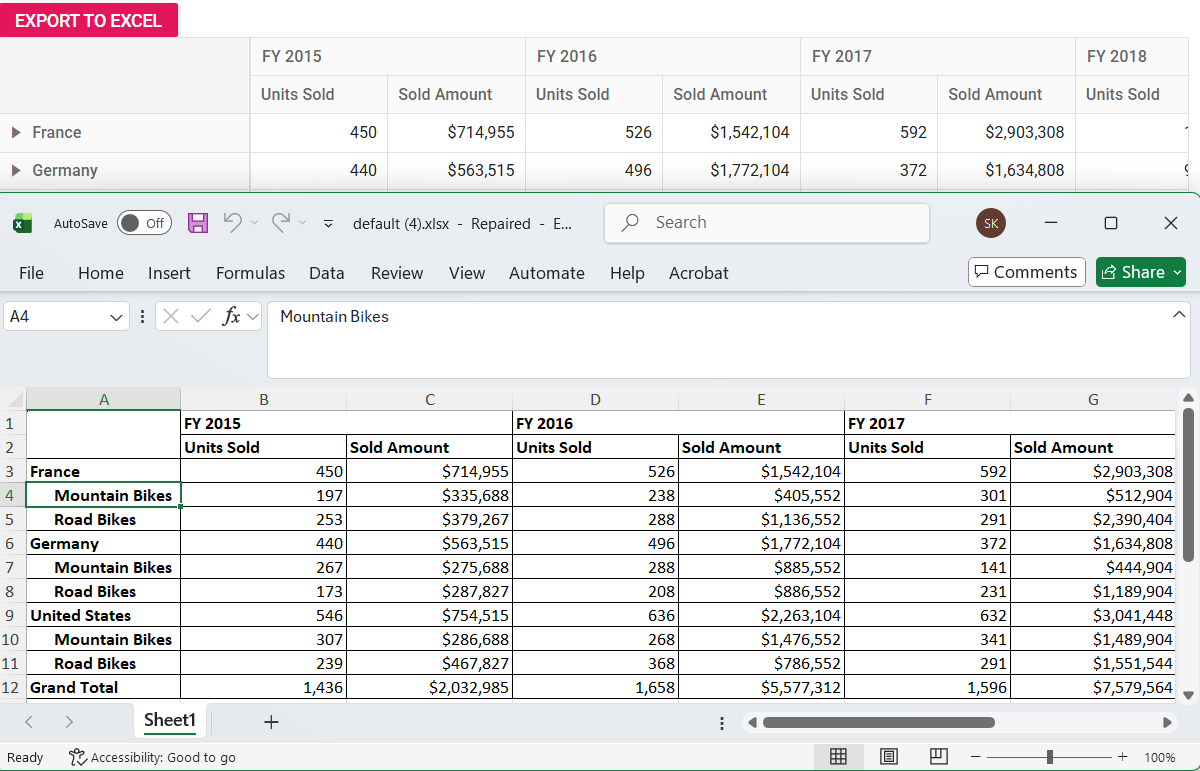
Data from multiple Pivot Tables can be organized in a single view by exporting them to the same worksheet. Set the multipleExport.type property to AppendToSheet in the excelExportProperties, which will append each Pivot Table to the same sheet.
To add visual separation between Pivot Tables, use the multipleExport.blankRows property to specify the number of blank rows to insert between them. This helps maintain readability when multiple Pivot Tables are added in a single worksheet. After configuring these options, call the excelExport method with the isMultipleExport parameter set to true.
By default, the multipleExport.blankRows property is set to 5 blank rows.
<ejs-button id="excel" content="Export To Excel" isPrimary="true"></ejs-button>

<ejs-pivotview id="PivotTable1" height="300" allowExcelExport="true">
    <e-datasourcesettings dataSource="@ViewBag.DataSource" expandAll="false">
        <e-formatsettings>
            <e-field name="Amount" format="C0" maximumSignificantDigits="10" minimumSignificantDigits="1" useGrouping="true"></e-field>
        </e-formatsettings>
        <e-rows>
            <e-field name="Country"></e-field>
            <e-field name="Products"></e-field>
        </e-rows>
        <e-columns>
            <e-field name="Year" caption="Year"></e-field>
            <e-field name="Quarter"></e-field>
        </e-columns>
        <e-values>
            <e-field name="Sold" caption="Units Sold"></e-field>
            <e-field name="Amount" caption="Sold Amount"></e-field>
        </e-values>
    </e-datasourcesettings>
</ejs-pivotview>
<br />
<ejs-pivotview id="PivotTable2" height="300" allowExcelExport="true">
    <e-datasourcesettings dataSource="@ViewBag.DataSource" expandAll="false">
        <e-formatsettings>
            <e-field name="Amount" format="C0" maximumSignificantDigits="10" minimumSignificantDigits="1" useGrouping="true"></e-field>
        </e-formatsettings>
        <e-columns>
            <e-field name="Country"></e-field>
            <e-field name="Products"></e-field>
        </e-columns>
        <e-rows>
            <e-field name="Year" caption="Year"></e-field>
            <e-field name="Quarter"></e-field>
        </e-rows>
        <e-values>
            <e-field name="Sold" caption="Units Sold"></e-field>
            <e-field name="Amount" caption="Sold Amount"></e-field>
        </e-values>
    </e-datasourcesettings>
</ejs-pivotview>

<script>
    var pivotObj; var pivotObj2;
    document.getElementById('excel').onclick = function () {
        pivotObj = document.getElementById('PivotTable1').ej2_instances[0];
        var excelExportProperties = {
            multipleExport: { type: 'AppendToSheet', blankRows: 2 },
            pivotTableIds: ['PivotTable1', 'PivotTable2']
        };
        pivotObj.excelExport(excelExportProperties, true);
    }
</script>
public ActionResult Index()
{
var data = GetPivotData();
ViewBag.DataSource = data;
return View();
}
Exporting to a new worksheet
Multiple Pivot Tables can be organized into separate worksheets within a single Excel file for better structured data management. Set the multipleExport.type property to NewSheet in the excelExportProperties. Each Pivot Table will be exported to its own dedicated worksheet. After configuring these options, call the excelExport method with the isMultipleExport parameter set to true.
<ejs-button id="excel" content="Export To Excel" isPrimary="true"></ejs-button>

<ejs-pivotview id="PivotTable1" height="300" allowExcelExport="true">
    <e-datasourcesettings dataSource="@ViewBag.DataSource" expandAll="false">
        <e-formatsettings>
            <e-field name="Amount" format="C0" maximumSignificantDigits="10" minimumSignificantDigits="1" useGrouping="true"></e-field>
        </e-formatsettings>
        <e-rows>
            <e-field name="Country"></e-field>
            <e-field name="Products"></e-field>
        </e-rows>
        <e-columns>
            <e-field name="Year" caption="Year"></e-field>
            <e-field name="Quarter"></e-field>
        </e-columns>
        <e-values>
            <e-field name="Sold" caption="Units Sold"></e-field>
            <e-field name="Amount" caption="Sold Amount"></e-field>
        </e-values>
    </e-datasourcesettings>
</ejs-pivotview>
<br />
<ejs-pivotview id="PivotTable2" height="300" allowExcelExport="true">
    <e-datasourcesettings dataSource="@ViewBag.DataSource" expandAll="false">
        <e-formatsettings>
            <e-field name="Amount" format="C0" maximumSignificantDigits="10" minimumSignificantDigits="1" useGrouping="true"></e-field>
        </e-formatsettings>
        <e-columns>
            <e-field name="Country"></e-field>
            <e-field name="Products"></e-field>
        </e-columns>
        <e-rows>
            <e-field name="Year" caption="Year"></e-field>
            <e-field name="Quarter"></e-field>
        </e-rows>
        <e-values>
            <e-field name="Sold" caption="Units Sold"></e-field>
            <e-field name="Amount" caption="Sold Amount"></e-field>
        </e-values>
    </e-datasourcesettings>
</ejs-pivotview>

<script>
    var pivotObj; var pivotObj2;
    document.getElementById('excel').onclick = function () {
        pivotObj = document.getElementById('PivotTable1').ej2_instances[0];
        var excelExportProperties = {
            multipleExport: { type: 'NewSheet' },
            pivotTableIds: ['PivotTable1', 'PivotTable2']
        };
        pivotObj.excelExport(excelExportProperties, true);
    }
</script>
public ActionResult Index()
{
var data = GetPivotData();
ViewBag.DataSource = data;
return View();
}
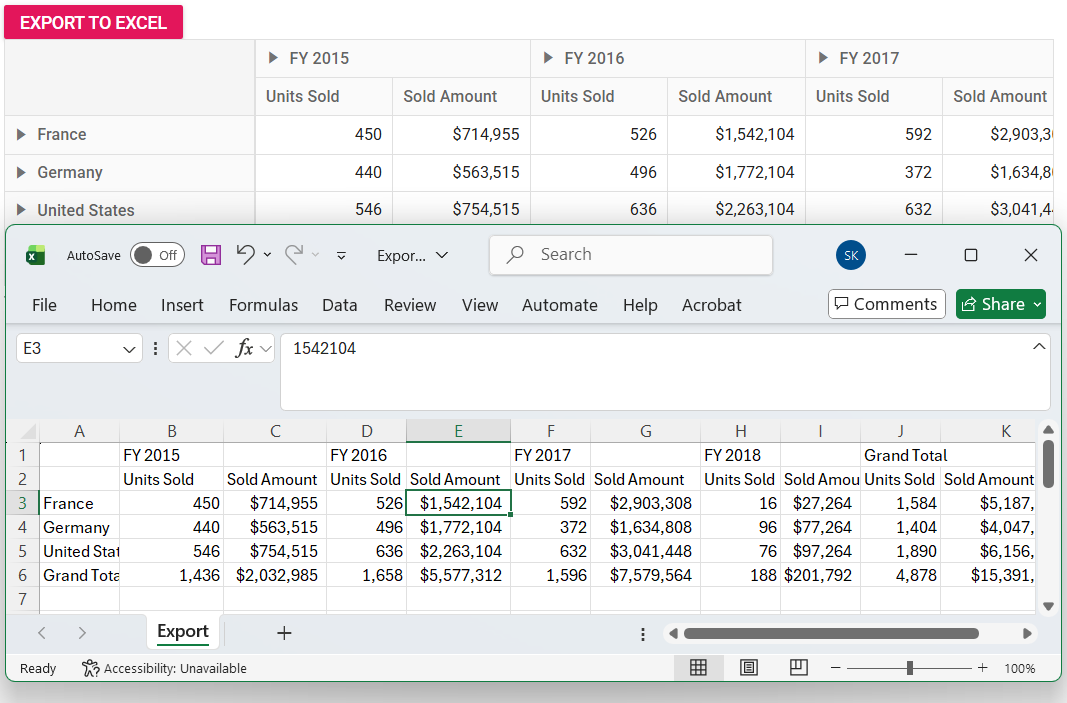
Customize the pivot report during export
Pivot Table report settings can be customized before exporting, such as applying filters, adding formatting, or performing drill-down and drill-up operations. These customizations are applied exclusively to the exported file and do not affect the Pivot Table UI. To customize the export behavior, use the beforeExport event, which is triggered before the export operation begins.
In the following example, the beforeExport event is used to expand all Pivot Table headers by setting the expandAll property to true. The generateGridData method is then called to obtain the updated pivotValues. The updated pivotValues are assigned to args.dataCollections for the export. Finally, expandAll is set to false again to restore the original state of the Pivot Table.
<ejs-button id="excel" content="Export To Excel" isPrimary="true"></ejs-button>

<ejs-pivotview id="PivotView" height="300" allowExcelExport="true" beforeExport="beforeExport">
    <e-datasourcesettings dataSource="@ViewBag.DataSource" expandAll="false">
        <e-formatsettings>
            <e-field name="Amount" format="C0"></e-field>
        </e-formatsettings>
        <e-rows>
            <e-field name="Country"></e-field>
            <e-field name="Products"></e-field>
        </e-rows>
        <e-columns>
            <e-field name="Year" caption="Year"></e-field>
        </e-columns>
        <e-values>
            <e-field name="Sold" caption="Units Sold"></e-field>
            <e-field name="Amount" caption="Sold Amount"></e-field>
        </e-values>
    </e-datasourcesettings>
</ejs-pivotview>

<script>
    var pivotObj;
    document.getElementById('excel').onclick = function () {
        pivotObj = document.getElementById('PivotView').ej2_instances[0];
        pivotObj.excelExport();
    }
    function beforeExport(args) {
        var pivotGridObj = document.getElementById('PivotView').ej2_instances[0];
        var drilledMembers = pivotGridObj.dataSourceSettings.drilledMembers;
        pivotGridObj.setProperties({ dataSourceSettings: { expandAll: true, drilledMembers: [] } }, true);
        pivotGridObj.engineModule.generateGridData(pivotGridObj.dataSourceSettings, true);
        args.dataCollections = [pivotGridObj.engineModule.pivotValues];
        pivotGridObj.setProperties({ dataSourceSettings: { expandAll: false, drilledMembers: drilledMembers } }, true);
    }
</script>
public ActionResult Index()
{
var data = GetPivotData();
ViewBag.DataSource = data;
return View();
}
Export with custom aggregates
The Pivot Table supports exporting data with custom calculations beyond the default options such as Sum, Count, or Average. Custom aggregates enable advanced analytical scenarios where standard calculations are insufficient.
To add custom aggregates, follow these steps:
- Define custom aggregate names using the localization option. These names will appear in the Pivot Table’s aggregation menu.
- Add the custom aggregation types to the aggregate menu during Pivot Table initialization using the
dataBoundevent. - Use the
aggregateCellInfoevent to specify the calculation logic for each custom type. This event is triggered for every aggregate cell, allowing you to apply your custom formulas. - Finally, call the
excelExportmethod to export the Pivot Table with all custom aggregations applied.
For detailed information about adding custom aggregation types, refer to the custom aggregation documentation.
The following example demonstrates how to add two custom aggregate types to the aggregate menu: CustomAggregateType 1, which calculates a weighted average, and CustomAggregateType 2, which calculates the percentage of the total.
<ejs-button id="excel" content="Export To Excel" isPrimary="true"></ejs-button>

<ejs-pivotview id="pivotview" height="300" dataBound="onDataBound" aggregateCellInfo="aggregateCell" showFieldList="true" allowExcelExport="true">
    <e-datasourcesettings dataSource="@ViewBag.DataSource" expandAll="false">
        <e-formatsettings>
            <e-field name="Amount" format="C0"></e-field>
        </e-formatsettings>
        <e-rows>
            <e-field name="Country"></e-field>
            <e-field name="Products"></e-field>
        </e-rows>
        <e-columns>
            <e-field name="Year" caption="Year"></e-field>
            <e-field name="Quarter"></e-field>
        </e-columns>
        <e-values>
            <e-field name="Sold" caption="Units Sold"></e-field>
            <e-field name="Amount" caption="Sold Amount"></e-field>
        </e-values>
    </e-datasourcesettings>
</ejs-pivotview>
<script>
    var SummaryType = [
        'Sum',
        'Count',
        'DistinctCount',
        'Avg',
        'CustomAggregateType1',
        'CustomAggregateType2'
    ];
    var L10n = ej.base.L10n;
    L10n.load({
       'en-US': {
            pivotview: {
                CustomAggregateType1: 'Custom Aggregate Type 1',
                CustomAggregateType2: 'Custom Aggregate Type 2',
            },
            pivotfieldlist: {
                CustomAggregateType1: 'Custom Aggregate Type 1',
                CustomAggregateType2: 'Custom Aggregate Type 2',
            }
        }
    });
    function onDataBound() {
        var pivotObj = document.getElementById('pivotview').ej2_instances[0];
        pivotObj.getAllSummaryType = function () {
            return SummaryType;
        };
        pivotObj.pivotFieldListModule.aggregateTypes = SummaryType;
        pivotObj.pivotFieldListModule.getAllSummaryType = function () {
            return SummaryType;
        };
        pivotObj.dataSourceSettings.values[0].type = 'CustomAggregateType1';
        pivotObj.dataSourceSettings.values[1].type = 'CustomAggregateType2';
    }
     function aggregateCell(args){
        if (args.aggregateType === 'CustomAggregateType1') {
            args.value = args.value * 100;
        }
        if (args.aggregateType === 'CustomAggregateType2') {
            args.value = args.value / 100;
        }
    }
    var pivotObj;
    document.getElementById('excel').onclick = function () {
        pivotObj = document.getElementById('pivotview').ej2_instances[0];
        pivotObj.excelExport();
    }
</script>
public ActionResult Index()
{
var data = GetPivotData();
ViewBag.DataSource = data;
return View();
}
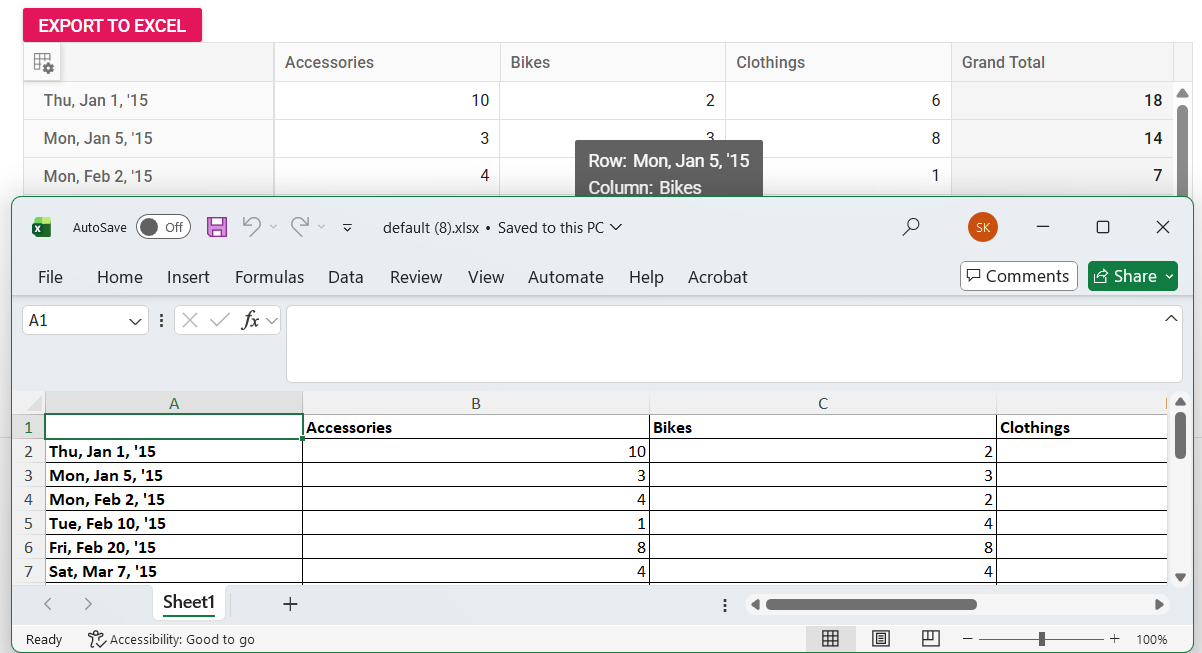
Export with custom date format
The Pivot Table component allows applying custom date formatting to date-type fields added to the row and column axes. This formatting ensures consistency across both the rendered pivot table and the exported file. Custom date formatting can be applied by configuring the e-formatsettings property using the following steps:
- Set the
nameproperty to the target date field. - Set the
typeproperty to date to identify the field as a date type. - Set the
formatproperty to the desired date format pattern (for example,"EEE, MMM d, ''yy")
After configuration, call the excelExport method to export the Pivot Table with the applied formatting.
The following example demonstrates exporting a Pivot Table with a custom date format. The Date field uses the pattern "EEE, MMM d, ''yy", which displays dates in the format: day-of-the-week abbreviation, month abbreviation, day, and two-digit year (for example, Sun, May 8, ‘23).
<ejs-button id="excel" content="Export To Excel" isPrimary="true"></ejs-button>

<ejs-pivotview id="PivotView" height="300" allowExcelExport="true" showFieldList="true">
    <e-datasourcesettings dataSource="@ViewBag.DataSource" expandAll="false">
        <e-formatsettings>
            <e-field name="Date" type="date" format="EEE, MMM d, ''yy"></e-field>
        </e-formatsettings>
        <e-rows>
            <e-field name="Date"></e-field>
        </e-rows>
        <e-columns>
            <e-field name="Products" caption="Product Categories"></e-field>
        </e-columns>
        <e-values>
            <e-field name="Sold" caption="Units Sold"></e-field>
        </e-values>
    </e-datasourcesettings>
</ejs-pivotview>

<script>
    var pivotObj;
    document.getElementById('excel').onclick = function () {
        pivotObj = document.getElementById('PivotView').ej2_instances[0];
        pivotObj.excelExport();
    }
</script>
public ActionResult Index()
{
var data = GetPivotData();
ViewBag.DataSource = data;
return View();
}
public class PivotData
{
public int Product_ID { get; set; }
public DateTime Date { get; set; }
public string Products { get; set; }
public int Sold { get; set; }
public double Amount { get; set; }
}
public List<PivotData> GetPivotData()
{
var pivotData = new List<PivotData>
{
new PivotData { Date = new DateTime(2015, 1, 1, 20, 18, 15), Products = "Accessories", Product_ID = 1001, Sold = 2, Amount = 0.00 },
new PivotData { Date = new DateTime(2015, 1, 1, 20, 18, 15), Products = "Accessories", Product_ID = 1002, Sold = 3, Amount = 0.00 },
new PivotData { Date = new DateTime(2015, 1, 1, 20, 18, 15), Products = "Accessories", Product_ID = 1003, Sold = 5, Amount = 0.00 },
new PivotData { Date = new DateTime(2015, 1, 1, 20, 18, 15), Products = "Bikes", Product_ID = 1004, Sold = 1, Amount = 0.00 },
new PivotData { Date = new DateTime(2015, 1, 1, 20, 18, 15), Products = "Bikes", Product_ID = 1005, Sold = 1, Amount = 0.00 },
new PivotData { Date = new DateTime(2015, 1, 1, 20, 18, 15), Products = "Clothings", Product_ID = 1007, Sold = 2, Amount = 0.00 },
new PivotData { Date = new DateTime(2015, 1, 1, 20, 18, 15), Products = "Clothings", Product_ID = 1008, Sold = 1, Amount = 0.00 },
new PivotData { Date = new DateTime(2015, 1, 1, 20, 18, 15), Products = "Clothings", Product_ID = 1009, Sold = 3, Amount = 0.00 },
new PivotData { Date = new DateTime(2015, 1, 5, 20, 19, 15), Products = "Accessories", Product_ID = 1003, Sold = 3, Amount = 0.00 },
new PivotData { Date = new DateTime(2015, 1, 5, 20, 19, 15), Products = "Bikes", Product_ID = 1004, Sold = 3, Amount = 0.00 },
new PivotData { Date = new DateTime(2015, 1, 5, 20, 19, 15), Products = "Clothings", Product_ID = 1008, Sold = 8, Amount = 0.00 },
new PivotData { Date = new DateTime(2015, 2, 2, 10, 22, 07), Products = "Accessories", Product_ID = 1002, Sold = 4, Amount = 0.00 },
new PivotData { Date = new DateTime(2015, 2, 2, 10, 22, 07), Products = "Bikes", Product_ID = 1005, Sold = 2, Amount = 0.00 },
new PivotData { Date = new DateTime(2015, 2, 2, 10, 22, 07), Products = "Clothings", Product_ID = 1009, Sold = 1, Amount = 0.00 },
new PivotData { Date = new DateTime(2015, 2, 10, 10, 23, 07), Products = "Accessories", Product_ID = 1002, Sold = 1, Amount = 0.00 },
new PivotData { Date = new DateTime(2015, 2, 10, 10, 23, 07), Products = "Bikes", Product_ID = 1006, Sold = 4, Amount = 0.00 },
new PivotData { Date = new DateTime(2015, 2, 10, 10, 23, 07), Products = "Clothings", Product_ID = 1010, Sold = 6, Amount = 0.00 },
new PivotData { Date = new DateTime(2015, 2, 20, 11, 25, 07), Products = "Clothings", Product_ID = 1002, Sold = 8, Amount = 0.00 },
new PivotData { Date = new DateTime(2015, 2, 20, 11, 25, 07), Products = "Bikes", Product_ID = 1002, Sold = 8, Amount = 0.00 },
new PivotData { Date = new DateTime(2015, 2, 20, 11, 25, 07), Products = "Accessories", Product_ID = 1002, Sold = 8, Amount = 0.00 },
new PivotData { Date = new DateTime(2015, 3, 7, 5, 11, 50), Products = "Accessories", Product_ID = 1001, Sold = 4, Amount = 0.00 },
new PivotData { Date = new DateTime(2015, 3, 7, 5, 11, 50), Products = "Clothings", Product_ID = 1001, Sold = 4, Amount = 0.00 },
new PivotData { Date = new DateTime(2015, 3, 7, 5, 11, 50), Products = "Bikes", Product_ID = 1001, Sold = 4, Amount = 0.00 },
new PivotData { Date = new DateTime(2015, 3, 13, 5, 11, 55), Products = "Bikes", Product_ID = 1005, Sold = 2, Amount = 0.00 },
new PivotData { Date = new DateTime(2015, 3, 13, 5, 11, 55), Products = "Clothings", Product_ID = 1005, Sold = 2, Amount = 0.00 },
new PivotData { Date = new DateTime(2015, 3, 13, 5, 11, 55), Products = "Accessories", Product_ID = 1005, Sold = 2, Amount = 0.00 },
new PivotData { Date = new DateTime(2015, 9, 1, 4, 14, 43), Products = "Bikes", Product_ID = 1004, Sold = 1, Amount = 0.00 },
new PivotData { Date = new DateTime(2015, 9, 1, 4, 14, 43), Products = "Clothings", Product_ID = 1010, Sold = 2, Amount = 0.00 },
new PivotData { Date = new DateTime(2015, 9, 1, 4, 14, 43), Products = "Accessories", Product_ID = 1004, Sold = 1, Amount = 0.00 },
};
return pivotData;
}
Remove row header during export
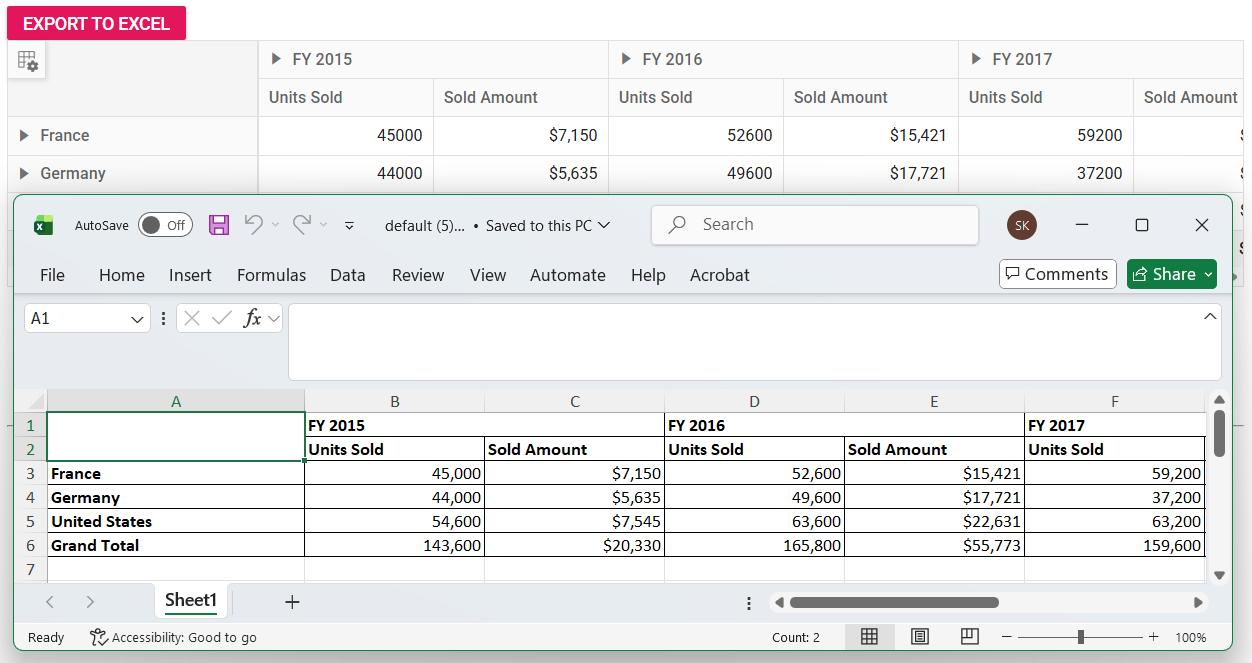
Row headers can be excluded from the exported Excel file when only values and column headers are required. To achieve this, use the beforeExport event to access pivot values through args.dataCollections and remove the row headers before exporting.
<ejs-button id="excel" content="Export To Excel" isPrimary="true"></ejs-button>

<ejs-pivotview id="PivotView" height="300" allowExcelExport="true" beforeExport="beforeExport">
    <e-datasourcesettings dataSource="@ViewBag.DataSource" expandAll="false">
        <e-formatsettings>
            <e-field name="Amount" format="C0"></e-field>
        </e-formatsettings>
        <e-rows>
            <e-field name="Country"></e-field>
            <e-field name="Products"></e-field>
        </e-rows>
        <e-columns>
            <e-field name="Year" caption="Year"></e-field>
        </e-columns>
        <e-values>
            <e-field name="Sold" caption="Units Sold"></e-field>
            <e-field name="Amount" caption="Sold Amount"></e-field>
        </e-values>
    </e-datasourcesettings>
</ejs-pivotview>

<script>
    var pivotObj;
    document.getElementById('excel').onclick = function () {
        pivotObj = document.getElementById('PivotView').ej2_instances[0];
        pivotObj.excelExport();
    }
    function beforeExport(args) {
        for (var i = 0; i < args.dataCollections.length; i++) {
            var pivotValue = args.dataCollections[i];
            for (var j = 0; j < pivotValue.length; j++) {
                var row = pivotValue[j];
                if (row) {
                    pivotValue[j] = row.filter(function (item) {
                        return item !== null && (item.axis !== 'row');
                    });
                }
            }
        }
    }
</script>
public ActionResult Index()
{
var data = GetPivotData();
ViewBag.DataSource = data;
return View();
}
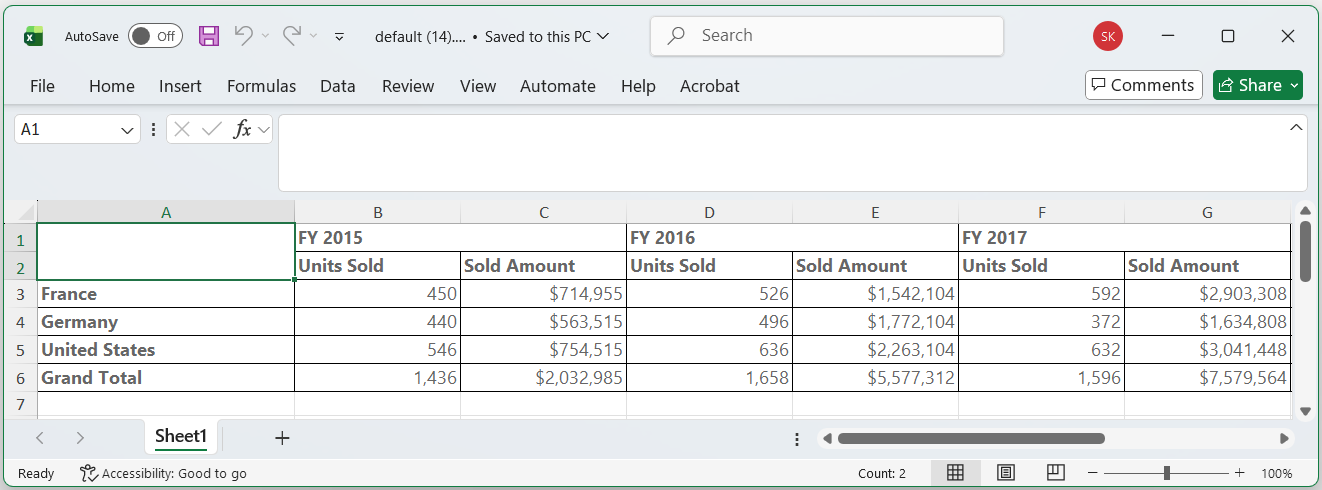
Exclude hidden columns during export
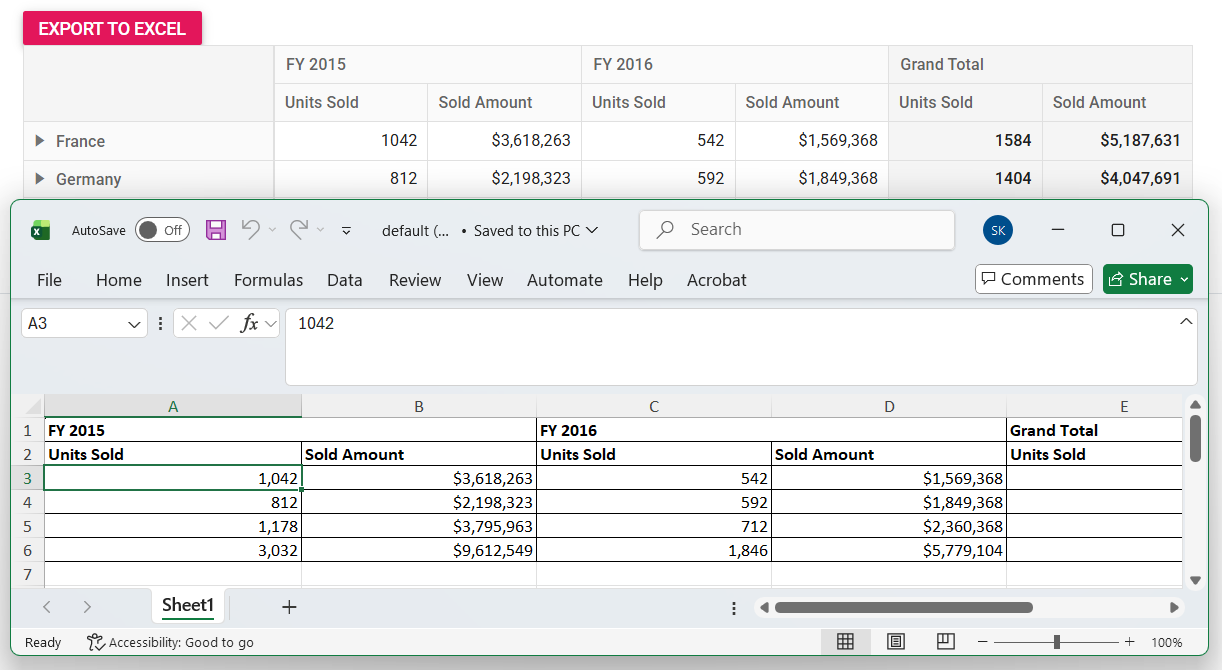
By default, all columns in the Pivot Table, including hidden ones, are exported. To exclude hidden columns, set the includeHiddenColumn property to false in excelExportProperties.
To hide a column, use the columnRender event in e-gridSettings to set the visible property of the target column to false. For more information, see the Hide Specific Columns in Pivot Table documentation.
After hiding the columns, set includeHiddenColumn to false in excelExportProperties to exclude them from the exported file. The exported file will then match the column structure shown in the Pivot Table UI.
<ejs-button id="excel" content="Export To Excel" isPrimary="true"></ejs-button>

<ejs-pivotview id="PivotView" height="300" allowExcelExport="true">
    <e-datasourcesettings dataSource="@ViewBag.DataSource" expandAll="false">
        <e-formatsettings>
            <e-field name="Amount" format="C0"></e-field>
        </e-formatsettings>
        <e-rows>
            <e-field name="Country"></e-field>
            <e-field name="Products"></e-field>
        </e-rows>
        <e-columns>
            <e-field name="Year" caption="Year"></e-field>
            <e-field name="Quarter"></e-field>
        </e-columns>
        <e-values>
            <e-field name="Sold" caption="Units Sold"></e-field>
            <e-field name="Amount" caption="Sold Amount"></e-field>
        </e-values>
    </e-datasourcesettings>
    <e-gridSettings columnRender="columnRender"></e-gridSettings>
</ejs-pivotview>

<script>
    var pivotObj;
    document.getElementById('excel').onclick = function () {
        pivotObj = document.getElementById('PivotView').ej2_instances[0];
        let excelExportProperties = {
            includeHiddenColumn: false
        };
        pivotObj.excelExport(excelExportProperties);
    }
    function columnRender(args) {
        for (var i = 1; i < args.columns.length; i++) {
            if (args.stackedColumns[i].customAttributes &&
                args.stackedColumns[i].customAttributes.cell.valueSort.levelName === 'FY 2016.Units Sold') {
                args.stackedColumns[i].visible = false;
            }
        }
    }
</script>
public ActionResult Index()
{
var data = GetPivotData();
ViewBag.DataSource = data;
return View();
}Rotate cell text during export
The style of each cell in the exported file can be customized, including rotating text, changing background colors, and applying other visual modifications. This approach is useful for creating visually distinct Pivot Table and for fitting text within limited space.
To rotate text, use the following events:
-
excelHeaderQueryCellInfo: Triggered for column headers. This event is used to customize column header cell styles. -
excelQueryCellInfo: Triggered for row and value cells. This event is used to customize row header and value cell styles.
Within these events, set the rotation property in the style argument to rotate the text to the desired angle.
@{
    var data = new int[] { 90, 135, 180, 270 };
}
<div style="display: flex; gap: 20px; align-items: center;">
    <ejs-button id="excel" content="Export To Excel" isPrimary="true"></ejs-button>

    <div style="display: flex; align-items: center; gap: 10px;">
        <label>Select a degree:</label>
        <ejs-dropdownlist id="dropDown" width="150px" placeholder="Select a degree" dataSource="data"></ejs-dropdownlist>
    </div>
</div>

<ejs-pivotview id="PivotView" height="300" allowExcelExport="true">
    <e-datasourcesettings dataSource="@ViewBag.DataSource" expandAll="false">
        <e-formatsettings>
            <e-field name="Amount" format="C0"></e-field>
        </e-formatsettings>
        <e-rows>
            <e-field name="Country"></e-field>
            <e-field name="Products"></e-field>
        </e-rows>
        <e-columns>
            <e-field name="Year" caption="Year"></e-field>
        </e-columns>
        <e-values>
            <e-field name="Sold" caption="Units Sold"></e-field>
        </e-values>
    </e-datasourcesettings>
    <e-gridSettings excelHeaderQueryCellInfo="excelHeaderQueryCellInfo" excelQueryCellInfo="excelQueryCellInfo"></e-gridSettings>
</ejs-pivotview>

<script>
    var pivotObj;
    document.getElementById('excel').onclick = function () {
        pivotObj = document.getElementById('PivotView').ej2_instances[0];
        pivotObj.excelExport();
    }
    function excelHeaderQueryCellInfo(args) {
        var dropDownListObject = document.getElementById("dropDown").ej2_instances[0];
        args.style = { rotation: dropDownListObject.value };
    }
    function excelQueryCellInfo(args) {
        var dropDownListObject = document.getElementById("dropDown").ej2_instances[0];
        args.style = { rotation: dropDownListObject.value };
    }
</script>
public ActionResult Index()
{
var data = GetPivotData();
ViewBag.DataSource = data;
return View();
}Apply custom styles based on specific conditions
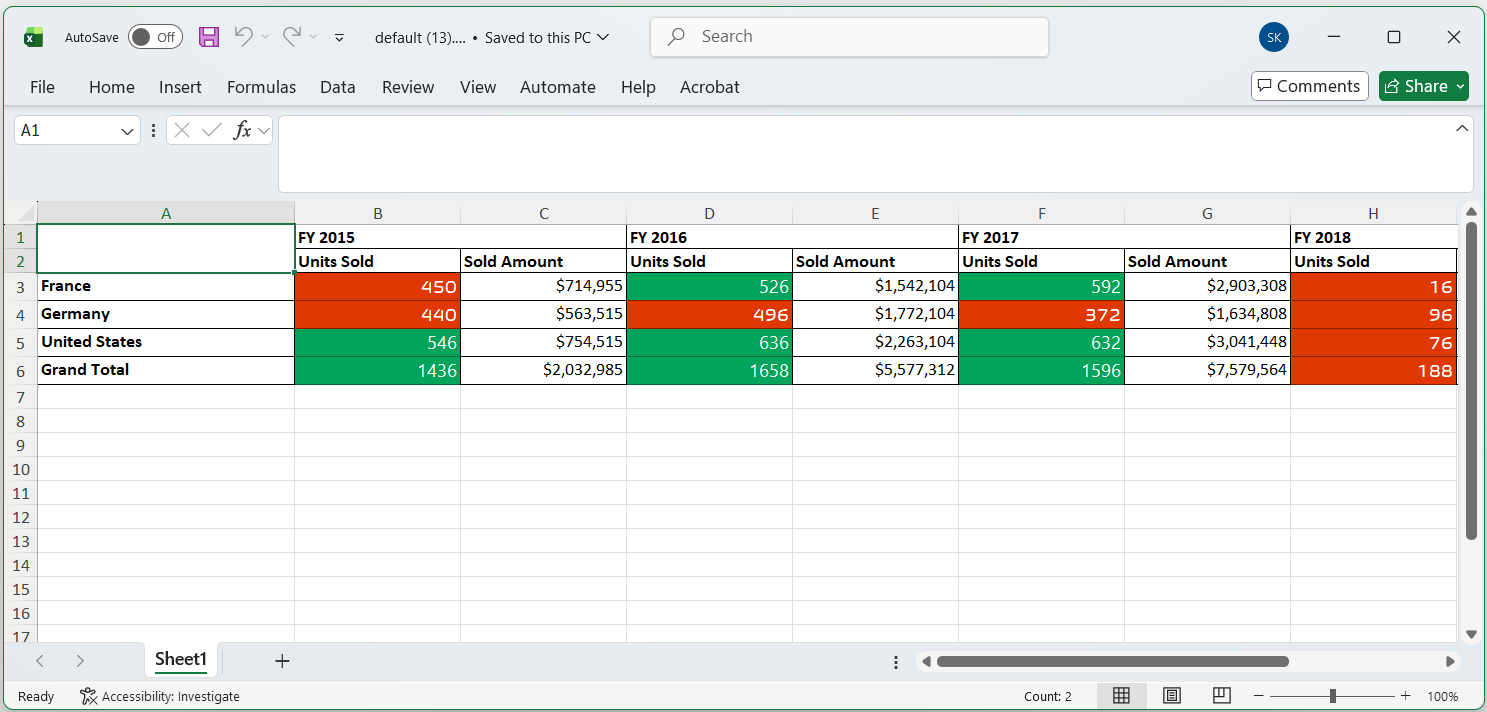
When exporting Pivot Table data to Excel, custom styles can be applied to cells based on their values or other criteria. To apply custom styles, use the excelQueryCellInfo event. In this event, the cell information can be accessed through the args.cell property, and its style properties, such as backColor, fontName, and fontColor, can be customized.
The following example demonstrates how to apply conditional formatting to the Sold field values in the exported Excel document. Values below 700 units are highlighted in red, while values of 700 units or more are highlighted in green.
<ejs-button id="excel" content="Export To Excel" isPrimary="true"></ejs-button>
<ejs-pivotview id="PivotView" height="300" allowExcelExport="true">
    <e-datasourcesettings dataSource="@ViewBag.DataSource" expandAll="false">
        <e-formatsettings>
            <e-field name="Amount" format="C0"></e-field>
        </e-formatsettings>
        <e-rows>
            <e-field name="Country"></e-field>
            <e-field name="Products"></e-field>
        </e-rows>
        <e-columns>
            <e-field name="Year" caption="Year"></e-field>
            <e-field name="Quarter"></e-field>
        </e-columns>
        <e-values>
            <e-field name="Sold" caption="Units Sold"></e-field>
            <e-field name="Amount" caption="Sold Amount"></e-field>
        </e-values>
    </e-datasourcesettings>
    <e-gridSettings excelQueryCellInfo="excelQueryCellInfo"></e-gridSettings>
</ejs-pivotview>

<script>
    var pivotObj;
    document.getElementById('excel').onclick = function () {
        pivotObj = document.getElementById('PivotView').ej2_instances[0];
        pivotObj.excelExport();
    }
    function excelQueryCellInfo(args) {
        if (args.cell && args.cell.actualText === 'Sold') {
            if (args.value < 500) {
                args.style = {
                    backColor: '#df3800',
                    fontName: 'Biome',
                    fontColor: '#FFFFFF',
                    borders: { color: '#8B1E00', lineStyle: 'thin' }
                };
            }
            else {
                args.style = {
                    backColor: '#00A45A',
                    fontName: 'Nirmala UI',
                    fontColor: '#FFFFFF',
                    borders: { color: '#00663A', lineStyle: 'thin' }
                };
            }
        }
    }
</script>
public ActionResult Index()
{
var data = GetPivotData();
ViewBag.DataSource = data;
return View();
}
Changing the Pivot Table style while exporting
The Excel export provides an option to change colors for headers, caption, and records in Pivot Table before exporting. To apply colors, define theme settings in excelExportProperties object and pass it as a parameter to the excelExport method.
By default, material theme is applied to exported Excel document.
<ejs-button id="excel" content="Export To Excel" isPrimary="true"></ejs-button>

<ejs-pivotview id="PivotView" height="300" allowExcelExport="true">
    <e-datasourcesettings dataSource="@ViewBag.DataSource" expandAll="false">
        <e-formatsettings>
            <e-field name="Amount" format="C0" maximumSignificantDigits="10" minimumSignificantDigits="1" useGrouping="true"></e-field>
        </e-formatsettings>
        <e-rows>
            <e-field name="Country"></e-field>
            <e-field name="Products"></e-field>
        </e-rows>
        <e-columns>
            <e-field name="Year" caption="Year"></e-field>
            <e-field name="Quarter"></e-field>
        </e-columns>
        <e-values>
            <e-field name="Sold" caption="Units Sold"></e-field>
            <e-field name="Amount" caption="Sold Amount"></e-field>
        </e-values>
    </e-datasourcesettings>
</ejs-pivotview>

<script>
    var pivotObj;
    document.getElementById('excel').onclick = function () {
        pivotObj = document.getElementById('PivotView').ej2_instances[0];
        var excelExportProperties = {
            theme: {
                header: { fontName: 'Segoe UI', fontColor: '#666666' },
                record: { fontName: 'Segoe UI', fontColor: '#666666' },
                caption: { fontName: 'Segoe UI', fontColor: '#666666' }
            }
        };
        pivotObj.excelExport(excelExportProperties);
    }
</script>
public ActionResult Index()
{
var data = GetPivotData();
ViewBag.DataSource = data;
return View();
}
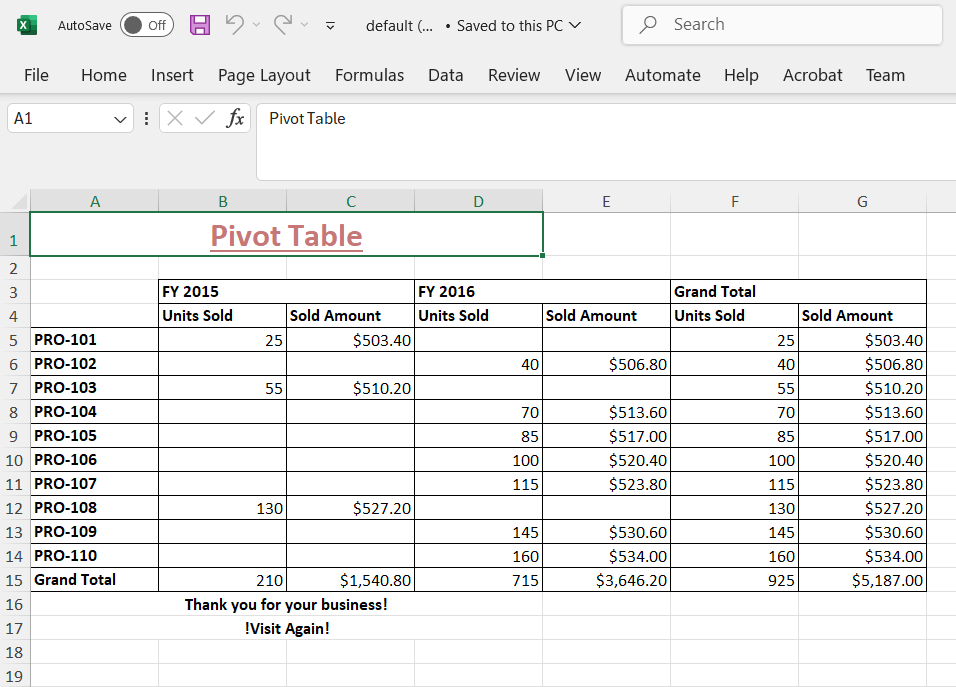
Add header and footer while exporting
The Excel export provides an option to include header and footer content for the Excel document before exporting. To add header and footer, define header and footer properties in excelExportProperties object and pass it as a parameter to the excelExport method.
<ejs-button id="excel" content="Export To Excel" isPrimary="true"></ejs-button>

<ejs-pivotview id="PivotView" height="300" allowExcelExport="true">
    <e-datasourcesettings dataSource="@ViewBag.DataSource" expandAll="false">
        <e-formatsettings>
            <e-field name="Amount" format="C0" maximumSignificantDigits="10" minimumSignificantDigits="1" useGrouping="true"></e-field>
        </e-formatsettings>
        <e-rows>
            <e-field name="Country"></e-field>
            <e-field name="Products"></e-field>
        </e-rows>
        <e-columns>
            <e-field name="Year" caption="Year"></e-field>
            <e-field name="Quarter"></e-field>
        </e-columns>
        <e-values>
            <e-field name="Sold" caption="Units Sold"></e-field>
            <e-field name="Amount" caption="Sold Amount"></e-field>
        </e-values>
    </e-datasourcesettings>
</ejs-pivotview>

<script>
    var pivotObj;
    document.getElementById('excel').onclick = function () {
        pivotObj = document.getElementById('PivotView').ej2_instances[0];
        var excelExportProperties = {
            header: {
                headerRows: 2,
                rows: [
                    { cells: [{ colSpan: 4, value: "Pivot Grid", style: { fontColor: '#C67878', fontSize: 20, hAlign: 'Center', bold: true, underline: true } }] }
                ]
            },
            footer: {
                footerRows: 4,
                rows: [
                    { cells: [{ colSpan: 4, value: "Thank you for your business!", style: { hAlign: 'Center', bold: true } }] },
                    { cells: [{ colSpan: 4, value: "!Visit Again!", style: { hAlign: 'Center', bold: true } }] }
                ]
            }
        };
        pivotObj.excelExport(excelExportProperties);
    }
</script>
public ActionResult Index()
{
var data = GetPivotData();
ViewBag.DataSource = data;
return View();
}
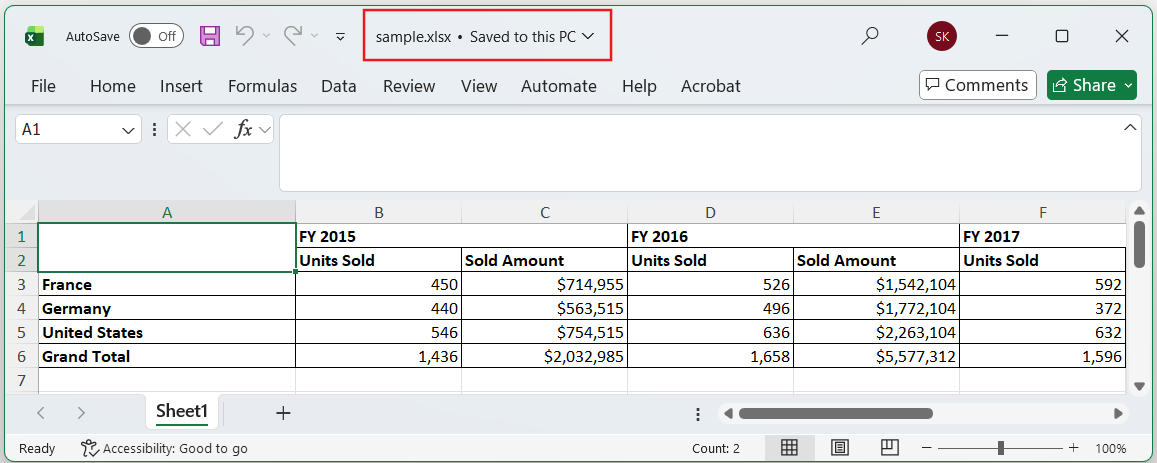
Changing the file name while exporting
This option provides flexibility to specify a custom file name for your exported Excel document, making it easier to organize and identify your exported data files. The Excel export provides an option to change the file name of the document before exporting. To change the file name, define the fileName property in the excelExportProperties object and pass it as a parameter to the excelExport method.
<ejs-button id="excel" content="Export To Excel" isPrimary="true"></ejs-button>

<ejs-pivotview id="PivotView" height="300" allowExcelExport="true">
    <e-datasourcesettings dataSource="@ViewBag.DataSource" expandAll="false">
        <e-formatsettings>
            <e-field name="Amount" format="C0" maximumSignificantDigits="10" minimumSignificantDigits="1" useGrouping="true"></e-field>
        </e-formatsettings>
        <e-rows>
            <e-field name="Country"></e-field>
            <e-field name="Products"></e-field>
        </e-rows>
        <e-columns>
            <e-field name="Year" caption="Year"></e-field>
            <e-field name="Quarter"></e-field>
        </e-columns>
        <e-values>
            <e-field name="Sold" caption="Units Sold"></e-field>
            <e-field name="Amount" caption="Sold Amount"></e-field>
        </e-values>
    </e-datasourcesettings>
</ejs-pivotview>

<script>
    var pivotObj;
    document.getElementById('excel').onclick = function () {
        pivotObj = document.getElementById('PivotView').ej2_instances[0];
        var excelExportProperties = {
            fileName:'sample.xlsx'
        };
        pivotObj.excelExport(excelExportProperties);
    }
</script>
public ActionResult Index()
{
var data = GetPivotData();
ViewBag.DataSource = data;
return View();
}
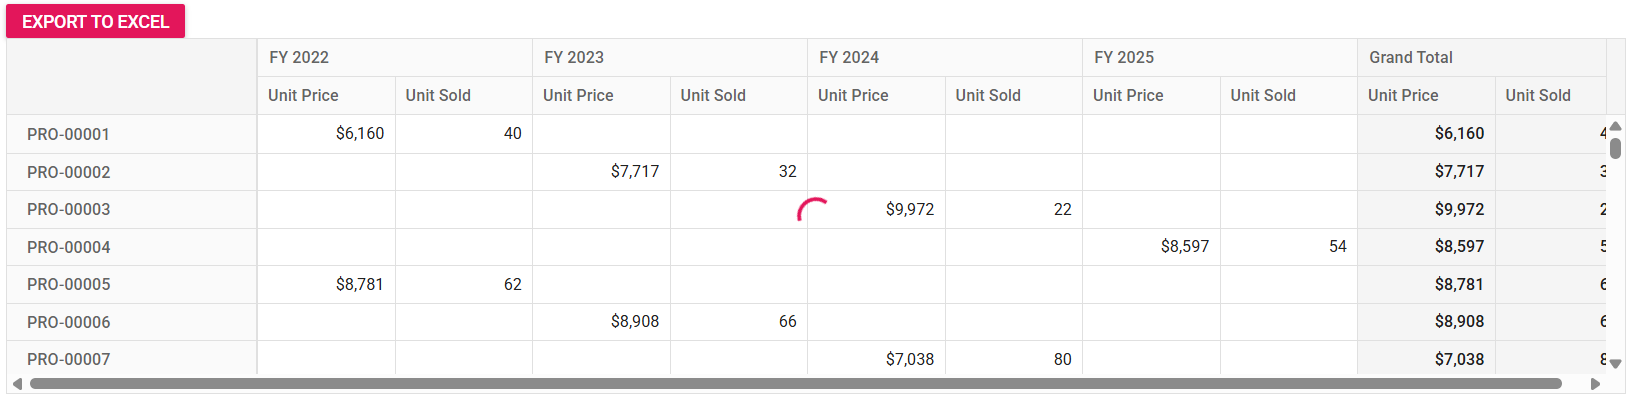
Show spinner during export
When exporting data, displaying a spinner provides visual feedback to end users that the export process is in progress. To show a spinner, invoke the showWaitingPopup method in the button’s click event before calling the export method. After the export is complete, use the exportComplete event to trigger the hideWaitingPopup method, which will hide the spinner and indicate that the export has finished successfully.
<ejs-button id="excel" content="Export To Excel" isPrimary="true"></ejs-button>
<ejs-pivotview id="pivotview" width="100%" height="300" enablevirtualization="true" dataBound="onDataBound" exportComplete="exportComplete" allowExcelExport="true">
    <e-datasourcesettings expandall="true" enablesorting="false">
        <e-formatsettings>
            <e-field name="Price" format="C0"></e-field>
        </e-formatsettings>
        <e-rows>
            <e-field name="ProductID"></e-field>
        </e-rows>
        <e-columns>
            <e-field name="Year"></e-field>
        </e-columns>
        <e-values>
            <e-field name="Price" caption="Unit Price"></e-field>
            <e-field name="Sold" caption="Unit Sold"></e-field>
        </e-values>
    </e-datasourcesettings>
</ejs-pivotview>

<script>
    var pivotObj;
    var customername = [
      'TOM',
      'Hawk',
      'Jon',
      'Chandler',
      'Monica',
      'Rachel',
      'Phoebe',
      'Gunther',
      'Ross',
      'Geller',
      'Joey',
      'Bing',
      'Tribbiani',
      'Janice',
      'Bong',
      'Perk',
      'Green',
      'Ken',
      'Adams',
    ];
    var city = [
      'New York',
      'Los Angeles',
      'Chicago',
      'Houston',
      'Philadelphia',
      'Phoenix',
      'San Antonio',
      'Austin',
      'San Francisco',
      'Columbus',
      'Washington',
      'Portland',
      'Oklahoma',
      'Las Vegas',
      'Virginia',
      'St. Louis',
      'Birmingham',
    ];
    var isInit = true;
    var dt = 0;
    var data = function (count) {
      var result = [];
      for (var i = 1; i < count + 1; i++) {
        dt++;
        var round = void 0;
        var toString_1 = i.toString();
        if (toString_1.length === 1) {
          round = '0000' + i;
        } else if (toString_1.length === 2) {
          round = '000' + i;
        } else if (toString_1.length === 3) {
          round = '00' + i;
        } else if (toString_1.length === 4) {
          round = '0' + i;
        } else {
          round = toString_1;
        }
        result.push({
          ProductID: 'PRO-' + round,
          City: city[Math.round(Math.random() * city.length)] || city[0],
          Year: 'FY ' + (dt + 2021),
          CustomerName:
            customername[Math.round(Math.random() * customername.length)] ||
            customername[0],
          Price: Math.round(Math.random() * 5000) + 5000,
          Sold: Math.round(Math.random() * 80) + 10,
        });
        if (dt / 4 == 1) dt = 0;
      }
      return result;
    };
    function onDataBound(args) {
      var pivotView = document.getElementById('pivotview').ej2_instances[0];
      if(isInit) {
          pivotView.dataSourceSettings.dataSource = data(10000);
      }
      isInit = false;
    }
    document.getElementById('excel').onclick = function () {
      pivotObj = document.getElementById('pivotview').ej2_instances[0];
      pivotObj.showWaitingPopup();
      setTimeout(function () {
        pivotObj.excelExport();
      });
    };
    function exportComplete(args) {
        pivotObj.hideWaitingPopup();
    }
</script>
public ActionResult Index()
{
var data = GetPivotData();
ViewBag.DataSource = data;
return View();
}
Export only the current page
By default, the Pivot Table exports all data records, which can result in larger file sizes when a large data source is assigned to the Pivot Table. To improve performance, export only the data records currently visible in the viewport by setting the exportAllPages property to false.
This option is applicable only when the virtualization or paging feature is enabled.
<ejs-button id="excel" content="Export To Excel" isPrimary="true"></ejs-button>

<ejs-pivotview id="PivotView" height="300" allowExcelExport="true" enableVirtualization="true" exportAllPages="false">
    <e-datasourcesettings dataSource="@ViewBag.DataSource" expandAll="true">
        <e-formatsettings>
            <e-field name="Amount" format="C0" maximumSignificantDigits="10" minimumSignificantDigits="1" useGrouping="true"></e-field>
        </e-formatsettings>
        <e-values>
            <e-field name="Country"></e-field>
            <e-field name="Products"></e-field>
        </e-values>
        <e-columns>
            <e-field name="Year" caption="Year"></e-field>
            <e-field name="Quarter"></e-field>
        </e-columns>
        <e-rows>
            <e-field name="Sold" caption="Units Sold"></e-field>
            <e-field name="Amount" caption="Sold Amount"></e-field>
        </e-rows>
    </e-datasourcesettings>
</ejs-pivotview>

<script>
    var pivotObj;
    document.getElementById('excel').onclick = function () {
        pivotObj = document.getElementById('PivotView').ej2_instances[0];
        pivotObj.excelExport();
    }
</script>
public ActionResult Index()
{
var data = GetPivotData();
ViewBag.DataSource = data;
return View();
}Events
ExcelQueryCellInfo
The excelQueryCellInfo event is triggered during the creation of each row and value cell while exporting data to Excel. This event offers options to change the content and style of individual cells in the exported Excel document, improving the flexibility and appearance of exported reports.
The event provides the following arguments:
-
value– Represents the value of the current cell in the exported Excel sheet. -
column– Provides details about the column to which the current cell belongs. -
data– Contains all data for the row that includes the current cell. -
style– Defines the style settings (such as font, color, borders) applied to the current cell.
<ejs-pivotview id="PivotView" height="300">
    <e-datasourcesettings dataSource="@ViewBag.DataSource" expandAll="false">
        <e-formatsettings>
            <e-field name="Amount" format="C0" maximumSignificantDigits="10" minimumSignificantDigits="1" useGrouping="true"></e-field>
        </e-formatsettings>
        <e-rows>
            <e-field name="Country"></e-field>
            <e-field name="Products"></e-field>
        </e-rows>
        <e-columns>
            <e-field name="Year" caption="Year"></e-field>
            <e-field name="Quarter"></e-field>
        </e-columns>
        <e-values>
            <e-field name="Sold" caption="Units Sold"></e-field>
            <e-field name="Amount" caption="Sold Amount"></e-field>
        </e-values>
    </e-datasourcesettings>
    <e-gridSettings columnWidth=120 excelHeaderCellInfo="excelHeaderCell"></e-gridSettings>
</ejs-pivotview>
<script>
    function excelHeaderCell(args) {

    }
</script>
public ActionResult Index()
{
var data = GetPivotData();
ViewBag.DataSource = data;
return View();
}ExcelHeaderQueryCellInfo
The excelHeaderQueryCellInfo event provides the ability to modify header cell appearance and content during Excel export, ensuring exported documents match specific formatting requirements or business standards. This event triggers while processing each header cell during the Excel export operation. The event contains the following parameters:
-
cell– Contains the current cell information and properties. -
style– Contains the style properties that can be applied to the cell.
<ejs-pivotview id="PivotView" height="300">
    <e-datasourcesettings dataSource="@ViewBag.DataSource" expandAll="false">
        <e-formatsettings>
            <e-field name="Amount" format="C0" maximumSignificantDigits="10" minimumSignificantDigits="1" useGrouping="true"></e-field>
        </e-formatsettings>
        <e-rows>
            <e-field name="Country"></e-field>
            <e-field name="Products"></e-field>
        </e-rows>
        <e-columns>
            <e-field name="Year" caption="Year"></e-field>
            <e-field name="Quarter"></e-field>
        </e-columns>
        <e-values>
            <e-field name="Sold" caption="Units Sold"></e-field>
            <e-field name="Amount" caption="Sold Amount"></e-field>
        </e-values>
    </e-datasourcesettings>
    <e-gridSettings columnWidth=120 excelHeaderCellInfo="excelHeaderCell"></e-gridSettings>
</ejs-pivotview>
<script>
    function excelHeaderCell(args) {

    }
</script>
public ActionResult Index()
{
var data = GetPivotData();
ViewBag.DataSource = data;
return View();
}ExportComplete
The exportComplete event triggers after the Pivot Table data exports to an Excel or CSV document. This event enables acquiring blob stream data for further processing and customization by setting the isBlob parameter to true when calling the excelExport method. The event includes the following parameters:
-
type– Specifies the current export format such as PDF, Excel, or CSV. -
promise– Contains the promise object that resolves with blob data for the exported file.
<ejs-button id="excel" content="Export To Excel" isPrimary="true"></ejs-button>

<ejs-pivotview id="PivotView" height="300" allowExcelExport="true" enableVirtualization="true" exportComplete="exportComplete">
    <e-datasourcesettings dataSource="@ViewBag.DataSource" expandAll="true">
        <e-formatsettings>
            <e-field name="Amount" format="C0" maximumSignificantDigits="10" minimumSignificantDigits="1" useGrouping="true"></e-field>
        </e-formatsettings>
        <e-values>
            <e-field name="Country"></e-field>
            <e-field name="Products"></e-field>
        </e-values>
        <e-columns>
            <e-field name="Year" caption="Year"></e-field>
            <e-field name="Quarter"></e-field>
        </e-columns>
        <e-rows>
            <e-field name="Sold" caption="Units Sold"></e-field>
            <e-field name="Amount" caption="Sold Amount"></e-field>
        </e-rows>
    </e-datasourcesettings>
</ejs-pivotview>

<script>
    var pivotObj;
    document.getElementById('excel').onclick = function () {
        pivotObj = document.getElementById('PivotView').ej2_instances[0];
        pivotObj.excelExport({}, false, null, true);
    }
    function exportComplete(args) {
        if (args.promise !== null) {
            args.promise.then((e: { blobData: Blob }) => {
                console.log(e.blobData);
            });
        }
    }
</script>
public ActionResult Index()
{
var data = GetPivotData();
ViewBag.DataSource = data;
return View();
}Limitation when exporting millions of records to Excel format
Understanding this limitation helps you choose the appropriate export format based on your data size requirements and ensures optimal performance for large datasets. By default, Microsoft Excel supports only 1,048,576 records in an Excel sheet. Therefore, it is not possible to export millions of records to Excel format. You can refer to the documentation link for more details on Microsoft Excel specifications and limits. For large datasets, it is recommended to export the data in CSV (Comma-Separated Values) or other formats that can handle large datasets more efficiently than Excel.