Ranges
20 Dec 20238 minutes to read
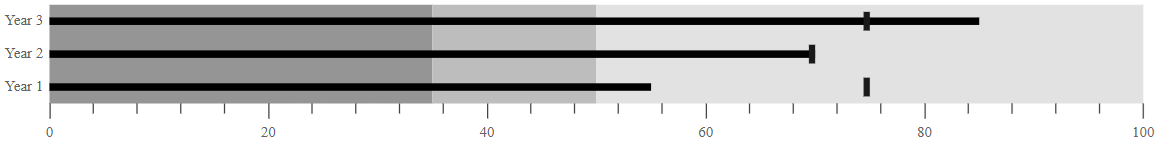
Ranges represent the quality of a specific range such as Good, Bad and Satisfactory in the Bullet Chart scale. The ending point of a qualitative range is specified in the End property in Ranges. The Minimum value of a quantitative scale is considered the starting point of the first range or the previous range end point.
@Html.EJS().BulletChart("container")
                        .Title("Sales Rate")
                        .ValueField("value")
                        .TargetField("target")
                        .CategoryField("category")
                        .CategoryLabelStyle(cl =>
                        {
                            cl.Color("red).Size("13").FontWeight("Bold").Add();
                        })
                        .Ranges(rn =>
                        {
                            rn.End(35).Add();
                            rn.End(50).Add();
                            rn.End(100).Add();
                        })
                        .Minimum(0).Maximum(100).Interval(20)
                        .DataSource(ViewBag.dataSource)
                        .Render()
public IActionResult Index()
{
List<DefaultBulletData> bulletData = new List<DefaultBulletData>
{
new DefaultBulletData { value = 55, target = 75, category = "Year 1"},
new DefaultBulletData { value = 70, target = 70, category = "Year 2"},
new DefaultBulletData { value = 85, target = 75, category = "Year 3"}
};
ViewBag.dataSource = bulletData;
return View();
}
public class DefaultBulletData
{
public double value;
public double target;
public string category;
}
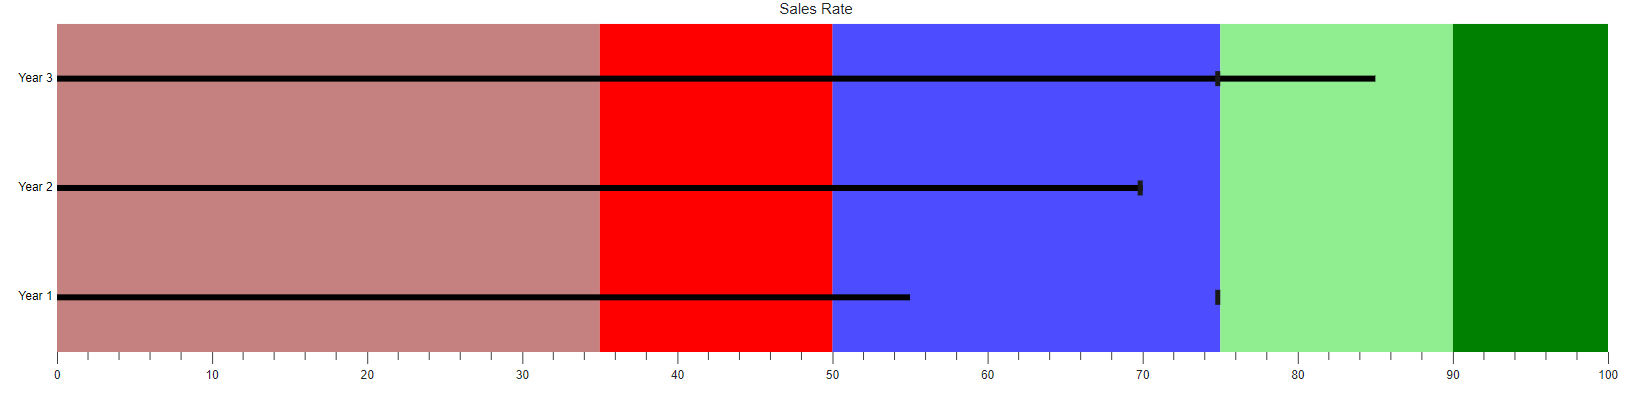
Color customization
Enhance the readability of ranges with color and opacity. It can be applied using the Color and Opacity properties in Ranges.
@Html.EJS().BulletChart("container")
                        .Title("Sales Rate")
                        .ValueField("value")
                        .TargetField("target")
                        .CategoryField("category")
                        .CategoryLabelStyle(cl =>
                        {
                            cl.Color("red).Size("13").FontWeight("Bold").Add();
                        })
                        .Ranges(rn =>
                        {
                            rn.End(35).Opacity(0.5).Color("darkred").Add();
                            rn.End(50).Opacity(1).Color("red").Add();
                            rn.End(75).Opacity(0.7).Color("blue").Add();
                            rn.End(90).Opacity(1).Color("lightgreen").Add();
                            rn.End(100).Opacity(0.8).Color("green").Add();
                        })
                        .Minimum(0).Maximum(100).Interval(20)
                        .DataSource(ViewBag.dataSource)
                        .Render()
public IActionResult Index()
{
List<DefaultBulletData> bulletData = new List<DefaultBulletData>
{
new DefaultBulletData { value = 55, target = 75, category = "Year 1"},
new DefaultBulletData { value = 70, target = 70, category = "Year 2"},
new DefaultBulletData { value = 85, target = 75, category = "Year 3"}
};
ViewBag.dataSource = bulletData;
return View();
}
public class DefaultBulletData
{
public double value;
public double target;
public string category;
}