Title and subtitle
20 Dec 202324 minutes to read
Title
The title of the Bullet Chart displays the information about the data plotted by specifying it in the Title property.
@Html.EJS().BulletChart("container")
                        .Title("Sales Rate")
                        .TargetField("target")
                        .ValueField("value")
                        .Ranges(rn =>
                        {
                            rn.End(35).Add();
                            rn.End(50).Add();
                            rn.End(100).Add();
                        })
                        .Minimum(0).Maximum(100).Interval(20)
                        .DataSource(ViewBag.dataSource)
                        .Render()
public IActionResult Index()
{
List<DefaultBulletData> bulletData = new List<DefaultBulletData>
{
new DefaultBulletData { value = 55, target = 75}
};
ViewBag.dataSource = bulletData;
return View();
}
public class DefaultBulletData
{
public double value;
public double target;
}
Subtitle
To show additional information about the data plotted, the Bullet Chart can also be given a subtitle using the Subtitle property.
@Html.EJS().BulletChart("container")
                        .Title("Sales Rate in dollars")
                        .Subtitle("(in dollars $)")
                        .LabelFormat("${value}")
                        .TargetField("target")
                        .ValueField("value")
                        .Ranges(rn =>
                        {
                            rn.End(35).Add();
                            rn.End(50).Add();
                            rn.End(100).Add();
                        })
                        .Minimum(0).Maximum(100).Interval(20)
                        .DataSource(ViewBag.dataSource)
                        .Render()
public IActionResult Index()
{
List<DefaultBulletData> bulletData = new List<DefaultBulletData>
{
new DefaultBulletData { value = 55, target = 75}
};
ViewBag.dataSource = bulletData;
return View();
}
public class DefaultBulletData
{
public double value;
public double target;
}
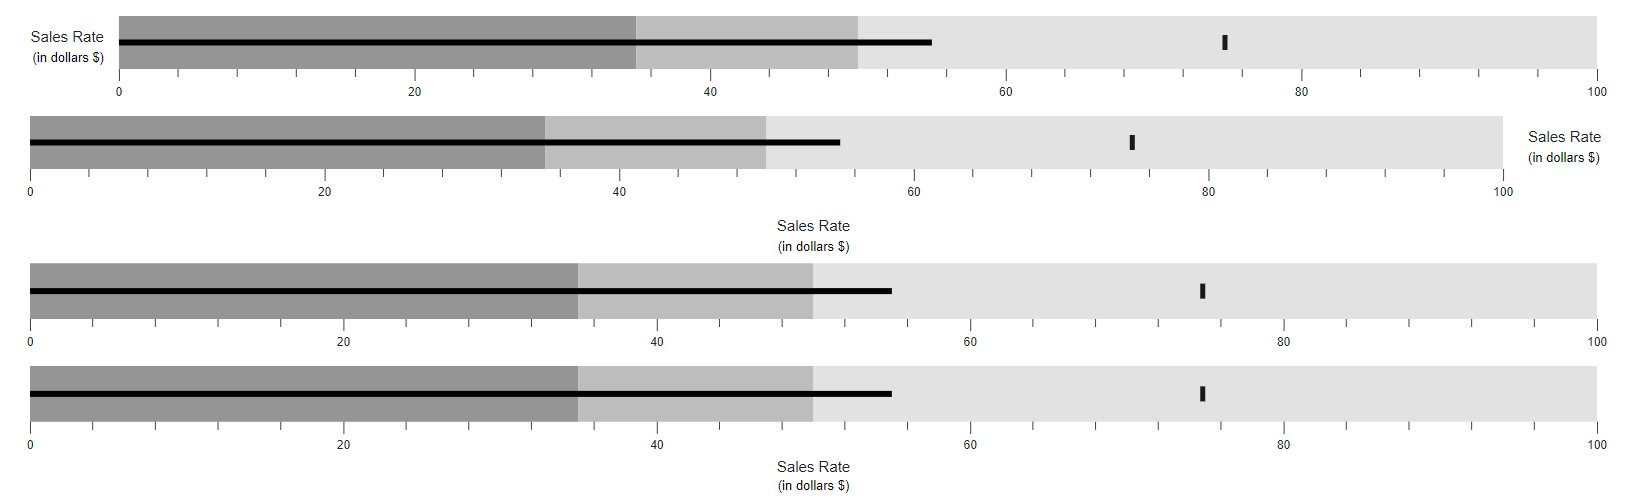
Title and subTitle position
The title and the subtitle positions can be customized using the TitlePosition property. Possible positions are Left, Right, Top, and Bottom.
Position as left
By setting the TitlePosition to Left, you can display the title and subtitle at the left side of the Bullet Chart.
@Html.EJS().BulletChart("container")
                        .Title("Sales Rate in dollars")
                        .Subtitle("(in dollars $)")
                        .LabelFormat("${value}")
                        .TargetField("target")
                        .ValueField("value")
                        .TitlePosition(Syncfusion.EJ2.Charts.TextPosition.Left)
                        .Ranges(rn =>
                        {
                            rn.End(35).Add();
                            rn.End(50).Add();
                            rn.End(100).Add();
                        })
                        .Minimum(0).Maximum(100).Interval(20)
                        .DataSource(ViewBag.dataSource)
                        .Render()
public IActionResult Index()
{
List<DefaultBulletData> bulletData = new List<DefaultBulletData>
{
new DefaultBulletData { value = 55, target = 75}
};
ViewBag.dataSource = bulletData;
return View();
}
public class DefaultBulletData
{
public double value;
public double target;
}Position as right
By setting the TitlePosition to Right, you can display the title and subtitle at the right side of the Bullet Chart.
@Html.EJS().BulletChart("container")
                        .Title("Sales Rate in dollars")
                        .Subtitle("(in dollars $)")
                        .LabelFormat("${value}")
                        .TargetField("target")
                        .ValueField("value")
                        .TitlePosition(Syncfusion.EJ2.Charts.TextPosition.Right)
                        .Ranges(rn =>
                        {
                            rn.End(35).Add();
                            rn.End(50).Add();
                            rn.End(100).Add();
                        })
                        .Minimum(0).Maximum(100).Interval(20)
                        .DataSource(ViewBag.dataSource)
                        .Render()
public IActionResult Index()
{
List<DefaultBulletData> bulletData = new List<DefaultBulletData>
{
new DefaultBulletData { value = 55, target = 75}
};
ViewBag.dataSource = bulletData;
return View();
}
public class DefaultBulletData
{
public double value;
public double target;
}Position as top
By setting the TitlePosition to Top, you can display the title and subtitle at the top of the Bullet Chart. The default title and subtitle positions of the Bullet Chart is Top.
@Html.EJS().BulletChart("container")
                        .Title("Sales Rate in dollars")
                        .Subtitle("(in dollars $)")
                        .LabelFormat("${value}")
                        .TargetField("target")
                        .ValueField("value")
                        .TitlePosition(Syncfusion.EJ2.Charts.TextPosition.Top)
                        .Ranges(rn =>
                        {
                            rn.End(35).Add();
                            rn.End(50).Add();
                            rn.End(100).Add();
                        })
                        .Minimum(0).Maximum(100).Interval(20)
                        .DataSource(ViewBag.dataSource)
                        .Render()
public IActionResult Index()
{
List<DefaultBulletData> bulletData = new List<DefaultBulletData>
{
new DefaultBulletData { value = 55, target = 75}
};
ViewBag.dataSource = bulletData;
return View();
}
public class DefaultBulletData
{
public double value;
public double target;
}Position as bottom
By setting the TitlePosition to Bottom, you can display the title and subtitle at the bottom of the Bullet Chart.
@Html.EJS().BulletChart("container")
                        .Title("Sales Rate in dollars")
                        .Subtitle("(in dollars $)")
                        .LabelFormat("${value}")
                        .TargetField("target")
                        .ValueField("value")
                        .TitlePosition(Syncfusion.EJ2.Charts.TextPosition.Bottom)
                        .Ranges(rn =>
                        {
                            rn.End(35).Add();
                            rn.End(50).Add();
                            rn.End(100).Add();
                        })
                        .Minimum(0).Maximum(100).Interval(20)
                        .DataSource(ViewBag.dataSource)
                        .Render()
public IActionResult Index()
{
List<DefaultBulletData> bulletData = new List<DefaultBulletData>
{
new DefaultBulletData { value = 55, target = 75}
};
ViewBag.dataSource = bulletData;
return View();
}
public class DefaultBulletData
{
public double value;
public double target;
}
Title customization
The title color, opacity, font size, font family, font weight, and font style can be customized using the TitleStyle property.
@Html.EJS().BulletChart("container")
                        .Title("Sales Rate in dollars")
                        .Subtitle("(in dollars $)")
                        .LabelFormat("${value}")
                        .TargetField("target")
                        .ValueField("value")
                        .TitleStyle(ts =>
                        {
                            ts.Size("22px").Color("red").FontFamily("cursive").FontWeight("Bold).Add();
                        })
                        .Ranges(rn =>
                        {
                            rn.End(35).Add();
                            rn.End(50).Add();
                            rn.End(100).Add();
                        })
                        .Minimum(0).Maximum(100).Interval(20)
                        .DataSource(ViewBag.dataSource)
                        .Render()
public IActionResult Index()
{
List<DefaultBulletData> bulletData = new List<DefaultBulletData>
{
new DefaultBulletData { value = 55, target = 75}
};
ViewBag.dataSource = bulletData;
return View();
}
public class DefaultBulletData
{
public double value;
public double target;
}SubTitle customization
The sub-title color, opacity, font size, font family, font weight, and font style can be customized using the SubtitleStyle property.
@Html.EJS().BulletChart("container")
                        .Title("Sales Rate in dollars")
                        .Subtitle("(in dollars $)")
                        .LabelFormat("${value}")
                        .TargetField("target")
                        .ValueField("value")
                        .SubTitleStyle(ts =>
                        {
                            ts.Size("22px").Color("red").FontFamily("cursive").FontWeight("Bold).Add();
                        })
                        .Ranges(rn =>
                        {
                            rn.End(35).Add();
                            rn.End(50).Add();
                            rn.End(100).Add();
                        })
                        .Minimum(0).Maximum(100).Interval(20)
                        .DataSource(ViewBag.dataSource)
                        .Render()
public IActionResult Index()
{
List<DefaultBulletData> bulletData = new List<DefaultBulletData>
{
new DefaultBulletData { value = 55, target = 75}
};
ViewBag.dataSource = bulletData;
return View();
}
public class DefaultBulletData
{
public double value;
public double target;
}