Working with data
20 Dec 20234 minutes to read
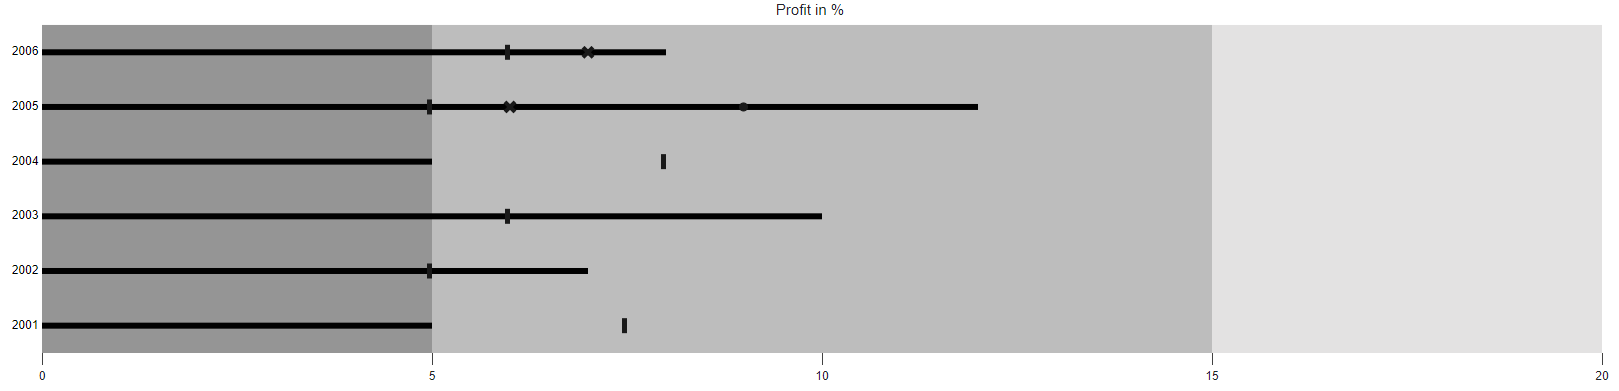
Bullet Chart can visualise data bound from local or remote data.
Local data
You can bind a simple JSON data to the chart using DataSource direct property of the bullet-chart. Now, map the fields in JSON to ValueField and TargetField properties. The DataSource property accepts a collection of values as input that helps to display measures, and compares them to a target bar. To display the actual and target bar, specify the property from the datasource into the ValueField and TargetField respectively.
@Html.EJS().BulletChart("container")
                        .Title("Profit in %")
                        .ValueField("value")
                        .TargetField("comparativeMeasureValue")
                        .CategoryField("category")
                        .Ranges(rn =>
                        {
                            rn.End(5).Add();
                            rn.End(15).Add();
                            rn.End(20).Add();
                        })
                        .Minimum(0).Maximum(20).Interval(5)
                        .DataSource(ViewBag.dataSource)
                        .Render()
public IActionResult Index()
{
List<DefaultBulletData> bulletData = new List<DefaultBulletData>
{
new DefaultBulletData { value = 5, comparativeMeasureValue = 7.5, category= "2001"},
new DefaultBulletData { value = 7, comparativeMeasureValue = 5, category= "2002"},
new DefaultBulletData { value = 10, comparativeMeasureValue = 6, category= "2003"},
new DefaultBulletData { value = 5, comparativeMeasureValue = 8, category= "2004"},
new DefaultBulletData { value = 12, comparativeMeasureValue = 5, category= "2005"},
new DefaultBulletData { value = 8, comparativeMeasureValue = 6, category= "2006"}
};
ViewBag.dataSource = bulletData;
return View();
}
public class DefaultBulletData
{
public double value;
public double comparativeMeasureValue;
public string category;
}