Getting Started with the Vue Pivotview Component in Vue 2

3 Feb 202624 minutes to read

This article provides a step-by-step guide for setting up a Vue 2 project using Vue-CLI and integrating the Syncfusion® Vue Pivotview component

Ready to streamline your Syncfusion® Vue development? Discover the full potential of Syncfusion® Vue components with Syncfusion® AI Coding Assistant. Effortlessly integrate, configure, and enhance your projects with intelligent, context-aware code suggestions, streamlined setups, and real-time insights—all seamlessly integrated into your preferred AI-powered IDEs like VS Code, Cursor, Syncfusion® CodeStudio and more. Explore Syncfusion® AI Coding Assistant

To get started quickly with the Vue Pivot Table, watch this video:

Prerequisites

System requirements for Syncfusion® Vue UI components

Dependencies

Understanding the dependency structure helps you identify the required packages for implementing the Pivot Table component effectively in your Vue application. The Pivot Table component relies on a structured hierarchy of dependencies that provide essential functionality for data processing, user interface elements, and export capabilities.

The following dependency tree shows the required packages for the Vue Pivot Table component:

|-- @syncfusion/ej2-vue-pivotview
    |-- @syncfusion/ej2-base
    |-- @syncfusion/ej2-data
    |-- @syncfusion/ej2-excel-export
        |-- @syncfusion/ej2-file-utils
        |-- @syncfusion/ej2-compression
    |-- @syncfusion/ej2-pdf-export
        |-- @syncfusion/ej2-file-utils
        |-- @syncfusion/ej2-compression
     |-- @syncfusion/ej2-charts
        |-- @syncfusion/ej2-svg-base
    |-- @syncfusion/ej2-inputs
    |-- @syncfusion/ej2-buttons
    |-- @syncfusion/ej2-splitbuttons
    |-- @syncfusion/ej2-dropdowns
    |-- @syncfusion/ej2-lists
    |-- @syncfusion/ej2-popups
    |-- @syncfusion/ej2-navigations
    |-- @syncfusion/ej2-grids

Setting up the Vue 2 project

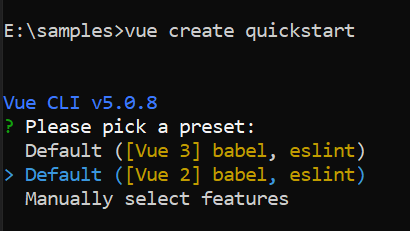
To generate a Vue 2 project using Vue-CLI, use the vue create command. Follow these steps to install Vue CLI and create a new project:

npm install -g @vue/cli
vue create quickstart
cd quickstart
npm run serve

or

yarn global add @vue/cli
vue create quickstart
cd quickstart
yarn run serve

When creating a new project, choose the option Default ([Vue 2] babel, eslint) from the menu.

Vue 2 project

Once the quickstart project is set up with default settings, proceed to add Syncfusion® components to the project.

Add Syncfusion® Vue packages

Syncfusion® packages are available at npmjs.com. To use Vue components, install the required npm package.

This article uses the Vue Pivotview component as an example. Install the @syncfusion/ej2-vue-pivotview package by running the following command:

npm install @syncfusion/ej2-vue-pivotview --save

or

yarn add @syncfusion/ej2-vue-pivotview

The –save will instruct NPM to include the pivot table package inside the dependencies section of the package.json.

Import Syncfusion® CSS styles

The pivot table has different themes. They are:

  • Material
  • Fabric
  • Bootstrap
  • Tailwind3
  • High Contrast

import pivot table component CSS as given below in <style> section of the App.vue file.

<style>
@import "../node_modules/@syncfusion/ej2-base/styles/tailwind3.css";
@import "../node_modules/@syncfusion/ej2-inputs/styles/tailwind3.css";
@import "../node_modules/@syncfusion/ej2-buttons/styles/tailwind3.css";
@import "../node_modules/@syncfusion/ej2-dropdowns/styles/tailwind3.css";
@import "../node_modules/@syncfusion/ej2-lists/styles/tailwind3.css";
@import "../node_modules/@syncfusion/ej2-popups/styles/tailwind3.css";
@import "../node_modules/@syncfusion/ej2-navigations/styles/tailwind3.css";
@import "../node_modules/@syncfusion/ej2-grids/styles/tailwind3.css";
@import "../node_modules/@syncfusion/ej2-pivotview/styles/tailwind3.css";
</style>

Add Syncfusion® Vue component

Follow the below steps to add the Vue Pivotview component:

1. First, import and register the Pivotview component in the script section of the src/App.vue file.

<script setup>
  import { PivotViewComponent, FieldList, GroupingBar, CalculatedField } from "@syncfusion/ej2-vue-pivotview";
</script>
<script>
import { PivotViewComponent } from "@syncfusion/ej2-vue-pivotview";
export default {
  components: {
    'ejs-pivotview': PivotViewComponent
  }
}
</script>

2. In the template section, define the Pivotview component.

<template>
    <div id="app">
        <ejs-pivotview> </ejs-pivotview>
    </div>
</template>

Browser compatibility

Polyfills are required to use the Pivot Table in Internet Explorer 11 browser. Refer the documentation for more details.

Assigning sample data to the pivot table

To enable users to perform meaningful analysis and generate actionable insights, the Pivot Table component requires a well-structured data source. This data source contains the information you want to analyze and visualize.

For demonstration purposes, we’ll use a collection of objects containing sales details for various products across different periods and regions. This sample data is assigned to the Pivot Table component through the dataSource property under the dataSourceSettings configuration. For more details on relational data binding, refer here.

Here’s the complete code to initialize the Pivot Table with sample data:

<template>
    <div id="app">
        <ejs-pivotview :dataSourceSettings="dataSourceSettings"> </ejs-pivotview>
    </div>
</template>

<script>
import { PivotViewComponent } from "@syncfusion/ej2-vue-pivotview";

export default {
  components: {
    'ejs-pivotview': PivotViewComponent
  },
  data () {
    return {
      dataSourceSettings: {
        dataSource: [
            {
                "balance": 2430.87,
                "quantity": 11,
                "name": "Skinner Ward",
                "gender": "male",
                "company": "GROK",
                "state": "New Jercy"
            },
            {
                "balance": 3192.7,
                "quantity": 15,
                "name": "Gwen Dixon",
                "gender": "female",
                "company": "ICOLOGY",
                "state": "Vetaikan"
            },
            {
                "balance": 1663.84,
                "quantity": 14,
                "name": "Deena Gillespie",
                "gender": "female",
                "company": "OVERPLEX",
                "state": "New Jercy"
            }
        ]
      }
    }
  }
}
</script>
<style>
@import "../node_modules/@syncfusion/ej2-base/styles/tailwind3.css";
@import "../node_modules/@syncfusion/ej2-inputs/styles/tailwind3.css";
@import "../node_modules/@syncfusion/ej2-buttons/styles/tailwind3.css";
@import "../node_modules/@syncfusion/ej2-dropdowns/styles/tailwind3.css";
@import "../node_modules/@syncfusion/ej2-lists/styles/tailwind3.css";
@import "../node_modules/@syncfusion/ej2-popups/styles/tailwind3.css";
@import "../node_modules/@syncfusion/ej2-navigations/styles/tailwind3.css";
@import "../node_modules/@syncfusion/ej2-grids/styles/tailwind3.css";
@import "../node_modules/@syncfusion/ej2-pivotview/styles/tailwind3.css";
</style>

Adding fields to row, column, value and filter axes

Organizing fields into appropriate axes transforms raw data into a structured, meaningful Pivot Table that enables users to analyze patterns and trends effectively. With the Pivot Table now initialized and populated with sample data, the next logical step involves organizing the appropriate fields into row, column, value, and filter axes to create a functional data analysis tool.

In the dataSourceSettings configuration, four primary axes play a crucial role in defining and organizing fields from the bound data source to render the Pivot Table component in the desired format.

Understanding the four axes:

  • rows – Collection of fields that will be displayed along the row axis of the Pivot Table.
  • columns – Collection of fields that will be displayed along the column axis of the Pivot Table.
  • values – Collection of fields that will be displayed as aggregated numeric values within the Pivot Table.
  • filters – Collection of fields that act as master filters over the data bound to the row, column, and value axes of the Pivot Table.

Essential field properties:

To define each field in its respective axis, configure the following basic properties:

  • name: Sets the field name from the bound data source. The casing must match exactly as it appears in the data source, otherwise the Pivot Table will not render correctly.
  • caption: Sets the field caption, which serves as the display name for the field in the Pivot Table.
  • type: Sets the summary type for the field. By default, the Sum aggregation is applied.

In this example, “Date” and “Product” are positioned in the column axis, “Country” and “State” are placed in the row axis, and “Sold” and “Quantity” are configured as values respectively.

<template>
  <div id="app">
    <ejs-pivotview :dataSourceSettings="dataSourceSettings" :height="height"> </ejs-pivotview>
  </div>
</template>
<script setup>
import { PivotViewComponent as EjsPivotview } from "@syncfusion/ej2-vue-pivotview";
import { pivotData } from './pivotData.js';

const dataSourceSettings = {
  dataSource: pivotData,
  expandAll: false,
  columns: [{ name: 'Year', caption: 'Production Year' }, { name: 'Quarter' }],
  values: [{ name: 'Sold', caption: 'Units Sold' }, { name: 'Amount', caption: 'Sold Amount' }],
  rows: [{ name: 'Country' }, { name: 'Products' }],
  filters: []
};
const height = 350;
</script>
<style>
@import "../node_modules/@syncfusion/ej2-base/styles/tailwind3.css";
@import "../node_modules/@syncfusion/ej2-inputs/styles/tailwind3.css";
@import "../node_modules/@syncfusion/ej2-buttons/styles/tailwind3.css";
@import "../node_modules/@syncfusion/ej2-dropdowns/styles/tailwind3.css";
@import "../node_modules/@syncfusion/ej2-lists/styles/tailwind3.css";
@import "../node_modules/@syncfusion/ej2-popups/styles/tailwind3.css";
@import "../node_modules/@syncfusion/ej2-navigations/styles/tailwind3.css";
@import "../node_modules/@syncfusion/ej2-grids/styles/tailwind3.css";
@import "../node_modules/@syncfusion/ej2-pivotview/styles/tailwind3.css";
</style>
<template>
  <div id="app">
    <ejs-pivotview :dataSourceSettings="dataSourceSettings" :height="height"> </ejs-pivotview>
  </div>
</template>
<script>
import { PivotViewComponent } from "@syncfusion/ej2-vue-pivotview";
import { pivotData } from './pivotData.js';

export default {
  name: "App",
  components: {
    "ejs-pivotview": PivotViewComponent
  },
  data() {
    return {
      dataSourceSettings: {
        dataSource: pivotData,
        expandAll: false,
        columns: [{ name: 'Year', caption: 'Production Year' }, { name: 'Quarter' }],
        values: [{ name: 'Sold', caption: 'Units Sold' }, { name: 'Amount', caption: 'Sold Amount' }],
        rows: [{ name: 'Country' }, { name: 'Products' }],
        filters: []
      },
      height: 350
    }
  }
}
</script>
<style>
@import "../node_modules/@syncfusion/ej2-base/styles/tailwind3.css";
@import "../node_modules/@syncfusion/ej2-inputs/styles/tailwind3.css";
@import "../node_modules/@syncfusion/ej2-buttons/styles/tailwind3.css";
@import "../node_modules/@syncfusion/ej2-dropdowns/styles/tailwind3.css";
@import "../node_modules/@syncfusion/ej2-lists/styles/tailwind3.css";
@import "../node_modules/@syncfusion/ej2-popups/styles/tailwind3.css";
@import "../node_modules/@syncfusion/ej2-navigations/styles/tailwind3.css";
@import "../node_modules/@syncfusion/ej2-grids/styles/tailwind3.css";
@import "../node_modules/@syncfusion/ej2-pivotview/styles/tailwind3.css";
</style>

Applying formatting to a value field

Formatting enhances the readability and presentation of numerical data in a Pivot Table, making it more user-friendly and professional. For instance, you can display values with currency symbols or control the number of decimal places for better clarity.

To apply formatting to value fields in the Pivot Table, use the formatSetting property. This property accepts an array of format objects, where each object defines formatting rules for a specific field in your data.

Within each format object in the formatSetting array, set the name property to match the exact field name from your value section. Then, specify the desired display format using the format property. In the example below, the Amount field is configured to display values in currency format using the “C0” pattern, which shows currency symbols without decimal places.

Note: Formatting can only be applied to numeric fields in the value section of the Pivot Table.

<template>
  <div id="app">
    <ejs-pivotview :dataSourceSettings="dataSourceSettings" :height="height"> </ejs-pivotview>
  </div>
</template>
<script setup>
import { PivotViewComponent as EjsPivotview } from "@syncfusion/ej2-vue-pivotview";
import { pivotData } from './pivotData.js';

const dataSourceSettings = {
  dataSource: pivotData,
  expandAll: false,
  columns: [{ name: 'Year', caption: 'Production Year' }, { name: 'Quarter' }],
  values: [{ name: 'Sold', caption: 'Units Sold' }, { name: 'Amount', caption: 'Sold Amount' }],
  rows: [{ name: 'Country' }, { name: 'Products' }],
  formatSettings: [{ name: 'Amount', format: 'C0' }],
  filters: []
};
const height = 350;
</script>
<style>
@import "../node_modules/@syncfusion/ej2-base/styles/tailwind3.css";
@import "../node_modules/@syncfusion/ej2-inputs/styles/tailwind3.css";
@import "../node_modules/@syncfusion/ej2-buttons/styles/tailwind3.css";
@import "../node_modules/@syncfusion/ej2-dropdowns/styles/tailwind3.css";
@import "../node_modules/@syncfusion/ej2-lists/styles/tailwind3.css";
@import "../node_modules/@syncfusion/ej2-popups/styles/tailwind3.css";
@import "../node_modules/@syncfusion/ej2-navigations/styles/tailwind3.css";
@import "../node_modules/@syncfusion/ej2-grids/styles/tailwind3.css";
@import "../node_modules/@syncfusion/ej2-pivotview/styles/tailwind3.css";
</style>
<template>
  <div id="app">
    <ejs-pivotview :dataSourceSettings="dataSourceSettings" :height="height"> </ejs-pivotview>
  </div>
</template>
<script>
import { PivotViewComponent } from "@syncfusion/ej2-vue-pivotview";
import { pivotData } from './pivotData.js';

export default {
  name: "App",
  components: {
    "ejs-pivotview": PivotViewComponent
  },
  data() {
    return {
      dataSourceSettings: {
        dataSource: pivotData,
        expandAll: false,
        columns: [{ name: 'Year', caption: 'Production Year' }, { name: 'Quarter' }],
        values: [{ name: 'Sold', caption: 'Units Sold' }, { name: 'Amount', caption: 'Sold Amount' }],
        rows: [{ name: 'Country' }, { name: 'Products' }],
        formatSettings: [{ name: 'Amount', format: 'C0' }],
        filters: []
      },
      height: 350
    }
  }
}
</script>
<style>
@import "../node_modules/@syncfusion/ej2-base/styles/tailwind3.css";
@import "../node_modules/@syncfusion/ej2-inputs/styles/tailwind3.css";
@import "../node_modules/@syncfusion/ej2-buttons/styles/tailwind3.css";
@import "../node_modules/@syncfusion/ej2-dropdowns/styles/tailwind3.css";
@import "../node_modules/@syncfusion/ej2-lists/styles/tailwind3.css";
@import "../node_modules/@syncfusion/ej2-popups/styles/tailwind3.css";
@import "../node_modules/@syncfusion/ej2-navigations/styles/tailwind3.css";
@import "../node_modules/@syncfusion/ej2-grids/styles/tailwind3.css";
@import "../node_modules/@syncfusion/ej2-pivotview/styles/tailwind3.css";
</style>

This approach allows you to apply different formatting patterns to multiple value fields by adding additional objects to the formatSettings array. Each object in the array can target a different field, providing complete control over how numerical data is displayed in the Pivot Table.

Module injection

Module injection enhances the Pivot Table by enabling additional functionality through specialized modules. To incorporate specific features into your Pivot Table, inject the required modules into your Vue application.

The following modules are available to extend the basic Pivot Table functionality:

  • GroupingBar - Inject this module to enable the grouping bar, which allows users to drag and drop fields between different axes of the Pivot Table.
  • FieldList - Inject this module to enable the field list, providing an interactive interface for users to add, remove, and rearrange fields dynamically.
  • CalculatedField - Inject this module to enable calculated fields, allowing users to create custom formulas and expressions for data analysis.

Register the required array of modules under the key pivotview in the provide section within the App.vue file as shown below. On doing so, only the injected views will be loaded and displayed along with pivot table.

<script>
provide: {
        pivotview: [GroupingBar, FieldList, CalculatedField]
    }
</script>

Note: Only inject the modules that you plan to use in your application. This approach helps maintain optimal bundle size and application performance.

Enable Pivot Field List

The field list enhances user interaction by allowing you to dynamically add, remove, and rearrange fields across different axes including column, row, value, and filter axes. This user-friendly interface also provides sorting and filtering options that can be applied at runtime without requiring code changes.

To enable the field list, set the showFieldList property to true and inject the FieldList module into your component. This combination activates the field list interface, making it accessible to users to modify PivotTable report settings. For comprehensive details about field list functionality, refer to the dedicated field list documentation.

The FieldList module must be injected for the field list to render properly with the Pivot Table component. Without this module, the field list will not be available.

<template>
  <div id="app">
    <ejs-pivotview :dataSourceSettings="dataSourceSettings" :height="height" :showFieldList="showFieldList">
    </ejs-pivotview>
  </div>
</template>
<script setup>
import { provide } from "vue";
import { PivotViewComponent as EjsPivotview, FieldList } from "@syncfusion/ej2-vue-pivotview";
import { pivotData } from './pivotData.js';

const dataSourceSettings = {
  dataSource: pivotData,
  expandAll: false,
  drilledMembers: [{ name: 'Country', items: ['France'] }],
  columns: [{ name: 'Year', caption: 'Production Year' }, { name: 'Quarter' }],
  values: [{ name: 'Sold', caption: 'Units Sold' }, { name: 'Amount', caption: 'Sold Amount' }],
  rows: [{ name: 'Country' }, { name: 'Products' }],
  formatSettings: [{ name: 'Amount', format: 'C0' }],
  filters: []
};
const height = 350;
const showFieldList = true;

provide('pivotview', [FieldList]);

</script>
<style>
@import "../node_modules/@syncfusion/ej2-base/styles/tailwind3.css";
@import "../node_modules/@syncfusion/ej2-inputs/styles/tailwind3.css";
@import "../node_modules/@syncfusion/ej2-buttons/styles/tailwind3.css";
@import "../node_modules/@syncfusion/ej2-dropdowns/styles/tailwind3.css";
@import "../node_modules/@syncfusion/ej2-lists/styles/tailwind3.css";
@import "../node_modules/@syncfusion/ej2-popups/styles/tailwind3.css";
@import "../node_modules/@syncfusion/ej2-navigations/styles/tailwind3.css";
@import "../node_modules/@syncfusion/ej2-grids/styles/tailwind3.css";
@import "../node_modules/@syncfusion/ej2-pivotview/styles/tailwind3.css";
</style>
<template>
  <div id="app">
    <ejs-pivotview :dataSourceSettings="dataSourceSettings" :height="height" :showFieldList="showFieldList">
    </ejs-pivotview>
  </div>
</template>
<script>
import { PivotViewComponent, FieldList } from "@syncfusion/ej2-vue-pivotview";
import { pivotData } from './pivotData.js';

export default {
  name: "App",
  components: {
    "ejs-pivotview": PivotViewComponent
  },
  data() {
    return {
      dataSourceSettings: {
        dataSource: pivotData,
        expandAll: false,
        drilledMembers: [{ name: 'Country', items: ['France'] }],
        columns: [{ name: 'Year', caption: 'Production Year' }, { name: 'Quarter' }],
        values: [{ name: 'Sold', caption: 'Units Sold' }, { name: 'Amount', caption: 'Sold Amount' }],
        rows: [{ name: 'Country' }, { name: 'Products' }],
        formatSettings: [{ name: 'Amount', format: 'C0' }],
        filters: []
      },
      height: 350,
      showFieldList: true
    }
  },
  provide: {
    pivotview: [FieldList]
  }
}
</script>
<style>
@import "../node_modules/@syncfusion/ej2-base/styles/tailwind3.css";
@import "../node_modules/@syncfusion/ej2-inputs/styles/tailwind3.css";
@import "../node_modules/@syncfusion/ej2-buttons/styles/tailwind3.css";
@import "../node_modules/@syncfusion/ej2-dropdowns/styles/tailwind3.css";
@import "../node_modules/@syncfusion/ej2-lists/styles/tailwind3.css";
@import "../node_modules/@syncfusion/ej2-popups/styles/tailwind3.css";
@import "../node_modules/@syncfusion/ej2-navigations/styles/tailwind3.css";
@import "../node_modules/@syncfusion/ej2-grids/styles/tailwind3.css";
@import "../node_modules/@syncfusion/ej2-pivotview/styles/tailwind3.css";
</style>

Enable Grouping Bar

The grouping bar allows users to easily manage and modify the report settings of the Pivot Table directly through the user interface. With the grouping bar, users can instantly move fields between columns, rows, values, and filters by dragging them, allowing for quick arrangement and analysis of the data.

Users can also use the grouping bar to sort, filter, or remove fields quickly without needing to write any code. To enable the grouping bar, set the showGroupingBar property to true, and make sure to inject the GroupingBar module in your application. For more details about using the grouping bar, see the Grouping Bar documentation.

The GroupingBar module must be injected for the grouping bar to render properly with the Pivot Table component. Without this module, the grouping bar will not be available.

<template>
  <div id="app">
    <ejs-pivotview :dataSourceSettings="dataSourceSettings" :height="height" :showGroupingBar="showGroupingBar">
    </ejs-pivotview>
  </div>
</template>
<script setup>
import { provide } from "vue";
import { PivotViewComponent as EjsPivotview, GroupingBar } from "@syncfusion/ej2-vue-pivotview";
import { pivotData } from './pivotData.js';

const dataSourceSettings = {
  dataSource: pivotData,
  expandAll: false,
  columns: [{ name: 'Year', caption: 'Production Year' }, { name: 'Quarter' }],
  values: [{ name: 'Sold', caption: 'Units Sold' }, { name: 'Amount', caption: 'Sold Amount' }],
  rows: [{ name: 'Country' }, { name: 'Products' }],
  formatSettings: [{ name: 'Amount', format: 'C0' }],
  filters: []
};
const height = 350;
const showGroupingBar = true;

provide('pivotview', [GroupingBar]);

</script>
<style>
@import "../node_modules/@syncfusion/ej2-base/styles/tailwind3.css";
@import "../node_modules/@syncfusion/ej2-inputs/styles/tailwind3.css";
@import "../node_modules/@syncfusion/ej2-buttons/styles/tailwind3.css";
@import "../node_modules/@syncfusion/ej2-dropdowns/styles/tailwind3.css";
@import "../node_modules/@syncfusion/ej2-lists/styles/tailwind3.css";
@import "../node_modules/@syncfusion/ej2-popups/styles/tailwind3.css";
@import "../node_modules/@syncfusion/ej2-navigations/styles/tailwind3.css";
@import "../node_modules/@syncfusion/ej2-grids/styles/tailwind3.css";
@import "../node_modules/@syncfusion/ej2-pivotview/styles/tailwind3.css";
</style>
<template>
  <div id="app">
    <ejs-pivotview :dataSourceSettings="dataSourceSettings" :height="height" :showGroupingBar="showGroupingBar">
    </ejs-pivotview>
  </div>
</template>
<script>
import { PivotViewComponent, GroupingBar } from "@syncfusion/ej2-vue-pivotview";
import { pivotData } from './pivotData.js';

export default {
  name: "App",
  components: {
    "ejs-pivotview": PivotViewComponent
  },
  data() {
    return {
      dataSourceSettings: {
        dataSource: pivotData,
        expandAll: false,
        columns: [{ name: 'Year', caption: 'Production Year' }, { name: 'Quarter' }],
        values: [{ name: 'Sold', caption: 'Units Sold' }, { name: 'Amount', caption: 'Sold Amount' }],
        rows: [{ name: 'Country' }, { name: 'Products' }],
        formatSettings: [{ name: 'Amount', format: 'C0' }],
        filters: []
      },
      height: 350,
      showGroupingBar: true
    }
  },
  provide: {
    pivotview: [GroupingBar]
  }
}
</script>
<style>
@import "../node_modules/@syncfusion/ej2-base/styles/tailwind3.css";
@import "../node_modules/@syncfusion/ej2-inputs/styles/tailwind3.css";
@import "../node_modules/@syncfusion/ej2-buttons/styles/tailwind3.css";
@import "../node_modules/@syncfusion/ej2-dropdowns/styles/tailwind3.css";
@import "../node_modules/@syncfusion/ej2-lists/styles/tailwind3.css";
@import "../node_modules/@syncfusion/ej2-popups/styles/tailwind3.css";
@import "../node_modules/@syncfusion/ej2-navigations/styles/tailwind3.css";
@import "../node_modules/@syncfusion/ej2-grids/styles/tailwind3.css";
@import "../node_modules/@syncfusion/ej2-pivotview/styles/tailwind3.css";
</style>

Exploring Filter Axis

The filter axis helps users display only the most relevant information in the Pivot Table for easier analysis. Users can add fields to the filter axis, which act as a master filter over the data displayed in the rows, columns, and values axes. You can set these fields and their filter items in two ways: by configuring them in your dataSourceSettings through code, or by simply dragging and dropping fields from other axes to the filter axis using the grouping bar or the field list at runtime. This makes it easier to analyze targeted subsets of data without modifying the underlying structure of the Pivot Table.

The following example shows how to add fields to the filter axis in a Vue Pivot Table:

<template>
  <div id="app">
    <ejs-pivotview :dataSourceSettings="dataSourceSettings" :height="height" :showGroupingBar="showGroupingBar">
    </ejs-pivotview>
  </div>
</template>
<script setup>
import { provide } from "vue";
import { PivotViewComponent as EjsPivotview, GroupingBar } from "@syncfusion/ej2-vue-pivotview";
import { pivotData } from './pivotData.js';

const dataSourceSettings = {
  dataSource: pivotData,
  expandAll: false,
  columns: [{ name: 'Year', caption: 'Production Year' }, { name: 'Quarter' }],
  values: [{ name: 'Sold', caption: 'Units Sold' }, { name: 'Amount', caption: 'Sold Amount' }],
  rows: [{ name: 'Products' }],
  formatSettings: [{ name: 'Amount', format: 'C0' }],
  filters: [{ name: 'Country' }]
};
const height = 350;
const showGroupingBar = true;

provide('pivotview', [GroupingBar]);

</script>
<style>
@import "../node_modules/@syncfusion/ej2-base/styles/tailwind3.css";
@import "../node_modules/@syncfusion/ej2-inputs/styles/tailwind3.css";
@import "../node_modules/@syncfusion/ej2-buttons/styles/tailwind3.css";
@import "../node_modules/@syncfusion/ej2-dropdowns/styles/tailwind3.css";
@import "../node_modules/@syncfusion/ej2-lists/styles/tailwind3.css";
@import "../node_modules/@syncfusion/ej2-popups/styles/tailwind3.css";
@import "../node_modules/@syncfusion/ej2-navigations/styles/tailwind3.css";
@import "../node_modules/@syncfusion/ej2-grids/styles/tailwind3.css";
@import "../node_modules/@syncfusion/ej2-pivotview/styles/tailwind3.css";
</style>
<template>
  <div id="app">
    <ejs-pivotview :dataSourceSettings="dataSourceSettings" :height="height" :showGroupingBar="showGroupingBar">
    </ejs-pivotview>
  </div>
</template>
<script>
import { PivotViewComponent, GroupingBar } from "@syncfusion/ej2-vue-pivotview";
import { pivotData } from './pivotData.js';

export default {
  name: "App",
  components: {
    "ejs-pivotview": PivotViewComponent
  },
  data() {
    return {
      dataSourceSettings: {
        dataSource: pivotData,
        expandAll: false,
        columns: [{ name: 'Year', caption: 'Production Year' }, { name: 'Quarter' }],
        values: [{ name: 'Sold', caption: 'Units Sold' }, { name: 'Amount', caption: 'Sold Amount' }],
        rows: [{ name: 'Products' }],
        formatSettings: [{ name: 'Amount', format: 'C0' }],
        filters: [{ name: 'Country' }]
      },
      height: 350,
      showGroupingBar: true
    }
  },
  provide: {
    pivotview: [GroupingBar]
  }
}
</script>
<style>
@import "../node_modules/@syncfusion/ej2-base/styles/tailwind3.css";
@import "../node_modules/@syncfusion/ej2-inputs/styles/tailwind3.css";
@import "../node_modules/@syncfusion/ej2-buttons/styles/tailwind3.css";
@import "../node_modules/@syncfusion/ej2-dropdowns/styles/tailwind3.css";
@import "../node_modules/@syncfusion/ej2-lists/styles/tailwind3.css";
@import "../node_modules/@syncfusion/ej2-popups/styles/tailwind3.css";
@import "../node_modules/@syncfusion/ej2-navigations/styles/tailwind3.css";
@import "../node_modules/@syncfusion/ej2-grids/styles/tailwind3.css";
@import "../node_modules/@syncfusion/ej2-pivotview/styles/tailwind3.css";
</style>

Calculated field

The calculated field feature enables users to create custom value fields using mathematical formulas and existing fields from their data source. Users can perform complex calculations with basic arithmetic operators and seamlessly integrate these custom fields into their pivot table for enhanced data visualization and reporting.

Users can add calculated fields in two ways:

  • Using code: Set up calculated fields through the calculatedFieldSettings property when configuring the Pivot Table.
  • Using the user interface: Alternatively, calculated fields can be added at runtime through a built-in dialog by setting the allowCalculatedField property to true and by injecting the CalculatedField module. When enabled, a button appears in the Field List UI. Clicking this button opens a dialog that allows users to create, edit, or remove calculated fields at runtime. To learn more about calculated fields, refer here.

To use the calculated field dialog, make sure the CalculatedField module is injected. If it is not injected, the popup dialog will not be shown with the Pivot Table.

By default, calculated fields created through code-behind are only added to the field list and calculated field dialog UI. To display a calculated field in the Pivot Table UI, you must add it to the values property, as shown in the code below. Additionally, calculated fields can only be added to the value axis.

Below is a sample code that shows how to set up calculated fields both through code-behind and using the popup dialog:

<template>
  <div id="app">
    <ejs-button id="calculated-field-btn" :isPrimary="isPrimary" v-on:click="btnClick">Calculated Field</ejs-button>
    <ejs-pivotview id="pivotview" :height="height" :dataSourceSettings="dataSourceSettings"
      :allowCalculatedField="allowCalculatedField"> </ejs-pivotview>
  </div>
</template>
<script setup>
import { provide } from "vue";
import { PivotViewComponent as EjsPivotview, CalculatedField } from "@syncfusion/ej2-vue-pivotview";
import { ButtonComponent as EjsButton } from "@syncfusion/ej2-vue-buttons";
import { pivotData } from './pivotData.js';

const dataSourceSettings = {
  dataSource: pivotData,
  expandAll: false,
  enableSorting: true,
  drilledMembers: [{ name: 'Country', items: ['France'] }],
  columns: [{ name: 'Year', caption: 'Production Year' }, { name: 'Quarter' }],
  values: [{ name: 'Sold', caption: 'Units Sold' }, { name: 'Amount', caption: 'Sold Amount' }, { name: 'Total', caption: 'Total Amount', type: 'CalculatedField' }],
  rows: [{ name: 'Country' }, { name: 'Products' }],
  formatSettings: [{ name: 'Amount', format: 'C0' }],
  filters: [],
  calculatedFieldSettings: [{ name: 'Total', formula: '"Sum(Amount)"+"Sum(Sold)"' }]
};
const height = 320;
const allowCalculatedField = true;
const isPrimary = true;

const btnClick = () => {
  let pivotGridObj = document.getElementById('pivotview').ej2_instances[0];
  pivotGridObj.calculatedFieldModule.createCalculatedFieldDialog();
};

provide('pivotview', [CalculatedField]);

</script>
<style>
@import "../node_modules/@syncfusion/ej2-base/styles/tailwind3.css";
@import "../node_modules/@syncfusion/ej2-inputs/styles/tailwind3.css";
@import "../node_modules/@syncfusion/ej2-buttons/styles/tailwind3.css";
@import "../node_modules/@syncfusion/ej2-dropdowns/styles/tailwind3.css";
@import "../node_modules/@syncfusion/ej2-lists/styles/tailwind3.css";
@import "../node_modules/@syncfusion/ej2-popups/styles/tailwind3.css";
@import "../node_modules/@syncfusion/ej2-navigations/styles/tailwind3.css";
@import "../node_modules/@syncfusion/ej2-grids/styles/tailwind3.css";
@import "../node_modules/@syncfusion/ej2-pivotview/styles/tailwind3.css";
</style>
<template>
  <div id="app">
    <ejs-button id="calculated-field-btn" :isPrimary="isPrimary" v-on:click="btnClick">Calculated Field</ejs-button>
    <ejs-pivotview id="pivotview" :height="height" :dataSourceSettings="dataSourceSettings"
      :allowCalculatedField="allowCalculatedField"> </ejs-pivotview>
  </div>
</template>

<script>
import { PivotViewComponent, CalculatedField } from "@syncfusion/ej2-vue-pivotview";
import { ButtonComponent } from "@syncfusion/ej2-vue-buttons";
import { pivotData } from './pivotData.js';

export default {
  name: "App",
  components: {
    "ejs-button": ButtonComponent,
    "ejs-pivotview": PivotViewComponent
  },
  data() {
    return {
      dataSourceSettings: {
        dataSource: pivotData,
        expandAll: false,
        enableSorting: true,
        drilledMembers: [{ name: 'Country', items: ['France'] }],
        columns: [{ name: 'Year', caption: 'Production Year' }, { name: 'Quarter' }],
        values: [{ name: 'Sold', caption: 'Units Sold' }, { name: 'Amount', caption: 'Sold Amount' }, { name: 'Total', caption: 'Total Amount', type: 'CalculatedField' }],
        rows: [{ name: 'Country' }, { name: 'Products' }],
        formatSettings: [{ name: 'Amount', format: 'C0' }],
        filters: [],
        calculatedFieldSettings: [{ name: 'Total', formula: '"Sum(Amount)"+"Sum(Sold)"' }]
      },
      height: 320,
      allowCalculatedField: true,
      isPrimary: true
    }
  },
  methods: {
    btnClick: function () {
      let pivotGridObj = document.getElementById('pivotview').ej2_instances[0];
      pivotGridObj.calculatedFieldModule.createCalculatedFieldDialog();
    }
  },
  provide: {
    pivotview: [CalculatedField]
  }
}
</script>
<style>
@import "../node_modules/@syncfusion/ej2-base/styles/tailwind3.css";
@import "../node_modules/@syncfusion/ej2-inputs/styles/tailwind3.css";
@import "../node_modules/@syncfusion/ej2-buttons/styles/tailwind3.css";
@import "../node_modules/@syncfusion/ej2-dropdowns/styles/tailwind3.css";
@import "../node_modules/@syncfusion/ej2-lists/styles/tailwind3.css";
@import "../node_modules/@syncfusion/ej2-popups/styles/tailwind3.css";
@import "../node_modules/@syncfusion/ej2-navigations/styles/tailwind3.css";
@import "../node_modules/@syncfusion/ej2-grids/styles/tailwind3.css";
@import "../node_modules/@syncfusion/ej2-pivotview/styles/tailwind3.css";
</style>

Run the application

The quickstart project is configured to compile and run the application in the browser. Use the following command to run the application.

npm run serve

or

yarn run serve

Output will be displayed as follows.

<template>
  <div id="app">
    <ejs-pivotview :dataSourceSettings="dataSourceSettings" :height="height" :showFieldList="showFieldList">
    </ejs-pivotview>
  </div>
</template>
<script setup>
import { provide } from "vue";
import { PivotViewComponent as EjsPivotview, FieldList } from "@syncfusion/ej2-vue-pivotview";
import { pivotData } from './pivotData.js';

const dataSourceSettings = {
  dataSource: pivotData,
  expandAll: false,
  drilledMembers: [{ name: 'Country', items: ['France'] }],
  columns: [{ name: 'Year', caption: 'Production Year' }, { name: 'Quarter' }],
  values: [{ name: 'Sold', caption: 'Units Sold' }, { name: 'Amount', caption: 'Sold Amount' }],
  rows: [{ name: 'Country' }, { name: 'Products' }],
  formatSettings: [{ name: 'Amount', format: 'C0' }],
  filters: [],
  calculatedFieldSettings: [{ name: 'Total', formula: '"Sum(Amount)"+"Sum(Sold)"' }]
};
const showFieldList = true;
const height = 350;

provide('pivotview', [FieldList]);

</script>
<style>
@import "../node_modules/@syncfusion/ej2-base/styles/tailwind3.css";
@import "../node_modules/@syncfusion/ej2-inputs/styles/tailwind3.css";
@import "../node_modules/@syncfusion/ej2-buttons/styles/tailwind3.css";
@import "../node_modules/@syncfusion/ej2-dropdowns/styles/tailwind3.css";
@import "../node_modules/@syncfusion/ej2-lists/styles/tailwind3.css";
@import "../node_modules/@syncfusion/ej2-popups/styles/tailwind3.css";
@import "../node_modules/@syncfusion/ej2-navigations/styles/tailwind3.css";
@import "../node_modules/@syncfusion/ej2-grids/styles/tailwind3.css";
@import "../node_modules/@syncfusion/ej2-pivotview/styles/tailwind3.css";
</style>
<template>
  <div id="app">
    <ejs-pivotview :dataSourceSettings="dataSourceSettings" :height="height" :showFieldList="showFieldList">
    </ejs-pivotview>
  </div>
</template>
<script>
import { PivotViewComponent, FieldList } from "@syncfusion/ej2-vue-pivotview";
import { pivotData } from './pivotData.js';

export default {
  name: "App",
  components: {
    "ejs-pivotview": PivotViewComponent
  },
  data() {
    return {
      dataSourceSettings: {
        dataSource: pivotData,
        expandAll: false,
        drilledMembers: [{ name: 'Country', items: ['France'] }],
        columns: [{ name: 'Year', caption: 'Production Year' }, { name: 'Quarter' }],
        values: [{ name: 'Sold', caption: 'Units Sold' }, { name: 'Amount', caption: 'Sold Amount' }],
        rows: [{ name: 'Country' }, { name: 'Products' }],
        formatSettings: [{ name: 'Amount', format: 'C0' }],
        filters: [],
        calculatedFieldSettings: [{ name: 'Total', formula: '"Sum(Amount)"+"Sum(Sold)"' }]
      },
      showFieldList: true,
      height: 350
    }
  },
  provide: {
    pivotview: [FieldList]
  }
}
</script>
<style>
@import "../node_modules/@syncfusion/ej2-base/styles/tailwind3.css";
@import "../node_modules/@syncfusion/ej2-inputs/styles/tailwind3.css";
@import "../node_modules/@syncfusion/ej2-buttons/styles/tailwind3.css";
@import "../node_modules/@syncfusion/ej2-dropdowns/styles/tailwind3.css";
@import "../node_modules/@syncfusion/ej2-lists/styles/tailwind3.css";
@import "../node_modules/@syncfusion/ej2-popups/styles/tailwind3.css";
@import "../node_modules/@syncfusion/ej2-navigations/styles/tailwind3.css";
@import "../node_modules/@syncfusion/ej2-grids/styles/tailwind3.css";
@import "../node_modules/@syncfusion/ej2-pivotview/styles/tailwind3.css";
</style>

For more information and to access the quick start project, visit: GitHub Repository

You can also explore our Vue Pivot Table example that shows how to rendering of the pivot table with drill-up and drill-down functionality bound to a relational report.