Getting Started with Angular Gantt Chart
04 Aug 202613 minutes to read
The Angular Gantt Chart is a UI component designed to visualize and manage project schedules using a timeline view. It supports hierarchical task structures, automatic scheduling, and rich interactive features.
This guide demonstrates how to create an Angular application, configure task data, and render a basic Gantt Chart.
Prerequisites
- Node.js 24+ (LTS recommended).
- Syncfusion CLI.
Install the Syncfusion CLI
Install the Syncfusion CLI globally using the following command:
npm install -g @syncfusion/syncfusion-cliCreate a new Angular application using Syncfusion CLI
You can create a Angular application using the Syncfusion CLI. The CLI provides two ways to create a project:
Non-interactive mode
Non-interactive mode allows you to create a project directly using a single command with the required command-line arguments.
sf new syncfusion-angular-app --framework angular --template ganttIn this mode, the project configuration is passed directly in the command. The above command creates a Angular application configured with the Syncfusion® Gantt component.
Interactive mode
Interactive mode guides you through the project creation process with step-by-step prompts.
sfWhen you run the sf command, the CLI prompts you to select the required project configuration. To create a Angular application with the Syncfusion® Gantt component, select the following options:
√ Project name? ... syncfusion-angular-app
√ Choose Framework: » Angular
√ Choose Template: » Gantt
√ Choose Theme: » Material3
√ Choose Style Format: » CSS
√ Would you like to integrate the Syncfusion MCP Server (AI Assistant) into this project? ... no
√ Would you like to install Syncfusion Component Skills for AI-powered development? ... no
√ Install dependencies and start app now? ... no
The above selections generate a Angular application configured with the Syncfusion® Gantt component. You can choose different values for language, theme, style format, MCP setup, and skills installation based on your project requirements.
The Syncfusion® CLI creates the project with a predefined template. After the project is generated, you can customize or replace the component code based on your application requirements.
Run the project
Once the project is created, navigate to the project directory and run the following commands in your terminal.
cd syncfusion-angular-app
npm install
ng serve
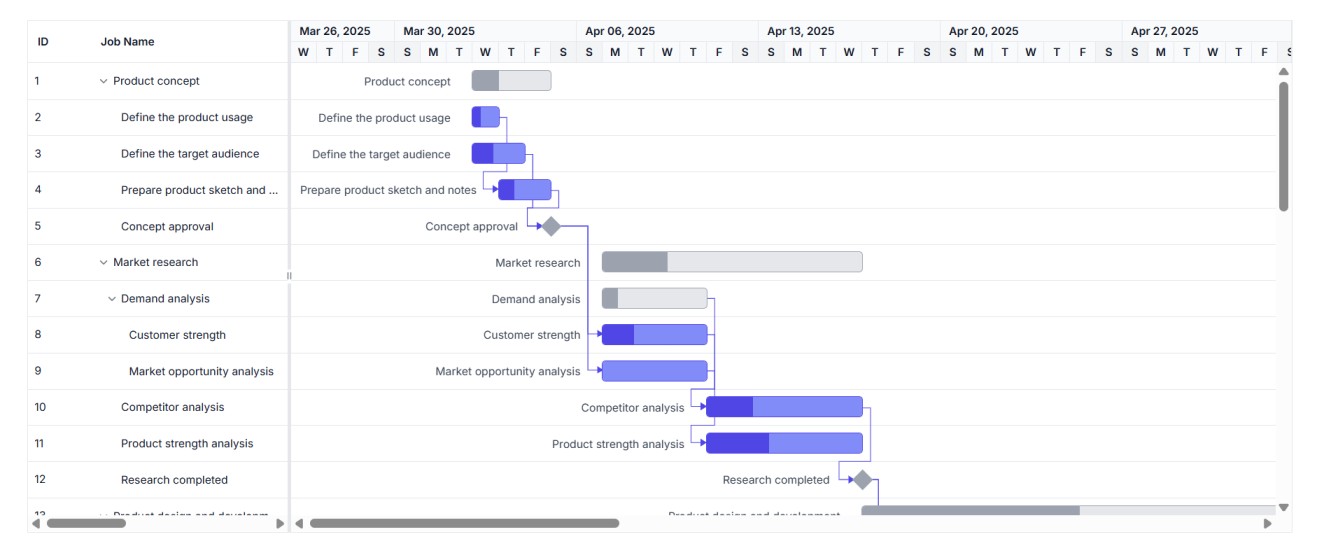
The output will appear as follows:
Prerequisites
Ensure the following prerequisites are installed:
- Node.js 20.11 or later (required by Angular 20/21)
- npm or yarn package manager
- Basic knowledge of Angular framework
- A valid Syncfusion® license key for commercial use. You can obtain a key from your Syncfusion account and register it as shown in the licensing documentation.
Installation
Create a new Angular application using the Angular CLI:
npm install -g @angular/cli
Once the Angular CLI is installed, run the following command to generate a new application:
ng new syncfusion-angular-app
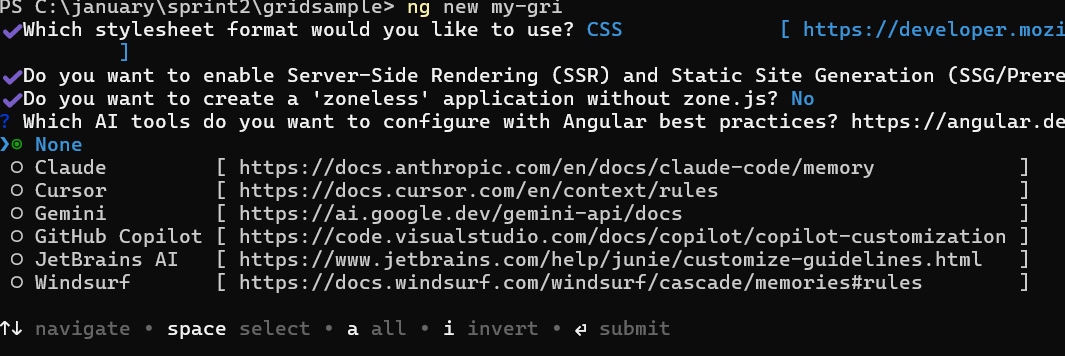
This command will prompt you for several configuration options:
Stylesheet Format — Choose your preferred stylesheet format:
-
CSS(default) — Standard CSS -
SCSS— Sass with full CSS features (recommended for complex styling) -
Sass (Indented)— Indented Sass syntax -
Less— Less CSS preprocessor
To skip the prompts and use SCSS directly:
ng new syncfusion-angular-app --style=scss
Server-side Rendering (SSR) — When prompted, choose:
-
Yes— If you need server-side rendering for performance -
No— For standard client-side rendering (recommended for most cases)

Deployment Presets — Select the required AI tool or choose none if not needed.
Once the project is created, navigate to your application directory:
cd syncfusion-angular-app
This guide uses Angular 21+ with standalone components. For compatibility with other Angular versions, see the Angular version support matrix.
Install the Gantt Chart package using the Angular CLI command:
ng add @syncfusion/ej2-angular-gantt
This command performs the following automatically:
- Installs the
@syncfusion/ej2-angular-ganttpackage and dependencies - Imports the Gantt Chart module into your application
- Registers default theme styles in
angular.json
Add theme styles
The Gantt Chart component requires specific CSS files for proper rendering. Syncfusion provides multiple themes for the Gantt Chart component. For a complete list of available themes, refer to the theme packages.
To apply the Tailwind 3 theme, install the corresponding theme package by using the following command:
npm install @syncfusion/ej2-tailwind3-theme
The installed theme package includes an index.css file that automatically imports all the required dependency styles. Import the following stylesheet into src/styles.css:
@import '../node_modules/@syncfusion/ej2-tailwind3-theme/styles/gantt/index.css';
Create sample task data
Define a simple task list with hierarchical relationships. The data includes two parent tasks (TaskID 1 and 5) with child tasks linked via ParentID. Each task must have a StartDate and either a Duration (in days) or EndDate to render properly.
public data = [
    {TaskID: 1, TaskName: 'Project initiation', StartDate: new Date('2024-04-01'), EndDate: new Date('2024-04-15')},
    {TaskID: 2, TaskName: 'Identify site location', StartDate: new Date('2024-04-01'), Duration: 4, ParentID: 1},
    {TaskID: 3, TaskName: 'Perform site survey', StartDate: new Date('2024-04-01'), Duration: 4, ParentID: 1},
    {TaskID: 4, TaskName: 'Soil testing', StartDate: new Date('2024-04-01'), Duration: 3, ParentID: 1},
    {TaskID: 5, TaskName: 'Project estimation', StartDate: new Date('2024-04-15'), EndDate: new Date('2024-04-25')},
    {TaskID: 6, TaskName: 'Develop floor plan', StartDate: new Date('2024-04-15'), Duration: 5, ParentID: 5},
    {TaskID: 7, TaskName: 'Estimate project cost', StartDate: new Date('2024-04-15'), Duration: 5, ParentID: 5}
];
Configure task fields mapping
Map the data fields to Gantt Chart properties using taskFields:
public taskSettings = {
    id: 'TaskID',
    name: 'TaskName',
    startDate: 'StartDate',
    duration: 'Duration',
    parentID: 'ParentID'
};
Field mapping reference
| Property | Description | Required |
|---|---|---|
id |
Unique task identifier | Yes |
name |
Task display name | Yes |
startDate |
Task start date | Yes |
duration |
Task duration in days | Either Duration or EndDate |
endDate |
Task end date | Either Duration or EndDate |
parentID |
Parent task ID for hierarchy | No |
Render the Angular Gantt Chart Component
Update the component file to render the Gantt Chart using the sample data and task settings defined earlier.
For Angular 20+ (Standalone Components)
Modify the src/app/app.ts file with the following code:
import { Component, ViewEncapsulation } from '@angular/core';
import { GanttModule } from '@syncfusion/ej2-angular-gantt';

@Component({
    imports: [GanttModule],
    standalone: true,
    selector: 'app-root',
    template: `<ejs-gantt [dataSource]="data" [taskFields]="taskSettings"></ejs-gantt>`,
    encapsulation: ViewEncapsulation.None
})
export class App {
    public data = [
        {TaskID: 1, TaskName: 'Project initiation', StartDate: new Date('2024-04-01'), EndDate: new Date('2024-04-15')},
        {TaskID: 2, TaskName: 'Identify site location', StartDate: new Date('2024-04-01'), Duration: 4, ParentID: 1},
        {TaskID: 3, TaskName: 'Perform site survey', StartDate: new Date('2024-04-01'), Duration: 4, ParentID: 1},
        {TaskID: 4, TaskName: 'Soil testing', StartDate: new Date('2024-04-01'), Duration: 3, ParentID: 1},
        {TaskID: 5, TaskName: 'Project estimation', StartDate: new Date('2024-04-15'), EndDate: new Date('2024-04-25')},
        {TaskID: 6, TaskName: 'Develop floor plan', StartDate: new Date('2024-04-15'), Duration: 5, ParentID: 5},
        {TaskID: 7, TaskName: 'Estimate project cost', StartDate: new Date('2024-04-15'), Duration: 5, ParentID: 5}
    ];
    public taskSettings = {
        id: 'TaskID',
        name: 'TaskName',
        startDate: 'StartDate',
        duration: 'Duration',
        parentID: 'ParentID'
    };
}
Key Properties:
-
imports: [GanttModule]— Imports the Gantt Chart module for use in this component -
standalone: true— Indicates this is a standalone component (Angular 14+) -
template— Defines the component’s HTML inline;[dataSource]="data"binds the task data and[taskFields]="taskSettings"maps the field names -
encapsulation: ViewEncapsulation.None— Disables view encapsulation to allow global styles to apply to the Gantt Chart
For Angular 19 and Earlier (Module-Based)
If using Angular 19 or earlier, define the component in src/app/app.component.ts:
import { Component, ViewEncapsulation } from '@angular/core';
import { GanttModule } from '@syncfusion/ej2-angular-gantt';

@Component({
    selector: 'app-root',
    templateUrl: './app.component.html',
    styleUrls: ['./app.component.css'],
    encapsulation: ViewEncapsulation.None
})
export class AppComponent {
    public data = [/* ... task data ... */];
    public taskSettings = {/* ... field mappings ... */};
}
Then add to src/app/app.module.ts:
import { GanttModule } from '@syncfusion/ej2-angular-gantt';
import { NgModule } from '@angular/core';

@NgModule({
    imports: [GanttModule],
    // ... other declarations
})
export class AppModule { }
And create src/app/app.component.html:
<ejs-gantt [dataSource]="data" [taskFields]="taskSettings"></ejs-gantt>
Run the application
Start the development server with:
ng serve --open
This command:
- Compiles the Angular application
- Starts a local development server on
http://localhost:4200(default port) - Opens the application in your default browser (the
--openflag)
Troubleshooting:
-
Port 4200 already in use: Run
ng serve --port 4300to use a different port -
Module not found errors: Ensure all dependencies are installed with
npm install -
Styles not applied: Verify all CSS imports in
src/styles.cssare correct -
Blank page: Check the browser console for errors and ensure the element
<ejs-gantt>is rendering
Output
The Gantt Chart displays:
- Task hierarchy with parent-child relationships
- Timeline view showing task bars
- Automatically calculated dates based on duration
The chart displays two parent tasks (Project initiation, Project estimation) with subtasks shown in a tree structure. Task bars are rendered on the timeline, sized according to their duration and start dates.
You can preview the following sample by clicking the Preview Sample button.
import { Component, ViewEncapsulation, OnInit } from '@angular/core';
import { GanttModule } from '@syncfusion/ej2-angular-gantt'

@Component({
    imports: [GanttModule],
    standalone: true,
    selector: 'app-root',
    template:
        `<ejs-gantt [dataSource]="data" [taskFields]="taskSettings" ></ejs-gantt>`,
    encapsulation: ViewEncapsulation.None
})

export class App implements OnInit {
    public data?: object[];
    public taskSettings?: object;

    public ngOnInit(): void {
        this.data = [
            { TaskID: 1, TaskName: 'Project initiation', StartDate: new Date('2024-04-01'), EndDate: new Date('2024-04-15') },
            { TaskID: 2, TaskName: 'Identify site location', StartDate: new Date('2024-04-01'), Duration: 4, ParentID: 1 },
            { TaskID: 3, TaskName: 'Perform site survey', StartDate: new Date('2024-04-01'), Duration: 4, ParentID: 1 },
            { TaskID: 4, TaskName: 'Soil testing', StartDate: new Date('2024-04-01'), Duration: 3, ParentID: 1 },
            { TaskID: 5, TaskName: 'Project estimation', StartDate: new Date('2024-04-15'), EndDate: new Date('2024-04-25') },
            { TaskID: 6, TaskName: 'Develop floor plan', StartDate: new Date('2024-04-15'), Duration: 5, ParentID: 5 },
            { TaskID: 7, TaskName: 'Estimate project cost', StartDate: new Date('2024-04-15'), Duration: 5, ParentID: 5 }
        ];
        this.taskSettings = {
            id: 'TaskID',
            name: 'TaskName',
            startDate: 'StartDate',
            duration: 'Duration',
            parentID: 'ParentID'
        };
    }
}Error handling
Proper error handling helps identify and resolve issues during development. The Gantt Chart provides events to capture validation and configuration errors.
Common error scenarios
-
Missing taskFields mapping — If
taskFieldsis not properly configured, the Gantt Chart cannot map data fields to task properties. Ensure all required fields (id,name,startDate) are mapped. - Invalid date format — Task dates must be valid JavaScript Date objects. Invalid dates prevent proper rendering.
-
Missing dataSource — Ensure
dataSourceis bound to the component with task data. -
Unsupported field types — The
idfield must be numeric or string; Duration must be numeric. -
Module not imported — Verify that
GanttModuleis imported in the component (standalone) or module declaration.
Handling errors with actionFailure event
Use the actionFailure event to capture and handle errors:
@Component({
    template: `<ejs-gantt [dataSource]="data" [taskFields]="taskSettings" (actionFailure)="onActionFailure($event)"></ejs-gantt>`
})
export class App {
    public data = [/* ... */];
    public taskSettings = {/* ... */};

    onActionFailure(args: any) {
        console.error('Gantt Chart Error:', args.error);
        alert(`Configuration Error: ${args.error}`);
    }
}
Next Steps
- Key Elements - Learn about UI components and interactions
- Feature Modules - Enable advanced features with module injection
- Overview - Explore all available features
Looking for the full Angular Gantt Chart component overview, features, pricing, and documentation? Visit the Angular Gantt Chart page.