How can I help you?
Creating a Next.js Application Using Syncfusion React Chart Component
22 May 20265 minutes to read
This section provides a step-by-step guide for setting up a Next.js application and integrating the Syncfusion® React Chart component.
What is Next.js?
Next.js is a React framework that makes it easy to build fast, SEO-friendly, and user-friendly web applications. It provides features such as server-side rendering, automatic code splitting, routing, and API routes, making it an excellent choice for building modern web applications.
Prerequisites
Before getting started with the Next.js application, ensure the following prerequisites are met:
-
Node.js 16.8 or later.
-
The application is compatible with macOS, Windows, and Linux operating systems.
Step 1: Create a Next.js application
To create a new Next.js application, use one of the commands that are specific to either NPM or Yarn.
npx create-next-app@latestyarn create next-appUsing one of the above commands will lead you to set up additional configurations for the project as below:
1.Define the project name: Users can specify the name of the project directly. Let’s specify the name of the project as ej2-nextjs-chart.
√ What is your project named? » ej2-nextjs-chart2.Select the required packages.
√ Would you like to use the recommended Next.js defaults? » Yes, use recommended defaultsBy selecting default packages, all essential packages for Next.js will be installed.
3.Once complete the above mentioned steps to create ej2-nextjs-chart, navigate to the directory using the below command:
cd ej2-nextjs-chartThe application is ready to run with default settings. Now, let’s add Syncfusion® components to the project.
Step 2: Install Syncfusion® React packages
Syncfusion® React component packages are available at npmjs.com. To use Syncfusion® React components in the project, install the corresponding npm package.
Here, the React Chart component is used in the project. To install the React Chart component, use the following command:
npm install @syncfusion/ej2-react-charts --saveyarn add @syncfusion/ej2-react-chartsStep 3: Add Syncfusion® React component
Follow the below steps to add the React Chart component to the Next.js project:
1.Before adding the Chart component to your markup, import the Chart component in the src/app/page.tsx file.
'use client'
import {
  AxisModel, Category, ChartComponent, ColumnSeries, DataLabel, Inject,
  Legend, LegendSeriesModel, LineSeries, SeriesCollectionDirective, SeriesDirective, Tooltip, TooltipSettingsModel
} from '@syncfusion/ej2-react-charts';
2.Then, define the Chart component in the src/app/page.tsx file, as shown below:
'use client'
import {
Category, ChartComponent, ColumnSeries, Inject,
LineSeries, SeriesCollectionDirective, SeriesDirective
} from '@syncfusion/ej2-react-charts';
export default function Home() {
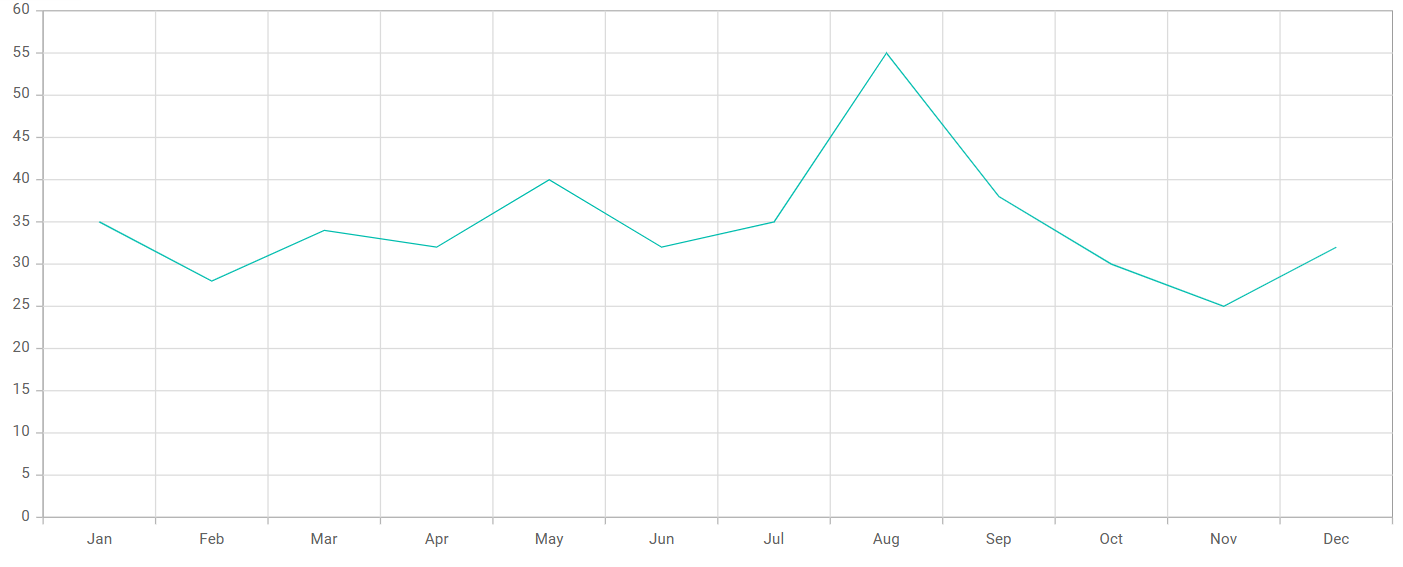
const data: Object[] = [
{ month: 'Jan', sales: 35 }, { month: 'Feb', sales: 28 },
{ month: 'Mar', sales: 34 }, { month: 'Apr', sales: 32 },
{ month: 'May', sales: 40 }, { month: 'Jun', sales: 32 },
{ month: 'Jul', sales: 35 }, { month: 'Aug', sales: 55 },
{ month: 'Sep', sales: 38 }, { month: 'Oct', sales: 30 },
{ month: 'Nov', sales: 25 }, { month: 'Dec', sales: 32 }
];
const xAxisCategory = { valueType: 'Category' };
return (
<ChartComponent id="charts" primaryXAxis={xAxisCategory} >
<Inject services={[ColumnSeries, LineSeries, Category]} />
<SeriesCollectionDirective>
<SeriesDirective dataSource={data} xName='month' yName='sales' name='Sales' />
</SeriesCollectionDirective>
</ChartComponent>
)
}Step 4: Run the application
To run the application, use the following command:
npm run devyarn run devOpen the generated local URL (for example, /localhost:3000/) from terminal in the browser. The application displays the chart as shown below:
To learn more about the functionality of the Chart component, refer to the documentation.