Getting Started with the React Chart Component
6 Jul 20267 minutes to read
This section describes the steps to create a simple Chart.
Ready to streamline your Syncfusion® React development? Discover the full potential of Syncfusion® React components with Syncfusion® AI Coding Assistant. Effortlessly integrate, configure, and enhance your projects with intelligent, context-aware code suggestions, streamlined setups, and real-time insights—all seamlessly integrated into your preferred AI-powered IDEs like VS Code, Cursor, Syncfusion® CodeStudio and more. Explore Syncfusion® AI Coding Assistant
A quick video overview of the React Charts setup is available:
Prerequisites
Before getting started, ensure that your development environment meets the system requirements for Syncfusion® React UI components
Before You Begin
This guide uses the React application structure generated by Vite with the TypeScript template.
The main files used in this guide are:
-
src/App.tsx— Defines the root React component. -
src/main.tsx— Application entry point. -
index.html— Root HTML file.
Note: In a Vite React TypeScript application, the root component is commonly generated as
src/App.tsx. If your application uses JavaScript, the equivalent file is typicallysrc/App.jsx.
Note: This guide uses the TypeScript template for better type checking with Chart models.
Installation and configuration
Note: As an alternative, you can create a React application using
create-react-appFor detailed instructions, refer to this documentation.
Step 1: Set up the React environment
Use Vite to create and manage React applications. Vite provides a fast development environment and optimized builds for modern React applications. Syncfusion® React documentation also recommends Vite for setting up React applications.
Start by opening a terminal on your system (Command Prompt, PowerShell, or Terminal). You may work from the default C: drive location or create a new folder and open the terminal in it.
Step 2: Create a React application
Create a new React application using the below command.
npm create vite@latest my-chart-app -- --template react-tsIf Vite prompts you to install dependencies and start the project immediately, choose No. The Syncfusion package is installed in a later step.
Navigate to the project folder:
cd my-chart-appInstall the application dependencies:
npm installNote: If you prefer JavaScript instead of TypeScript, create the application using
npm create vite@latest my-chart-app -- --template react.
Step 3: Install the Syncfusion® React Chart package
All Syncfusion Essential® JS 2 packages are available in the npmjs.com registry.
Install the React Chart package using the following command:
npm install @syncfusion/ej2-react-charts --saveInstalling
@syncfusion/ej2-react-chartsautomatically installs the required dependency packages. The –save will instruct NPM to include the Chart package inside of the dependencies section of the package.json.
The steps up to this point can be completed using the initially opened terminal or command prompt. For adding Chart components, open the project in the IDE installed on your device.
Step 4: Add Chart to the project
Add the Chart component to src/App.tsx using the following code.
import { ChartComponent } from '@syncfusion/ej2-react-charts';
function App() {
  return (<ChartComponent />);
}
export default App;
Note: This will render an empty chart area by running
npm run devin terminal (Refer Step 7). Proceed to the next steps to add data, series, and necessary module injections to visualize your data.
Step 5: Module injection
Chart features are delivered as separate modules and must be explicitly injected. Here, the LineSeries and Category modules are used to render yearly sales data.
-
LineSeries- Inject this module in toservicesto use line series. -
Category- Inject this module in toservicesto use category feature.
Import the above-mentioned modules from the Chart package and inject them into the services section of the Chart component as follows.
import { ChartComponent, LineSeries, Category, Inject } from '@syncfusion/ej2-react-charts';
function App() {
    return <ChartComponent>
    <Inject services={[LineSeries, Category]}/>
  </ChartComponent>;
}
export default App;
Note: At this stage, no series are rendered because the Chart component has not yet been configured with a data source.
Step 6: Populate Chart with data
The chart data should be provided as a JSON array in the following format. You can define the data in the same src/App.tsx file or place it in a separate file (for example, src/datasource.ts) and import it into App.tsx.
export const data: Object[] = [
{ month: 'Jan', sales: 35 }, { month: 'Feb', sales: 28 },
{ month: 'Mar', sales: 34 }, { month: 'Apr', sales: 32 },
{ month: 'May', sales: 40 }, { month: 'Jun', sales: 32 },
{ month: 'Jul', sales: 35 }, { month: 'Aug', sales: 55 },
{ month: 'Sep', sales: 38 }, { month: 'Oct', sales: 30 },
{ month: 'Nov', sales: 25 }, { month: 'Dec', sales: 32 }
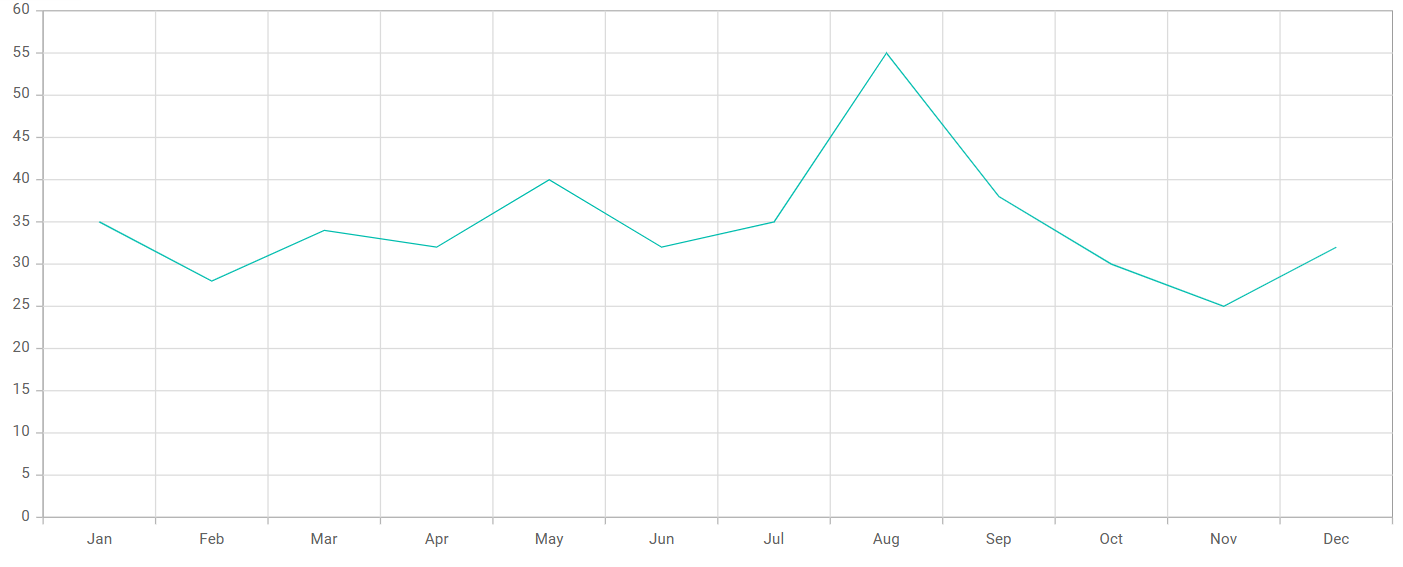
];After defining the required data set, bind the data to the Chart component in the SeriesDirective tag. The following code snippet demonstrates the complete configuration required to render a basic chart.
import {  ChartComponent, Inject, SeriesCollectionDirective, SeriesDirective, Category, LineSeries } from '@syncfusion/ej2-react-charts';

const data: Object[] = [
    { month: 'Jan', sales: 35 }, { month: 'Feb', sales: 28 },
    { month: 'Mar', sales: 34 }, { month: 'Apr', sales: 32 },
    { month: 'May', sales: 40 }, { month: 'Jun', sales: 32 },
    { month: 'Jul', sales: 35 }, { month: 'Aug', sales: 55 },
    { month: 'Sep', sales: 38 }, { month: 'Oct', sales: 30 },
    { month: 'Nov', sales: 25 }, { month: 'Dec', sales: 32 }
];
const xAxisCategory = { valueType: 'Category' };

function App() {
  return <ChartComponent id="charts" primaryXAxis={xAxisCategory}>
    <Inject services={[LineSeries, Category]} />
    <SeriesCollectionDirective>
      <SeriesDirective dataSource={data} xName='month' yName='sales' name='Sales' type='Line'/>
    </SeriesCollectionDirective>
  </ChartComponent>
}
export default App;
Step 7: Run the application
Run the application using the following command:
npm run devOpen the generated local URL (for example, localhost:5173/) from terminal in the browser. The application displays the chart as shown below:
You can refer to our React Charts feature tour page for its groundbreaking feature representations. You can also explore our React Charts example that shows various Chart types and how to represent time-dependent data, showing trends in data at equal intervals.