How can I help you?
Getting started with the React Chart Component in the Preact Framework
19 Feb 20264 minutes to read
This article provides a step-by-step guide for setting up a Preact project and integrating the Syncfusion® React Chart component.
Preact is a fast and lightweight JavaScript library for building user interfaces. It’s often used as an alternative to larger frameworks like React. The key difference is that Preact is designed to be smaller in size and faster in performance, making it a good choice for projects where file size and load times are critical factors.
Prerequisites
System requirements for Syncfusion® React UI components
Set up the Preact project
To create a new Preact project, use one of the commands that are specific to either NPM or Yarn.
npm init preactor
yarn init preactUsing one of the above commands will lead you to set up additional configurations for the project, as below:
1. Define the project name: We can specify the name of the project directly. Let’s specify the name of the project as my-project for this article.
T  Preact - Fast 3kB alternative to React with the same modern API
|
*  Project directory:
|  my-project
—
2. Choose JavaScript as the framework variant to build this Preact project using JavaScript and React.
T  Preact - Fast 3kB alternative to React with the same modern API
|
*  Project language:
|  > JavaScript
|    TypeScript
—
3. Then configure the project as below for this article.
T  Preact - Fast 3kB alternative to React with the same modern API
|
*  Use router?
|    Yes / > No
—
|
*  Prerender app (SSG)?
|    Yes / > No
—
|
*  Use ESLint?
|    Yes / > No
—
4. Upon completing the aforementioned steps to create my-project, run the following command to jump into the project directory:
cd my-projectNow that my-project is ready to run with default settings, let’s add Syncfusion® components to the project.
Add the Syncfusion® React packages
Syncfusion® React component packages are available at npmjs.com. To use Syncfusion® React components in the project, install the corresponding npm package.
This article uses the React Chart component as an example. To use the React Chart component in the project, the @syncfusion/ej2-react-charts package needs to be installed using the following command:
npm install @syncfusion/ej2-react-charts --saveor
yarn add @syncfusion/ej2-react-chartsAdd the Syncfusion® React component
Follow the below steps to add the React Chart component to the Preact project:
1. Before adding the Chart component to your markup, import the Chart component in the src/index.jsx file.
import { Category, ChartComponent, ColumnSeries, Inject, LineSeries, SeriesCollectionDirective, SeriesDirective, Tooltip } from '@syncfusion/ej2-react-charts';2. Then, define the Chart component in the src/index.jsx file, as shown below:
import { render } from 'preact';
import { Category, ChartComponent, ColumnSeries, Inject, LineSeries, SeriesCollectionDirective, SeriesDirective, Tooltip } from '@syncfusion/ej2-react-charts';
export function App() {
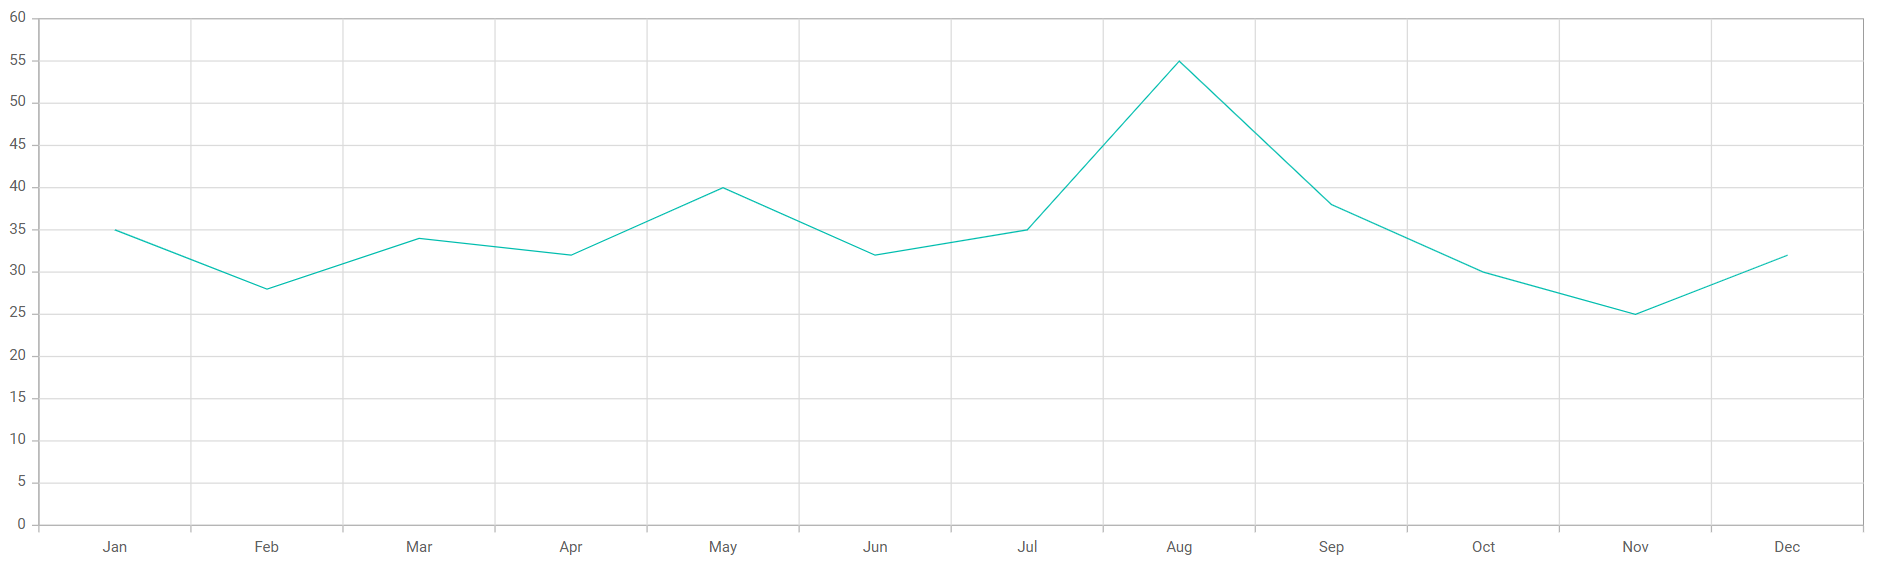
const data = [
{ month: 'Jan', sales: 35 }, { month: 'Feb', sales: 28 },
{ month: 'Mar', sales: 34 }, { month: 'Apr', sales: 32 },
{ month: 'May', sales: 40 }, { month: 'Jun', sales: 32 },
{ month: 'Jul', sales: 35 }, { month: 'Aug', sales: 55 },
{ month: 'Sep', sales: 38 }, { month: 'Oct', sales: 30 },
{ month: 'Nov', sales: 25 }, { month: 'Dec', sales: 32 }
];
const primaryXAxis = { valueType: 'Category' };
return (
<ChartComponent id="charts" primaryXAxis={primaryXAxis}>
<Inject services={[ColumnSeries, Tooltip, LineSeries, Category]}/>
<SeriesCollectionDirective>
<SeriesDirective dataSource={data} xName='month' yName='sales' name='Sales'/>
</SeriesCollectionDirective>
</ChartComponent>
);
}
render(<App />, document.getElementById('app'));Run the project
To run the project, use the following command:
npm run devor
yarn run devThe output will appear as follows: