Getting Started with the Vue Gantt Chart Component in Vue 3
21 Jul 20269 minutes to read
This article provides a step-by-step guide for setting up a Vite project with a JavaScript environment and integrating the Vue Gantt Chart component using the Composition API.
Prerequisites
Before you begin, make sure that:
- Node.js and npm (or Yarn) are installed.
- Vite and Vue 3 are supported in your environment.
- You are using a supported version of the Syncfusion Vue package for your project.
For compatibility details, see System requirements for Syncfusion® Vue UI components.
Set up the Vite project
A recommended approach for beginning with Vue is to scaffold a project using Vite. To create a new Vite project, use one of the commands that are specific to either NPM or Yarn.
npm create vite@latestor
yarn create viteUsing one of the above commands will lead you to set up additional configurations for the project as below:
1.Define the project name: The name of the project can be specified directly. For this article, the project name is set as my-project.
? Project name: » my-project2.Select Vue as the framework. It will create a Vue 3 project.
? Select a framework: » - Use arrow-keys. Return to submit.
Vanilla
> Vue
  React
  Preact
  Lit
  Svelte
  Others
3.Choose JavaScript as the framework variant to build this Vite project using JavaScript and Vue.
? Select a variant: » - Use arrow-keys. Return to submit.
> JavaScript
  TypeScript
  Customize with create-vue ↗
  Nuxt ↗
4.Install dependencies and start the development server.
Install with npm and start now?: YesSince you selected Yes, the development server should start automatically. If you selected No, please follow these steps to set up and start the project manually:
cd my-project
npm install
or
cd my-project
yarn install
Now that my-project is ready to run with default settings, let’s add Syncfusion® components to the project.
Add Syncfusion® Vue packages
Syncfusion® Vue component packages are available at npmjs.com. To use Syncfusion® Vue components in the project, install the corresponding npm package.
This article uses the Vue Gantt Chart component as an example. To use the Vue Gantt Chart component in the project, install the @syncfusion/ej2-vue-gantt package using the following command:
npm install @syncfusion/ej2-vue-ganttor
yarn add @syncfusion/ej2-vue-ganttAdding CSS reference
Themes for Syncfusion® Gantt Chart components can be applied using CSS files provided through npm theme packages. For available themes, refer to the Themes documentation.
Install the Tailwind 3 theme package using the following command:
npm install @syncfusion/ej2-tailwind3-theme --saveThen add the following CSS reference to the src/App.vue file:
<style>
    @import "../node_modules/@syncfusion/ej2-tailwind3-theme/styles/gantt/index.css";
</style>
Create sample data
Define a simple task list with hierarchical relationships. Each task must have a StartDate and either a Duration or EndDate to render properly.
const data = [
  {
    TaskID: 1,
    TaskName: "Project initiation",
    StartDate: new Date("2024-04-01"),
    EndDate: new Date("2024-04-15"),
  },
  {
    TaskID: 2,
    TaskName: "Identify site location",
    StartDate: new Date("2024-04-01"),
    Duration: 4,
    Progress: 70,
    ParentID: 1,
  },
  {
    TaskID: 3,
    TaskName: "Perform site survey",
    StartDate: new Date("2024-04-01"),
    Duration: 4,
    Progress: 50,
    ParentID: 1,
  },
  {
    TaskID: 4,
    TaskName: "Soil testing",
    StartDate: new Date("2024-04-01"),
    Duration: 3,
    Progress: 40,
    ParentID: 1,
  },
  {
    TaskID: 5,
    TaskName: "Project estimation",
    StartDate: new Date("2024-04-08"),
    EndDate: new Date("2024-04-18"),
  },
  {
    TaskID: 6,
    TaskName: "Develop floor plan",
    StartDate: new Date("2024-04-08"),
    Duration: 5,
    Progress: 30,
    ParentID: 5,
  },
  {
    TaskID: 7,
    TaskName: "Estimate project cost",
    StartDate: new Date("2024-04-08"),
    Duration: 5,
    Progress: 20,
    ParentID: 5,
  },
];
Configure task fields
const taskFields = {
  id: "TaskID",
  name: "TaskName",
  startDate: "StartDate",
  duration: "Duration",
  progress: "Progress",
  parentID: "ParentID",
};
Field mapping reference
| Property | Description | Required |
|---|---|---|
id |
Unique task identifier | Yes |
name |
Task display name | Yes |
startDate |
Task start date | Yes |
duration |
Task duration in days | Yes |
progress |
Task completion percentage (0-100) | No |
parentID |
Parent task ID for hierarchy | No |
Render the Gantt Chart component
Replace the default src/App.vue content with the following example, or add the sample code to your existing App.vue file. Import and register the Gantt Chart component in the <script> section, and use the setup attribute in the <script> tag to enable the Composition API.
To display the Gantt Chart, bind your task data using the dataSource property and map the corresponding fields using the taskFields property.
<template>
  <ejs-gantt
    :dataSource="data"
    :taskFields="taskFields"
  >
  </ejs-gantt>
</template>

<script setup>
  // Import and register the Gantt Chart component
  import { GanttComponent as EjsGantt} from '@syncfusion/ej2-vue-gantt';
  const data = [
    {TaskID: 1, TaskName: 'Project initiation', StartDate: new Date('2024-04-01'), EndDate: new Date('2024-04-15')},
    {TaskID: 2, TaskName: 'Identify site location', StartDate: new Date('2024-04-01'), Duration: 4, Progress: 70, ParentID: 1},
    {TaskID: 3, TaskName: 'Perform site survey', StartDate: new Date('2024-04-01'), Duration: 4, Progress: 50, ParentID: 1},
    {TaskID: 4, TaskName: 'Soil testing', StartDate: new Date('2024-04-01'), Duration: 3, Progress: 40, ParentID: 1},
    {TaskID: 5, TaskName: 'Project estimation', StartDate: new Date('2024-04-08'), EndDate: new Date('2024-04-18')},
    {TaskID: 6, TaskName: 'Develop floor plan', StartDate: new Date('2024-04-08'), Duration: 5, Progress: 30, ParentID: 5},
    {TaskID: 7, TaskName: 'Estimate project cost', StartDate: new Date('2024-04-08'), Duration: 5, Progress: 20, ParentID: 5}
  ];
  const taskFields = {
    id: 'TaskID',
    name: 'TaskName',
    startDate: 'StartDate',
    duration: 'Duration',
    progress: 'Progress',
    parentID: 'ParentID'
  };
</script>

<style>
@import "../node_modules/@syncfusion/ej2-base/styles/tailwind3.css";
@import "../node_modules/@syncfusion/ej2-gantt/styles/tailwind3.css";
@import "../node_modules/@syncfusion/ej2-grids/styles/tailwind3.css";
@import "../node_modules/@syncfusion/ej2-treegrid/styles/tailwind3.css";
@import "../node_modules/@syncfusion/ej2-layouts/styles/tailwind3.css";
@import "../node_modules/@syncfusion/ej2-popups/styles/tailwind3.css";
</style>
Run the application
Run the application using the following command:
npm run devThe development server usually starts on http://localhost:5173. If it does not start, verify that the dependencies were installed successfully and that you are running the command from the project folder.
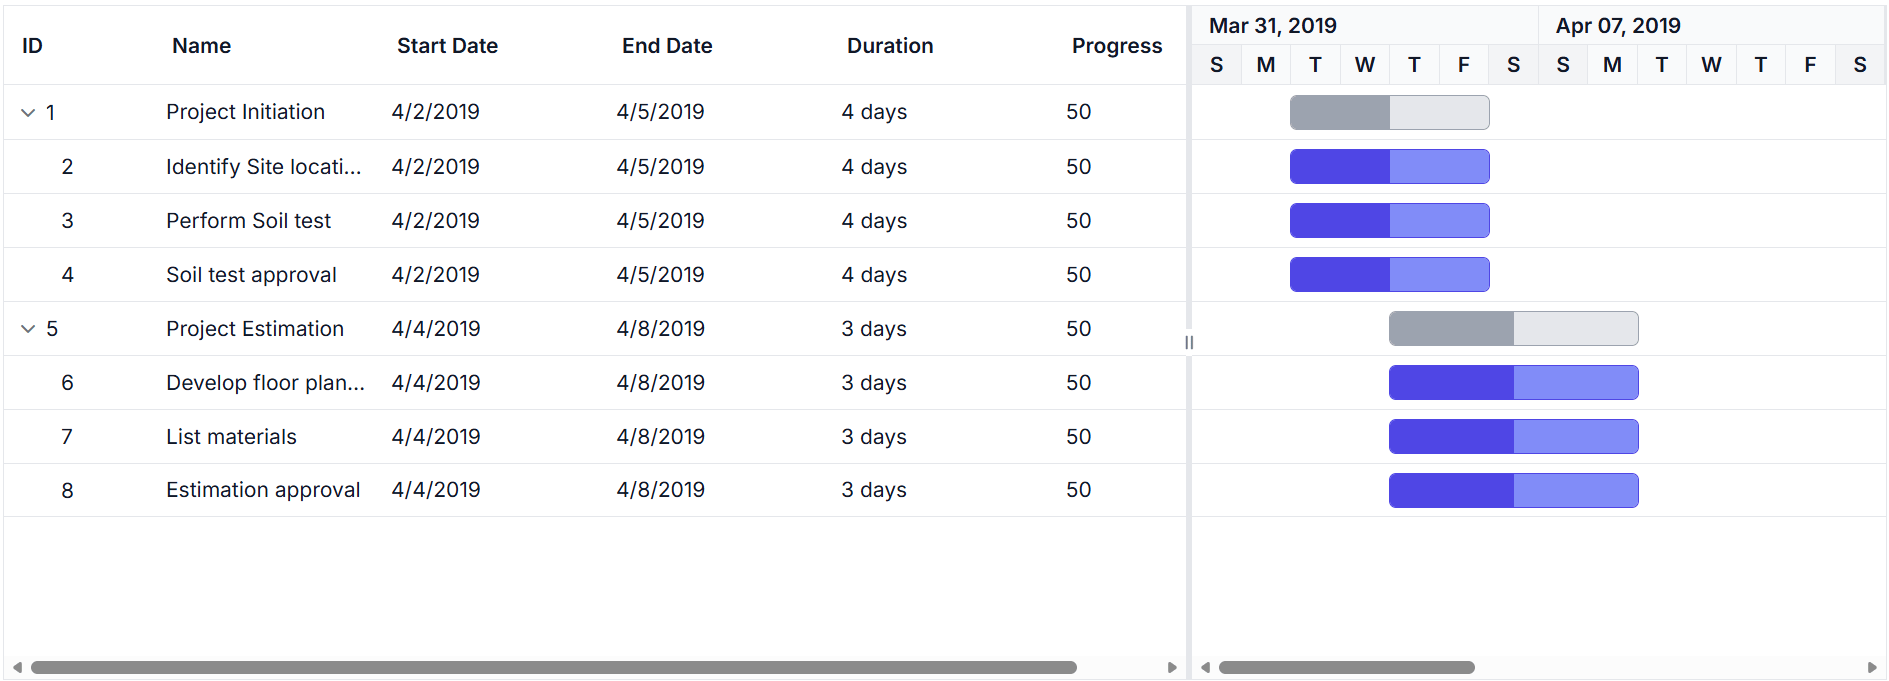
Output
You will see a Gantt Chart with:
- Task hierarchy with parent-child relationships
- Timeline view showing task bars
- Progress indicators on each task
- Automatically calculated dates based on duration
The chart displays two parent tasks (“Project initiation” and “Project estimation”) with their subtasks shown in a tree structure. Task bars are rendered on the timeline, sized according to their duration and start dates.
Web server will be initiated, Open the quick start app in the browser at port localhost:8080.
Next Steps
- Key Elements - Learn about UI components and interactions
- Feature Modules - Enable advanced features with module injection
- Overview - Explore all available features