Formulas in React Spreadsheet component
15 Dec 202424 minutes to read
Formulas are used for calculating the data in a worksheet. You can refer the cell reference from same sheet or from different sheets.
Usage
You can set formula for a cell in the following ways,
- Using the
formulaproperty fromcell, you can set the formula or expression to each cell at initial load. - Set the formula or expression through data binding.
- You can set formula for a cell by
editing. - Using the
updateCellmethod, you can set or update the cell formula.
Culture-Based Argument Separator
Previously, although you could import culture-based Excel files into the Spreadsheet component, the formulas wouldn’t calculate correctly. This was due to the absence of culture-based argument separators and support for culture-based formatted numeric values as arguments. However, starting from version 25.1.35, you can now import culture-based Excel files into the Spreadsheet component.
Before importing culture-based Excel files, ensure that the Spreadsheet component is rendered with the corresponding culture. Additionally, launch the import/export services with the same culture to ensure compatibility.
When loading spreadsheet data with culture-based formula argument separators using cell data binding, local/remote data, or JSON, ensure to set the listSeparator property value as the culture-based list separator from your end. Additionally, note that when importing an Excel file, the listSeparator property will be updated based on the culture of the launched import/export service.
In the example below, the Spreadsheet component is rendered with the German culture (de). Additionally, you can find references on how to set the culture-based argument separator and culture-based formatted numeric value as arguments to the formulas.
import * as React from 'react';
import { SpreadsheetComponent, SheetsDirective, SheetDirective, RangesDirective, RowsDirective, RowDirective, CellDirective, CellsDirective } from '@syncfusion/ej2-react-spreadsheet';
import { RangeDirective, ColumnsDirective, ColumnDirective, getFormatFromType } from '@syncfusion/ej2-react-spreadsheet';
import { L10n, loadCldr, setCurrencyCode, setCulture } from '@syncfusion/ej2-base';
import deDELocalization from './locale.json';
import cagregorian from './ca-gregorian.json';
import currencies from './currencies.json';
import numbers from './numbers.json';
import timeZoneNames from './timeZoneNames.json';
import numberingSystems from './numberingSystems.json';
import { data } from './datasource';

L10n.load(deDELocalization);

function App() {
  const spreadsheetRef = React.useRef(null);

  setCulture('de');
  setCurrencyCode('EUR');
  loadCldr(cagregorian, currencies, numbers, timeZoneNames, numberingSystems);

  React.useEffect(() => {
    let spreadsheet = spreadsheetRef.current;
    if (spreadsheet) {
      spreadsheet.cellFormat({ textAlign: 'center', fontWeight: 'bold' }, 'A1:E1');
      spreadsheet.numberFormat(getFormatFromType('Currency'), 'D2:E12');
      spreadsheet.numberFormat(getFormatFromType('Currency'), 'E13:E15');
    }
  }, []);

  return (
    <div>
      <SpreadsheetComponent ref={spreadsheetRef} locale='de' listSeparator=';' showSheetTabs={false} showRibbon={false}>
        <SheetsDirective>
          <SheetDirective selectedRange='E14'>
            <RangesDirective>
              <RangeDirective dataSource={data}></RangeDirective>
            </RangesDirective>
            <RowsDirective>
              <RowDirective index={12}>
                <CellsDirective>
                  <CellDirective index={3} value='Subtotal:'></CellDirective>
                  <CellDirective formula='=SUBTOTAL(9;E2:E12)'></CellDirective>
                </CellsDirective>
              </RowDirective>
              <RowDirective>
                <CellsDirective>
                  <CellDirective index={3} value='Discount (8,5%):'></CellDirective>
                  <CellDirective formula='=PRODUCT(8,5;E13)/100'></CellDirective>
                </CellsDirective>
              </RowDirective>
              <RowDirective>
                <CellsDirective>
                  <CellDirective index={3} value='Total Amount:'></CellDirective>
                  <CellDirective formula='=E13-E14'></CellDirective>
                </CellsDirective>
              </RowDirective>
            </RowsDirective>
            <ColumnsDirective>
              <ColumnDirective width={120}></ColumnDirective>
              <ColumnDirective width={180}></ColumnDirective>
              <ColumnDirective width={100}></ColumnDirective>
              <ColumnDirective width={120}></ColumnDirective>
              <ColumnDirective width={120}></ColumnDirective>
            </ColumnsDirective>
          </SheetDirective>
        </SheetsDirective>
      </SpreadsheetComponent>
    </div>
  )
};
export default App;
import * as React from 'react';
import { SpreadsheetComponent, SheetsDirective, SheetDirective, RangesDirective, RowsDirective, RowDirective, CellDirective, CellsDirective } from '@syncfusion/ej2-react-spreadsheet';
import { RangeDirective, ColumnsDirective, ColumnDirective, getFormatFromType } from '@syncfusion/ej2-react-spreadsheet';
import { L10n, loadCldr, setCurrencyCode, setCulture } from '@syncfusion/ej2-base';
import deDELocalization from './locale.json';
import cagregorian from './ca-gregorian.json';
import currencies from './currencies.json';
import numbers from './numbers.json';
import timeZoneNames from './timeZoneNames.json';
import numberingSystems from './numberingSystems.json';
import { data } from './datasource';
L10n.load(deDELocalization);
function App() {
const spreadsheetRef = React.useRef<SpreadsheetComponent>(null);
setCulture('de');
setCurrencyCode('EUR');
loadCldr(cagregorian, currencies, numbers, timeZoneNames, numberingSystems);
React.useEffect(() => {
let spreadsheet = spreadsheetRef.current;
if (spreadsheet) {
spreadsheet.cellFormat({ textAlign: 'center', fontWeight: 'bold' }, 'A1:E1');
spreadsheet.numberFormat(getFormatFromType('Currency'), 'D2:E12');
spreadsheet.numberFormat(getFormatFromType('Currency'), 'E13:E15');
}
}, []);
return (
<div>
<SpreadsheetComponent ref={spreadsheetRef} locale='de' listSeparator=';' showSheetTabs={false} showRibbon={false}>
<SheetsDirective>
<SheetDirective selectedRange='E14'>
<RangesDirective>
<RangeDirective dataSource={data}></RangeDirective>
</RangesDirective>
<RowsDirective>
<RowDirective index={12}>
<CellsDirective>
<CellDirective index={3} value='Subtotal:'></CellDirective>
<CellDirective formula='=SUBTOTAL(9;E2:E12)'></CellDirective>
</CellsDirective>
</RowDirective>
<RowDirective>
<CellsDirective>
<CellDirective index={3} value='Discount (8,5%):'></CellDirective>
<CellDirective formula='=PRODUCT(8,5;E13)/100'></CellDirective>
</CellsDirective>
</RowDirective>
<RowDirective>
<CellsDirective>
<CellDirective index={3} value='Total Amount:'></CellDirective>
<CellDirective formula='=E13-E14'></CellDirective>
</CellsDirective>
</RowDirective>
</RowsDirective>
<ColumnsDirective>
<ColumnDirective width={120}></ColumnDirective>
<ColumnDirective width={180}></ColumnDirective>
<ColumnDirective width={100}></ColumnDirective>
<ColumnDirective width={120}></ColumnDirective>
<ColumnDirective width={120}></ColumnDirective>
</ColumnsDirective>
</SheetDirective>
</SheetsDirective>
</SpreadsheetComponent>
</div>
)
};
export default App;{
"de": {
"spreadsheet": {
"InsertingEmptyValue": "Referenzwert ist ungültig.",
"FindValue": "Wert finden",
"ReplaceValue": "Wert ersetzen",
"FindReplaceTooltip": "Ersatz finden",
"ByRow": "Nach Reihen",
"ByColumn": "Nach Spalten",
"MatchExactCellElements": "Gleichen Sie den gesamten Zellinhalt ab",
"EnterCellAddress": "Zelladresse eingeben",
"FindAndReplace": "Suchen und Ersetzen",
"ReplaceAllEnd": " Streichhölzer ersetzt durch ",
"FindNextBtn": "Nächstes finden",
"FindPreviousBtn": "Zurück suchen",
"ReplaceBtn": "Ersetzen",
"ReplaceAllBtn": "Alles ersetzen",
"GotoHeader": "Gehe zu",
"Sheet": "Blatt",
"SearchWithin": "In ... suchen",
"SearchBy": "Suche nach",
"Reference": "Bezug",
"Workbook": "Arbeitsmappe",
"NoElements": "Wir konnten nicht finden, wonach Sie gesucht haben.",
"FindWhat": "Finde was",
"ReplaceWith": "Ersetzen mit",
"FileName": "Dateiname",
"ExtendValidation": "Die Auswahl enthält einige Zellen ohne Datenvalidierung. Möchten Sie die Validierung auf diese Zellen ausdehnen?",
"Yes": "Ja",
"No": "Nein",
"PROPER": "Konvertiert einen Text in die richtige Groß-/Kleinschreibung; Anfangsbuchstabe in Großbuchstaben und andere Buchstaben in Kleinbuchstaben.",
"Cut": "Schneiden",
"Copy": "Kopieren",
"Paste": "Paste",
"PasteSpecial": "Spezielles einfügen",
"All": "Alle",
"Values": "Werte",
"Formats": "Formate",
"Font": "Schriftart",
"FontSize": "Schriftgröße",
"Bold": "Fett gedruckt",
"Italic": "Kursiv",
"Underline": "Unterstreichen",
"Strikethrough": "Durchgestrichen",
"TextColor": "Textfarbe",
"FillColor": "Füllfarbe",
"HorizontalAlignment": "Horizontale Ausrichtung",
"AlignLeft": "Linksbündig",
"AlignCenter": "Center",
"AlignRight": "Rechts ausrichten",
"VerticalAlignment": "Vertikale Ausrichtung",
"AlignTop": "Oben ausrichten",
"AlignMiddle": "Mitte ausrichten",
"AlignBottom": "Unten ausrichten",
"MergeCells": "Zellen verbinden",
"MergeAll": "Alle zusammenführen",
"MergeHorizontally": "Horizontal zusammenführen",
"MergeVertically": "Vertikal zusammenführen",
"Unmerge": "Zusammenführung aufheben",
"UnmergeCells": "Zellen trennen",
"SelectMergeType": "Wählen Sie Zusammenführungstyp aus",
"MergeCellsAlert": "Beim Zusammenführen von Zellen wird nur der Wert ganz oben links (Oberste) beibehalten. Trotzdem zusammenführen?",
"PasteMergeAlert": "Wir können das nicht mit einer zusammengeführten Zelle machen.",
"Borders": "Grenzen",
"TopBorders": "Obere Grenzen",
"LeftBorders": "Linke Grenzen",
"RightBorders": "Rechte Grenzen",
"BottomBorders": "Untere Grenzen",
"AllBorders": "Alle Grenzen",
"HorizontalBorders": "Horizontale Grenzen",
"VerticalBorders": "Vertikale Grenzen",
"OutsideBorders": "Außerhalb der Grenzen",
"InsideBorders": "Innere Grenzen",
"NoBorders": "Keine Grenzen",
"BorderColor": "Randfarbe",
"BorderStyle": "Rahmenstil",
"InsertFunction": "Funktion einfügen",
"Insert": "Einfügung",
"Delete": "Löschen",
"DuplicateSheet": "Duplikat",
"MoveRight": "Nach rechts bewegen",
"MoveLeft": "Geh nach links",
"Rename": "Umbenennen",
"Hide": "Ausblenden",
"NameBox": "Namensfeld",
"ShowHeaders": "Kopfzeilen anzeigen",
"HideHeaders": "Kopfzeilen ausblenden",
"ShowGridLines": "Rasterlinien anzeigen",
"HideGridLines": "Gitternetzlinien ausblenden",
"FreezePanes": "Fenster einfrieren",
"FreezeRows": "Zeilen einfrieren",
"FreezeColumns": "Spalten einfrieren",
"UnfreezePanes": "Fenster freigeben",
"UnfreezeRows": "Zeilen aufheben",
"UnfreezeColumns": "Spalten freigeben",
"AddSheet": "Blatt hinzufügen",
"ListAllSheets": "Alle Blätter auflisten",
"CollapseToolbar": "Symbolleiste einklappen",
"ExpandToolbar": "Erweitern Sie die Symbolleiste",
"CollapseFormulaBar": "Formelleiste minimieren",
"ExpandFormulaBar": "Formelleiste erweitern",
"File": "Datei",
"Home": "Heim",
"Formulas": "Formeln",
"View": "Aussicht",
"New": "Neu",
"Open": "Offen",
"SaveAs": "Speichern als",
"ExcelXlsx": "Microsoft Excel",
"ExcelXls": "Microsoft Excel 97-2003",
"CSV": "Komma-getrennte Werte",
"FormulaBar": "Formelleiste",
"Sort": "Sortieren",
"SortAscending": "Aufsteigend",
"SortDescending": "Absteigend",
"CustomSort": "Benutzerdefinierte Sortierung",
"AddColumn": "Spalte hinzufügen",
"ContainsHeader": "Daten enthalten Header",
"CaseSensitive": "Groß- und Kleinschreibung beachten",
"SortBy": "Sortieren nach",
"ThenBy": "Dann vorbei",
"SelectAColumn": "Wählen Sie eine Spalte aus",
"SortEmptyFieldError": "Für alle Sortierkriterien muss eine Spalte angegeben sein. Überprüfen Sie die ausgewählten Sortierkriterien und versuchen Sie es erneut.",
"SortDuplicateFieldError": " mehr als einmal nach Werten sortiert wird. Löschen Sie die doppelten Sortierkriterien und versuchen Sie es erneut.",
"SortOutOfRangeError": "Wählen Sie eine Zelle oder einen Bereich innerhalb des verwendeten Bereichs aus und versuchen Sie es erneut.",
"MultiRangeSortError": "Dies ist bei einer Mehrfachbereichsauswahl nicht möglich. Wählen Sie einen einzelnen Bereich aus und versuchen Sie es erneut.",
"HideRow": "Zeile ausblenden",
"HideRows": "Zeilen ausblenden",
"UnhideRows": "Zeilen einblenden",
"HideColumn": "Spalte ausblenden",
"HideColumns": "Spalten ausblenden",
"UnhideColumns": "Spalten einblenden",
"InsertRow": "Zeile einfügen",
"InsertRows": "Zeilen einfügen",
"Above": "Über",
"Below": "Unter",
"InsertColumn": "Spalte einfügen",
"InsertColumns": "Spalten einfügen",
"Before": "Vor",
"After": "Nach",
"DeleteRow": "Zeile löschen",
"DeleteRows": "Zeilen löschen",
"DeleteColumn": "Spalte löschen",
"DeleteColumns": "Spalten löschen",
"Ok": "OK",
"Cancel": "Absagen",
"Apply": "Sich bewerben",
"MoreColors": "Mehr Farben",
"StandardColors": "Standardfarben",
"General": "Allgemein",
"Number": "Nummer",
"Currency": "Währung",
"Accounting": "Buchhaltung",
"ShortDate": "Kurzes Date",
"LongDate": "Langes Datum",
"Time": "Zeit",
"Percentage": "Prozentsatz",
"Fraction": "Fraktion",
"Scientific": "Wissenschaftlich",
"Text": "Text",
"NumberFormat": "Zahlenformat",
"MobileFormulaBarPlaceHolder": "Wert oder Formel eingeben",
"PasteAlert": "Sie können dies hier nicht einfügen, da der Kopierbereich und der Einfügebereich nicht dieselbe Größe haben. Bitte versuchen Sie es in einem anderen Bereich einzufügen.",
"DestroyAlert": "Möchten Sie die aktuelle Arbeitsmappe wirklich löschen, ohne sie zu speichern, und eine neue Arbeitsmappe erstellen?",
"SheetRenameInvalidAlert": "Blattname enthält ungültige Zeichen.",
"SheetRenameEmptyAlert": "Blattname darf nicht leer sein.",
"SheetRenameAlreadyExistsAlert": "Blattname existiert bereits. Bitte geben Sie einen anderen Namen ein.",
"DeleteSheetAlert": "Möchten Sie dieses Tabellenblatt wirklich löschen?",
"DeleteSingleLastSheetAlert": "Eine Arbeitsmappe muss mindestens ein sichtbares Arbeitsblatt enthalten.",
"PickACategory": "Wählen Sie eine Kategorie aus",
"Description": "Beschreibung",
"UnsupportedFile": "Nicht unterstützte Datei",
"DataLimitExceeded": "Die Dateidaten sind zu groß und die Verarbeitung dauert länger. Möchten Sie fortfahren?",
"FileSizeLimitExceeded": "Die Datei ist zu groß und die Verarbeitung dauert länger. Möchten Sie fortfahren?",
"InvalidUrl": "ungültige URL",
"SUM": "Fügt eine Reihe von Zahlen und/oder Zellen hinzu.",
"SUMIF": "Fügt die Zellen basierend auf der angegebenen Bedingung hinzu.",
"SUMIFS": "Fügt die Zellen basierend auf angegebenen Bedingungen hinzu.",
"ABS": "Gibt den Wert einer Zahl ohne Vorzeichen zurück.",
"RAND": "Gibt eine Zufallszahl zwischen 0 und 1 zurück.",
"RANDBETWEEN": "Gibt basierend auf angegebenen Werten eine zufällige ganze Zahl zurück.",
"FLOOR": "Rundet eine Zahl auf das nächste Vielfache eines gegebenen Faktors ab.",
"CEILING": "Rundet eine Zahl auf das nächste Vielfache eines gegebenen Faktors auf.",
"PRODUCT": "Multipliziert eine Reihe von Zahlen und/oder Zellen.",
"AVERAGE": "Berechnet den Durchschnitt für die Reihe von Zahlen und/oder Zellen ohne Text.",
"AVERAGEIF": "Berechnet den Durchschnitt für die Zellen basierend auf dem angegebenen Kriterium.",
"AVERAGEIFS": "Berechnet den Durchschnitt für die Zellen basierend auf den angegebenen Bedingungen.",
"AVERAGEA": "Berechnet den Durchschnitt für die Zellen, die TRUE als 1, Text und FALSE als 0 auswerten.",
"COUNT": "Zählt die Zellen, die numerische Werte in einem Bereich enthalten.",
"COUNTIF": "Zählt die Zellen basierend auf der angegebenen Bedingung.",
"COUNTIFS": "Zählt die Zellen basierend auf angegebenen Bedingungen.",
"COUNTA": "Zählt die Zellen, die Werte in einem Bereich enthalten.",
"MIN": "Gibt die kleinste Anzahl der angegebenen Argumente zurück.",
"MAX": "Gibt die größte Anzahl der angegebenen Argumente zurück.",
"DATE": "Gibt das Datum basierend auf dem angegebenen Jahr, Monat und Tag zurück.",
"DAY": "Gibt den Tag aus dem angegebenen Datum zurück.",
"DAYS": "Gibt die Anzahl der Tage zwischen zwei Daten zurück.",
"IF": "Gibt einen Wert basierend auf dem angegebenen Ausdruck zurück.",
"IFS": "Gibt einen Wert basierend auf den angegebenen mehreren Ausdrücken zurück.",
"CalculateAND": "Gibt TRUE zurück, wenn alle Argumente TRUE sind, ansonsten FALSE.",
"CalculateOR": "Gibt TRUE zurück, wenn eines der Argumente TRUE ist, ansonsten FALSE.",
"IFERROR": "Gibt den Wert zurück, wenn kein Fehler gefunden wurde, sonst wird der angegebene Wert zurückgegeben.",
"CHOOSE": "Gibt einen Wert aus einer Werteliste basierend auf der Indexnummer zurück.",
"INDEX": "Gibt einen Wert der Zelle in einem bestimmten Bereich basierend auf der Zeilen- und Spaltennummer zurück.",
"FIND": "Gibt die Position einer Zeichenfolge innerhalb einer anderen Zeichenfolge zurück, wobei die Groß-/Kleinschreibung beachtet wird.",
"CONCATENATE": "Kombiniert zwei oder mehr Saiten miteinander.",
"CONCAT": "Verkettet eine Liste oder einen Bereich von Textzeichenfolgen.",
"SUBTOTAL": "Gibt die Zwischensumme für einen Bereich unter Verwendung der angegebenen Funktionsnummer zurück.",
"RADIANS": "Konvertiert Grad in Bogenmaß.",
"MATCH": "Gibt die relative Position eines angegebenen Werts im angegebenen Bereich zurück.",
"SLOPE": "Gibt die Steigung der Linie aus der linearen Regression der Datenpunkte zurück.",
"INTERCEPT": "Berechnet den Punkt der Y-Schnittlinie durch lineare Regression.",
"UNIQUE": "Gibt eindeutige Werte aus einem Bereich oder Array zurück",
"TEXT": "Konvertiert einen Wert in Text im angegebenen Zahlenformat.",
"DefineNameExists": "Dieser Name existiert bereits, versuchen Sie es mit einem anderen Namen.",
"CircularReference": "Wenn eine Formel auf einen oder mehrere Zirkelbezüge verweist, kann dies zu einer fehlerhaften Berechnung führen.",
"SORT": "Sortiert einen Bereich eines Arrays",
"T": "Überprüft, ob ein Wert Text ist oder nicht, und gibt den Text zurück.",
"EXACT": "Überprüft, ob zwei Textstrings genau gleich sind und gibt TRUE oder FALSE zurück.",
"LEN": "Gibt eine Anzahl von Zeichen in einer angegebenen Zeichenfolge zurück.",
"MOD": "Gibt einen Rest zurück, nachdem eine Zahl durch den Divisor dividiert wurde.",
"ODD": "Rundet eine positive Zahl auf und eine negative Zahl auf die nächste ungerade Ganzzahl ab.",
"PI": "Gibt den Wert von PI zurück.",
"COUNTBLANK": "Gibt die Anzahl leerer Zellen in einem angegebenen Zellbereich zurück.",
"EVEN": "Rundet eine positive Zahl auf und eine negative Zahl auf die nächste gerade Ganzzahl ab.",
"DECIMAL": "Konvertiert eine Textdarstellung einer Zahl mit einer bestimmten Basis in eine Dezimalzahl.",
"ADDRESS": "Gibt einen Zellbezug als Text zurück, wenn die angegebenen Zeilen- und Spaltennummern angegeben sind.",
"CHAR": "Gibt das Zeichen aus der angegebenen Zahl zurück.",
"CODE": "Gibt den numerischen Code für das erste Zeichen in einer angegebenen Zeichenfolge zurück.",
"DOLLAR": "Wandelt die Zahl in währungsformatierten Text um.",
"SMALL": "Gibt den k-ten kleinsten Wert in einem gegebenen Array zurück.",
"LARGE": "Gibt den k-größten Wert in einem gegebenen Array zurück.",
"TIME": "Konvertiert Stunden, Minuten, Sekunden in den zeitformatierten Text.",
"DEGREES": "Konvertiert Bogenmaß in Grad.",
"FACT": "Gibt die Fakultät einer Zahl zurück.",
"MEDIAN": "Gibt den Median der gegebenen Zahlenmenge zurück.",
"EDATE": "Gibt ein Datum mit der angegebenen Anzahl von Monaten vor oder nach dem angegebenen Datum zurück.",
"DATEVALUE": "Konvertiert eine Datumszeichenfolge in einen Datumswert.",
"NOW": "Gibt das aktuelle Datum und die Uhrzeit zurück.",
"HOUR": "Gibt die Anzahl der Stunden in einer angegebenen Zeitzeichenfolge zurück.",
"MINUTE": "Gibt die Anzahl der Minuten in einer angegebenen Zeitzeichenfolge zurück.",
"SECOND": "Gibt die Anzahl der Sekunden in einer angegebenen Zeitzeichenfolge zurück.",
"MONTH": "Gibt die Anzahl der Monate in einer angegebenen Datumszeichenfolge zurück.",
"OR": "ODER",
"AND": "UND",
"CustomFilterDatePlaceHolder": "Wählen Sie ein Datum",
"CustomFilterPlaceHolder": "Geben Sie den Wert ein",
"CustomFilter": "Benutzerdefinierte Filter",
"Between": "Zwischen",
"MatchCase": "Streichholzschachtel",
"DateTimeFilter": "DateTime-Filter",
"Undo": "Rückgängig machen",
"Redo": "Wiederholen",
"ClearAllFilter": "Klar",
"ReapplyFilter": "Bewerben Sie sich erneut",
"DateFilter": "Datumsfilter",
"TextFilter": "Textfilter",
"NumberFilter": "Zahlenfilter",
"ClearFilter": "Filter löschen",
"NoResult": "Keine Treffer gefunden",
"FilterFalse": "FALSCH",
"FilterTrue": "WAHR",
"Blanks": "Leerzeichen",
"SelectAll": "Wählen Sie Alle",
"GreaterThanOrEqual": "Größer als oder gleich",
"GreaterThan": "Größer als",
"LessThanOrEqual": "Weniger als oder gleich",
"LessThan": "Weniger als",
"NotEqual": "Nicht gleich",
"Equal": "Gleich",
"Contains": "Enthält",
"NotContains": "Enthält nicht",
"EndsWith": "Endet mit",
"NotEndsWith": "Endet nicht mit",
"StartsWith": "Beginnt mit",
"NotStartsWith": "Beginnt nicht mit",
"Like": "Wie",
"IsNull": "Null",
"NotNull": "Nicht null",
"IsEmpty": "Leer",
"IsNotEmpty": "Nicht leer",
"ClearButton": "Klar",
"FilterButton": "Filter",
"CancelButton": "Absagen",
"OKButton": "OK",
"Search": "Suche",
"DataValidation": "Datenvalidierung",
"CellRange": "Zellreichweite",
"Allow": "Erlauben",
"Data": "Daten",
"Minimum": "Minimum",
"Maximum": "Maximal",
"IgnoreBlank": "Leerzeichen ignorieren",
"WholeNumber": "Ganze Zahl",
"Decimal": "Dezimal",
"Date": "Datum",
"TextLength": "Textlänge",
"List": "Aufführen",
"NotBetween": "Nicht zwischen",
"EqualTo": "Gleicht",
"NotEqualTo": "Nicht gleichzusetzen mit",
"GreaterThanOrEqualTo": "Größer als oder gleich wie",
"LessThanOrEqualTo": "Weniger als oder gleich",
"InCellDropDown": "In-Cell-Dropdown",
"Sources": "Sources",
"Value": "Wert",
"Retry": "Wiederholen",
"DialogError": "Die Listenquelle muss ein Verweis auf eine einzelne Zeile oder Spalte sein.",
"MinMaxError": "Das Maximum muss größer oder gleich dem Minimum sein.",
"Spreadsheet": "Kalkulationstabelle",
"MoreValidation": "Diese Auswahl enthält mehr als eine Validierung. \n Aktuelle Einstellungen löschen und fortfahren?",
"FileNameError": "Ein Dateiname darf keine Zeichen wie \\ / : * ? \" < > [ ] |",
"ValidationError": "Dieser Wert entspricht nicht den für die Zelle definierten Datenüberprüfungseinschränkungen.",
"ListLengthError": "Die Listenwerte erlauben nur bis zu 256 Zeichen",
"ProtectSheet": "Schutzblatt",
"UnprotectSheet": "Blattschutz aufheben",
"SelectCells": "Wählen Sie gesperrte Zellen aus",
"SelectUnlockedCells": "Wählen Sie entsperrte Zellen aus",
"Save": "Speichern",
"EmptyFileName": "Der Dateiname darf nicht leer sein.",
"LargeName": "Der Name ist zu lang.",
"FormatCells": "Zellen formatieren",
"FormatRows": "Zeilen formatieren",
"FormatColumns": "Spalten formatieren",
"InsertLinks": "Verknüpfungen einfügen",
"ProtectContent": "Schützen Sie den Inhalt gesperrter Zellen",
"ProtectAllowUser": " Allen Benutzern dieses Arbeitsblatts Folgendes erlauben:",
"EditAlert": "Die Zelle, die Sie ändern möchten, ist geschützt. Heben Sie den Schutz des Blatts auf, um Änderungen vorzunehmen.",
"ClearValidation": "Klare Bestätigung",
"ISNUMBER": "Gibt true zurück, wenn der Wert als numerischer Wert analysiert wird.",
"ROUND": "Rundet eine Zahl auf eine angegebene Anzahl von Ziffern.",
"GEOMEAN": "Gibt den geometrischen Mittelwert eines Arrays oder Bereichs positiver Daten zurück.",
"POWER": "Gibt das Ergebnis einer potenzierten Zahl zurück",
"LOG": "Gibt den Logarithmus einer Zahl zur angegebenen Basis zurück.",
"TRUNC": "Gibt den abgeschnittenen Wert einer Zahl auf eine angegebene Anzahl von Dezimalstellen zurück.",
"EXP": "Gibt e potenziert mit der gegebenen Zahl zurück.",
"HighlightCellsRules": "Regeln für Zellen hervorheben",
"CFEqualTo": "Gleicht",
"TextThatContains": "Text, der enthält",
"ADateOccuring": "Ein auftretendes Datum",
"DuplicateValues": "Doppelte Werte",
"TopBottomRules": "Top/Bottom-Regeln",
"Top10Items": "Top 10 Artikel",
"Top10": "Top 10",
"Bottom10Items": "Unterste 10 Artikel",
"Bottom10": "Untere 10",
"AboveAverage": "Überdurchschnittlich",
"BelowAverage": "Unterdurchschnittlich",
"FormatCellsGreaterThan": "Zellen formatieren, die größer sind als:",
"FormatCellsLessThan": "Zellen formatieren, die kleiner sind als:",
"FormatCellsBetween": "Zellen formatieren zwischen:",
"FormatCellsEqualTo": "Zellen formatieren, die gleich sind:",
"FormatCellsThatContainTheText": "Zellen formatieren, die den Text enthalten:",
"FormatCellsThatContainADateOccurring": "Formatieren Sie Zellen, die ein Datum enthalten, das auftritt:",
"FormatCellsDuplicate": "Zellen formatieren, die Folgendes enthalten:",
"FormatCellsTop": "Zellen formatieren, die ganz oben stehen:",
"FormatCellsBottom": "Zellen formatieren, die ganz unten rangieren:",
"FormatCellsAbove": "Überdurchschnittliche Zellen formatieren:",
"FormatCellsBelow": "Unterdurchschnittliche Zellen formatieren:",
"With": "mit",
"DataBars": "Datenleisten",
"ColorScales": "Farbskalen",
"IconSets": "Icon-Sets",
"ClearRules": "Klare Regeln",
"SelectedCells": "Löschen Sie Regeln aus ausgewählten Zellen",
"EntireSheet": "Klare Regeln aus dem gesamten Blatt",
"LightRedFillWithDarkRedText": "Hellrote Füllung mit dunkelrotem Text",
"YellowFillWithDarkYellowText": "Gelbe Füllung mit dunkelgelbem Text",
"GreenFillWithDarkGreenText": "Grüne Füllung mit dunkelgrünem Text",
"RedFill": "Rote Füllung",
"RedText": "Roter Text",
"Duplicate": "Duplikat",
"Unique": "Einzigartig",
"And": "und",
"WebPage": "Website",
"ThisDocument": "Dieses Dokument",
"DisplayText": "Text anzeigen",
"Url": "URL",
"CellReference": "Zellbezug",
"DefinedNames": "Definierte Namen",
"EnterTheTextToDisplay": "Geben Sie den anzuzeigenden Text ein",
"EnterTheUrl": "Geben Sie die URL ein",
"INT": "Gibt eine Zahl bis zur nächsten ganzen Zahl zurück.",
"SUMPRODUCT": "Gibt die Summe des Produkts gegebener Bereiche von Arrays zurück.",
"TODAY": "Gibt das aktuelle Datum als Datumswert zurück.",
"ROUNDUP": "Rundet eine Zahl von Null weg.",
"LOOKUP": "Sucht nach einem Wert in einem einzeiligen oder einspaltigen Bereich und gibt dann einen Wert von derselben Position in einem zweiten einzeiligen oder einspaltigen Bereich zurück.",
"HLOOKUP": "Sucht nach einem Wert in der obersten Zeile des Wertearrays und gibt dann einen Wert in derselben Spalte aus einer von Ihnen angegebenen Zeile im Array zurück.",
"VLOOKUP": "Sucht nach einem bestimmten Wert in der ersten Spalte eines Suchbereichs und gibt einen entsprechenden Wert aus einer anderen Spalte innerhalb derselben Zeile zurück.",
"NOT": "Gibt die Umkehrung eines bestimmten logischen Ausdrucks zurück.",
"EOMONTH": "Gibt den letzten Tag des Monats zurück, der eine angegebene Anzahl von Monaten vor oder nach einem ursprünglich angegebenen Startdatum liegt.",
"SQRT": "Gibt die Quadratwurzel einer positiven Zahl zurück.",
"ROUNDDOWN": "Rundet eine Zahl ab, Richtung Null.",
"RSQ": "Gibt das Quadrat des Korrelationskoeffizienten des Pearson-Produktmoments basierend auf Datenpunkten in bekannten y- und x-Werten zurück.",
"Link": "Verknüpfung",
"Hyperlink": "Hyperlinks",
"EditHyperlink": "Hyperlink bearbeiten",
"OpenHyperlink": "Hyperlinks öffnen",
"RemoveHyperlink": "Hyperlinks entfernen",
"InvalidHyperlinkAlert": "Die Adresse dieser Website ist ungültig. Überprüfen Sie die Adresse und versuchen Sie es erneut.",
"InsertLink": "Verknüpfung einfügen",
"EditLink": "Verknüpfung bearbeiten",
"WrapText": "Zeilenumbruch",
"Update": "Aktualisieren",
"SortAndFilter": "Sortieren & Filtern",
"Filter": "Filter",
"FilterCellValue": "Nach Wert der ausgewählten Zelle filtern",
"FilterOutOfRangeError": "Wählen Sie eine Zelle oder einen Bereich innerhalb des verwendeten Bereichs aus und versuchen Sie es erneut.",
"ClearFilterFrom": "Filter löschen aus ",
"LN": "Gibt den natürlichen Logarithmus einer Zahl zurück.",
"DefineNameInValid": "Der eingegebene Name ist ungültig.",
"EmptyError": "Sie müssen einen Wert eingeben",
"ClearHighlight": "Klare Hervorhebung",
"HighlightInvalidData": "Markieren Sie ungültige Daten",
"Clear": "Klar",
"ClearContents": "Klarer Inhalt",
"ClearAll": "Alles löschen",
"ClearFormats": "Klare Formate",
"ClearHyperlinks": "Hyperlinks löschen",
"Image": "Bild",
"ConditionalFormatting": "Bedingte Formatierung",
"BlueDataBar": "Blaue Datenleiste",
"GreenDataBar": "Grüne Datenleiste",
"RedDataBar": "Rote Datenleiste",
"OrangeDataBar": "Orange Datenleiste",
"LightBlueDataBar": "Hellblauer Datenbalken",
"PurpleDataBar": "Lila Datenleiste",
"GYRColorScale": "Farbskala Grün - Gelb - Rot",
"RYGColorScale": "Farbskala Rot - Gelb - Grün",
"GWRColorScale": "Farbskala Grün - Weiß - Rot",
"RWGColorScale": "Farbskala Rot - Weiß - Grün",
"BWRColorScale": "Farbskala Blau - Weiß - Rot",
"RWBColorScale": "Farbskala Rot - Weiß - Blau",
"WRColorScale": "Farbskala Weiß - Rot",
"RWColorScale": "Farbskala Rot - Weiß",
"GWColorScale": "Farbskala Grün - Weiß",
"WGColorScale": "Weiß - Grüne Farbskala",
"GYColorScale": "Farbskala Grün - Gelb",
"YGColorScale": "Farbskala Gelb - Grün",
"ThreeArrowsColor": "3 Pfeile (farbig)",
"ThreeArrowsGray": "3 Pfeile (grau)",
"ThreeTriangles": "3 Dreiecke",
"FourArrowsColor": "4 Pfeile (grau)",
"FourArrowsGray": "4 Pfeile (farbig)",
"FiveArrowsColor": "5 Pfeile (grau)",
"FiveArrowsGray": "5 Pfeile (farbig)",
"ThreeTrafficLights1": "3 Ampeln (ohne Rahmen)",
"ThreeTrafficLights2": "3 Ampeln (umrandet)",
"ThreeSigns": "3 Zeichen",
"FourTrafficLights": "4 Ampeln",
"RedToBlack": "Rot zu Schwarz",
"ThreeSymbols1": "3 Symbole (eingekreist)",
"ThreeSymbols2": "3 Symbole (nicht eingekreist)",
"ThreeFlags": "3 Fahnen",
"ThreeStars": "3 Sterne",
"FourRatings": "4 Bewertungen",
"FiveQuarters": "5 Quartale",
"FiveRatings": "5 Bewertungen",
"FiveBoxes": "5 Kisten",
"Chart": "Diagramm",
"Column": "Spalte",
"Bar": "Bar",
"Area": "Bereich",
"Pie": "Kuchen",
"Doughnut": "Krapfen",
"PieAndDoughnut": "Kuchen/Donut",
"Line": "Linie",
"Radar": "Radar",
"Scatter": "Streuen",
"ChartDesign": "Diagrammdesign",
"ClusteredColumn": "Gruppierte Spalte",
"StackedColumn": "Gestapelte Spalte",
"StackedColumn100": "100 % gestapelte Spalte",
"ClusteredBar": "Geclusterte Bar",
"StackedBar": "Gestapelte Leiste",
"StackedBar100": "100 % gestapelter Balken",
"StackedArea": "Gestapelter Bereich",
"StackedArea100": "100 % gestapelter Bereich",
"StackedLine": "Gestapelte Linie",
"StackedLine100": "100 % gestapelte Linie",
"LineMarker": "Linie mit Markierungen",
"StackedLineMarker": "Gestapelte Linie mit Markierungen",
"StackedLine100Marker": "100 % gestapelte Linie mit Markierungen",
"AddChartElement": "Diagrammelement hinzufügen",
"Axes": "Achsen",
"AxisTitle": "Achsentitel",
"ChartTitle": "Diagrammtitel",
"DataLabels": "Datenaufkleber",
"Gridlines": "Gitternetzlinien",
"Legends": "Legenden",
"PrimaryHorizontal": "Primäre Horizontale",
"PrimaryVertical": "Primäre Vertikale",
"None": "Keiner",
"AboveChart": "Oben Diagramm",
"Center": "Center",
"InsideEnd": "Inneres Ende",
"InsideBase": "Basis innen",
"OutsideEnd": "Äußeres Ende",
"PrimaryMajorHorizontal": "Grundlegende große horizontale",
"PrimaryMajorVertical": "Primäre Hauptvertikale",
"PrimaryMinorHorizontal": "Primäre Minor horizontal",
"PrimaryMinorVertical": "Primäre kleine Vertikale",
"Right": "Recht",
"Left": "Links",
"Bottom": "Unterseite",
"Top": "oben",
"SwitchRowColumn": "Zeile/Spalte wechseln",
"ChartTheme": "Diagrammthema",
"ChartType": "Diagramm Typ",
"Material": "Material",
"Fabric": "Stoff",
"Bootstrap": "Bootstrap",
"HighContrastLight": "Kontrastreiches Licht",
"MaterialDark": "Material dunkel",
"FabricDark": "Stoff dunkel",
"HighContrast": "Hoher Kontrast",
"BootstrapDark": "Bootstrap dunkel",
"Bootstrap4": "Bootstrap4",
"Bootstrap5Dark": "Bootstrap5 Dunkel",
"Bootstrap5": "Bootstrap5",
"Tailwind": "Rückenwind",
"TailwindDark": "Rückenwind Dunkel",
"VerticalAxisTitle": "Titel der vertikalen Achse",
"HorizontalAxisTitle": "Titel der horizontalen Achse",
"EnterTitle": "Titel eingeben",
"UnprotectWorksheet": "Blattschutz aufheben",
"ReEnterPassword": "Geben Sie das Passwort erneut ein, um fortzufahren",
"SheetPassword": "Passwort zum Aufheben des Blattschutzes:",
"ProtectWorkbook": "Arbeitsmappe schützen",
"Password": "Passwort (optional):",
"EnterThePassword": "Geben Sie das Passwort ein",
"ConfirmPassword": "Passwort bestätigen",
"EnterTheConfirmPassword": "Wiederhole die Eingabe deines Passwortes",
"PasswordAlert": "Bestätigungspasswort ist nicht identisch",
"UnprotectWorkbook": "Schutz der Arbeitsmappe aufheben",
"UnprotectPasswordAlert": "Das eingegebene Passwort ist nicht korrekt.",
"IncorrectPassword": "Die Datei oder das Arbeitsblatt kann mit dem angegebenen Passwort nicht geöffnet werden",
"PasswordAlertMsg": "Bitte geben Sie das Passwort ein",
"ConfirmPasswordAlertMsg": "Bitte geben Sie das Bestätigungspasswort ein",
"IsProtected": "ist geschützt",
"PDF": "PDF Document",
"AutoFillMergeAlertMsg": "Dazu müssen alle verbundenen Zellen dieselbe Größe haben.",
"Fluent": "Fließend",
"FluentDark": "Fließendes Dunkel",
"Custom": "Brauch",
"WEEKDAY": "Gibt den Wochentag zurück, der einem Datum entspricht.",
"FillSeries": "Serie füllen",
"CopyCells": "Zellen kopieren",
"FillFormattingOnly": "Nur Formatierung ausfüllen",
"FillWithoutFormatting": "Ohne Formatierung ausfüllen",
"CustomFormat": "Benutzerdefinierte Zahlenformate",
"CustomFormatPlaceholder": "Geben Sie ein benutzerdefiniertes Format ein oder wählen Sie es aus",
"CustomFormatTypeList": "Typ",
"CellReferenceTypoError": "Wir haben einen Tippfehler in Ihrem Zellbezug gefunden. Möchten Sie diesen Verweis wie folgt korrigieren?",
"Close": "Schließen",
"MoreOptions": "Mehr Optionen",
"AddCurrentSelection": "Aktuelle Auswahl zum Filter hinzufügen",
"ExternalWorkbook": "Eine importierte Excel-Datei enthält eine externe Arbeitsmappenreferenz. Möchten Sie diese Datei importieren?",
"Directional": "Gerichtet",
"Shapes": "Formen",
"Indicators": "Indikatoren",
"Ratings": "Bewertungen",
"Material3": "Material 3",
"Material3Dark": "Material 3 Dunkel",
"InvalidFormulaError": "Wir haben festgestellt, dass Sie eine ungültige Formel eingegeben haben.",
"InvalidArguments": "Wir haben festgestellt, dass Sie eine Formel mit ungültigen Argumenten eingegeben haben.",
"EmptyExpression": "Wir haben festgestellt, dass Sie eine Formel mit einem leeren Ausdruck eingegeben haben.",
"MismatchedParenthesis": "Wir haben festgestellt, dass Sie eine Formel eingegeben haben, bei der eine oder mehrere öffnende oder schließende Klammern fehlten.",
"ImproperFormula": "Wir haben festgestellt, dass Sie eine Formel eingegeben haben, die falsch ist.",
"WrongNumberOfArguments": "Wir haben festgestellt, dass Sie eine Formel mit einer falschen Anzahl von Argumenten eingegeben haben.",
"Requires3Arguments": "Wir haben festgestellt, dass Sie eine Formel eingegeben haben, die drei Argumente erfordert.",
"MismatchedStringQuotes": "Wir haben festgestellt, dass Sie eine Formel mit nicht übereinstimmenden Anführungszeichen eingegeben haben.",
"FormulaCircularRef": "Wir haben festgestellt, dass Sie eine Formel mit einem Zirkelbezug eingegeben haben."
}
}
}export let data = [
{
"Item Code": "I231",
"Item Name": "Chinese Combo Noodle",
"Quantity": 2,
"Rate": 125,
"Amount": "=PRODUCT(C2;D2)"
},
{
"Item Code": "I245",
"Item Name": "Chinese Combo Rice",
"Quantity": 3,
"Rate": 125,
"Amount": "=PRODUCT(C3;D3)"
},
{
"Item Code": "I237",
"Item Name": "Amritsari Chola",
"Quantity": 2,
"Rate": 225,
"Amount": "=PRODUCT(C4;D4)"
},
{
"Item Code": "I291",
"Item Name": "Asian Mixed Entree Platt",
"Quantity": 3,
"Rate": 165,
"Amount": "=PRODUCT(C5;D5)"
},
{
"Item Code": "I268",
"Item Name": "Chinese Combo Chicken",
"Quantity": 3,
"Rate": 125,
"Amount": "=PRODUCT(C6;D6)"
},
{
"Item Code": "I251",
"Item Name": "Chivas Regal",
"Quantity": 1,
"Rate": 325,
"Amount": "=PRODUCT(C7;D7)"
},
{
"Item Code": "I256",
"Item Name": "Chicken Drumsticks",
"Quantity": 2,
"Rate": 180,
"Amount": "=PRODUCT(C8;D8)"
},
{
"Item Code": "I232",
"Item Name": "Manchow Soup",
"Quantity": 2,
"Rate": 160,
"Amount": "=PRODUCT(C9;D9)"
},
{
"Item Code": "I290",
"Item Name": "Schezuan Chicken",
"Quantity": 3,
"Rate": 180,
"Amount": "=PRODUCT(C10;D10)"
},
{
"Item Code": "I229",
"Item Name": "Manchow Soup",
"Quantity": 2,
"Rate": 125,
"Amount": "=PRODUCT(C11;D11)"
},
{
"Item Code": "I239",
"Item Name": "Jw Black Lable",
"Quantity": 2,
"Rate": 175,
"Amount": "=PRODUCT(C12;D12)"
}
];export let data: Object[] = [
{
"Item Code": "I231",
"Item Name": "Chinese Combo Noodle",
"Quantity": 2,
"Rate": 125,
"Amount": "=PRODUCT(C2;D2)"
},
{
"Item Code": "I245",
"Item Name": "Chinese Combo Rice",
"Quantity": 3,
"Rate": 125,
"Amount": "=PRODUCT(C3;D3)"
},
{
"Item Code": "I237",
"Item Name": "Amritsari Chola",
"Quantity": 2,
"Rate": 225,
"Amount": "=PRODUCT(C4;D4)"
},
{
"Item Code": "I291",
"Item Name": "Asian Mixed Entree Platt",
"Quantity": 3,
"Rate": 165,
"Amount": "=PRODUCT(C5;D5)"
},
{
"Item Code": "I268",
"Item Name": "Chinese Combo Chicken",
"Quantity": 3,
"Rate": 125,
"Amount": "=PRODUCT(C6;D6)"
},
{
"Item Code": "I251",
"Item Name": "Chivas Regal",
"Quantity": 1,
"Rate": 325,
"Amount": "=PRODUCT(C7;D7)"
},
{
"Item Code": "I256",
"Item Name": "Chicken Drumsticks",
"Quantity": 2,
"Rate": 180,
"Amount": "=PRODUCT(C8;D8)"
},
{
"Item Code": "I232",
"Item Name": "Manchow Soup",
"Quantity": 2,
"Rate": 160,
"Amount": "=PRODUCT(C9;D9)"
},
{
"Item Code": "I290",
"Item Name": "Schezuan Chicken",
"Quantity": 3,
"Rate": 180,
"Amount": "=PRODUCT(C10;D10)"
},
{
"Item Code": "I229",
"Item Name": "Manchow Soup",
"Quantity": 2,
"Rate": 125,
"Amount": "=PRODUCT(C11;D11)"
},
{
"Item Code": "I239",
"Item Name": "Jw Black Lable",
"Quantity": 2,
"Rate": 175,
"Amount": "=PRODUCT(C12;D12)"
}
];Create User Defined Functions / Custom Functions
The Spreadsheet includes a number of built-in formulas. For your convenience, a list of supported formulas can be found here.
You can define and use an unsupported formula, i.e. a user defined/custom formula, in the spreadsheet by using the addCustomFunction function. Meanwhile, remember that you should define a user defined/custom formula whose results should only return a single value. If a user-defined/custom formula returns an array, it will be time-consuming to update adjacent cell values.
The following code example shows an unsupported formula in the spreadsheet.
import * as React from 'react';
import { createRoot } from 'react-dom/client';
import { SpreadsheetComponent, SheetsDirective, SheetDirective, RangesDirective, RowsDirective, RowDirective, CellDirective, CellsDirective } from '@syncfusion/ej2-react-spreadsheet';
import { RangeDirective, ColumnsDirective, ColumnDirective } from '@syncfusion/ej2-react-spreadsheet';
import { data } from './datasource';

function App() {
    const spreadsheetRef = React.useRef(null);
    const styles = { textAlign: 'center', fontWeight: 'bold', verticalAlign: 'middle', fontStyle: 'italic', fontSize: '15pt' };
    const cellStyle = { fontStyle: 'italic', fontWeight: 'bold' };
    const fontStyle = { fontWeight: 'bold', textAlign: 'right' };
    // Custom function to calculate percentage between two cell values.
    const calculatePercentage = (firstCell, secondCell) => {
        return Number(firstCell) / Number(secondCell);
    };
    // Custom function to calculate round down for values.
    const roundDownHandler = (value, digit) => {
        let multiplier = Math.pow(10, digit);
        return Math.floor(value * multiplier) / multiplier;
    }
    React.useEffect(() => {
        let spreadsheet = spreadsheetRef.current;
        if (spreadsheet) {
            spreadsheet.cellFormat({ fontWeight: 'bold', textAlign: 'center' }, 'A2:F2');
            spreadsheet.numberFormat('$#,##0', 'B3:D12');
            spreadsheet.numberFormat('0%', 'E3:E12');
            // Adding custom function for calculating the percentage between two cells.
            spreadsheet.addCustomFunction(calculatePercentage, 'PERCENTAGE');
            // Adding custom function for calculating round down for the value.
            spreadsheet.addCustomFunction(roundDownHandler, 'ROUNDDOWN');
            // Calculate percentage using custom added formula in E12 cell.
            spreadsheet.updateCell({ formula: '=PERCENTAGE(C12,D12)' }, 'E12');
            // Calculate round down for average values using custom added formula in F12 cell.
            spreadsheet.updateCell({ formula: '=ROUNDDOWN(F11,1)' }, 'F12');
        }
    }, []);

    return (<div>
        <SpreadsheetComponent ref={spreadsheetRef} showSheetTabs={false} showRibbon={false}>
            <SheetsDirective>
                <SheetDirective>
                    <RowsDirective>
                        <RowDirective height={40} customHeight={true}>
                            <CellsDirective>
                                <CellDirective value={'Monthly Expense'} style={styles} colSpan={5}></CellDirective>
                            </CellsDirective>
                        </RowDirective>
                        <RowDirective height={30}></RowDirective>
                        <RowDirective index={11}>
                            <CellsDirective>
                                <CellDirective value={'Totals'} style={cellStyle}></CellDirective>
                                <CellDirective formula={'=SUM(B3:B11)'} ></CellDirective>
                                <CellDirective formula={'=SUM(C3:C11)'}></CellDirective>
                                <CellDirective formula={'=SUM(D3:D11)'}></CellDirective>
                            </CellsDirective>
                        </RowDirective>
                        <RowDirective>
                            <CellsDirective>
                                <CellDirective index={1} value={'Number of Categories'} style={fontStyle} colSpan={2}></CellDirective>
                                <CellDirective formula={'=COUNTA(A3:A11)'} index={3}></CellDirective>
                            </CellsDirective>
                        </RowDirective>
                        <RowDirective>
                            <CellsDirective>
                                <CellDirective index={1} value={'Average Spend'} style={fontStyle} colSpan={2}></CellDirective>
                                <CellDirective formula={'=AVERAGE(B3:B11)'} index={3} format={'$#,##0'}></CellDirective>
                            </CellsDirective>
                        </RowDirective>
                        <RowDirective>
                            <CellsDirective>
                                <CellDirective index={1} value={'Min Spend'} style={fontStyle} colSpan={2}></CellDirective>
                                <CellDirective formula={"=MIN(B3:B11)"} index={3} format={'$#,##0'}></CellDirective>
                            </CellsDirective>
                        </RowDirective>
                        <RowDirective>
                            <CellsDirective>
                                <CellDirective index={1} value={'Max Spend'} style={fontStyle} colSpan={2}></CellDirective>
                                <CellDirective formula={"=MAX(B3:B11)"} index={3} format={'$#,##0'}></CellDirective>
                            </CellsDirective>
                        </RowDirective>
                    </RowsDirective>
                    <RangesDirective>
                        <RangeDirective dataSource={data} startCell={"A2"}></RangeDirective>
                    </RangesDirective>
                    <ColumnsDirective>
                        <ColumnDirective width={150}></ColumnDirective>
                        <ColumnDirective width={120}></ColumnDirective>
                        <ColumnDirective width={120}></ColumnDirective>
                        <ColumnDirective width={120}></ColumnDirective>
                        <ColumnDirective width={140}></ColumnDirective>
                        <ColumnDirective width={150}></ColumnDirective>
                    </ColumnsDirective>
                </SheetDirective>
            </SheetsDirective>
        </SpreadsheetComponent> </div>
    );
};
export default App;

const root = createRoot(document.getElementById('root'));
root.render(<App />);
import * as React from 'react';
import { createRoot } from 'react-dom/client';
import { SpreadsheetComponent, SheetsDirective, SheetDirective, RangesDirective, RowsDirective, RowDirective, CellDirective, CellsDirective } from '@syncfusion/ej2-react-spreadsheet';
import { RangeDirective, ColumnsDirective, ColumnDirective } from '@syncfusion/ej2-react-spreadsheet';
import { CellStyleModel } from '@syncfusion/ej2-react-spreadsheet';
import { data } from './datasource';
function App() {
const spreadsheetRef = React.useRef<SpreadsheetComponent>(null);
const styles: CellStyleModel = { textAlign: 'center', fontWeight: 'bold', verticalAlign: 'middle', fontStyle: 'italic', fontSize: '15pt' };
const cellStyle: CellStyleModel = { fontStyle: 'italic', fontWeight: 'bold' };
const fontStyle: CellStyleModel = { fontWeight: 'bold', textAlign: 'right' };
// Custom function to calculate percentage between two cell values.
const calculatePercentage = (firstCell: string, secondCell: string): number => {
return Number(firstCell) / Number(secondCell);
};
// Custom function to calculate round down for values.
const roundDownHandler = (value: number, digit: number) => {
let multiplier: number = Math.pow(10, digit);
return Math.floor(value * multiplier) / multiplier;
}
React.useEffect(() => {
let spreadsheet = spreadsheetRef.current;
if (spreadsheet) {
spreadsheet.cellFormat({ fontWeight: 'bold', textAlign: 'center' }, 'A2:F2');
spreadsheet.numberFormat('$#,##0', 'B3:D12');
spreadsheet.numberFormat('0%', 'E3:E12');
// Adding custom function for calculating the percentage between two cells.
spreadsheet.addCustomFunction(calculatePercentage, 'PERCENTAGE');
// Adding custom function for calculating round down for the value.
spreadsheet.addCustomFunction(roundDownHandler, 'ROUNDDOWN');
// Calculate percentage using custom added formula in E12 cell.
spreadsheet.updateCell({ formula: '=PERCENTAGE(C12,D12)' }, 'E12');
// Calculate round down for average values using custom added formula in F12 cell.
spreadsheet.updateCell({ formula: '=ROUNDDOWN(F11,1)' }, 'F12');
}
}, []);
return (<div>
<SpreadsheetComponent ref={spreadsheetRef} showSheetTabs={false} showRibbon={false}>
<SheetsDirective>
<SheetDirective>
<RowsDirective>
<RowDirective height={40} customHeight={true}>
<CellsDirective>
<CellDirective value={'Monthly Expense'} style={styles} colSpan={5}></CellDirective>
</CellsDirective>
</RowDirective>
<RowDirective height={30}></RowDirective>
<RowDirective index={11}>
<CellsDirective>
<CellDirective value={'Totals'} style={cellStyle}></CellDirective>
<CellDirective formula={'=SUM(B3:B11)'} ></CellDirective>
<CellDirective formula={'=SUM(C3:C11)'}></CellDirective>
<CellDirective formula={'=SUM(D3:D11)'}></CellDirective>
</CellsDirective>
</RowDirective>
<RowDirective>
<CellsDirective>
<CellDirective index={1} value={'Number of Categories'} style={fontStyle} colSpan={2}></CellDirective>
<CellDirective formula={'=COUNTA(A3:A11)'} index={3}></CellDirective>
</CellsDirective>
</RowDirective>
<RowDirective>
<CellsDirective>
<CellDirective index={1} value={'Average Spend'} style={fontStyle} colSpan={2}></CellDirective>
<CellDirective formula={'=AVERAGE(B3:B11)'} index={3} format={'$#,##0'}></CellDirective>
</CellsDirective>
</RowDirective>
<RowDirective>
<CellsDirective>
<CellDirective index={1} value={'Min Spend'} style={fontStyle} colSpan={2}></CellDirective>
<CellDirective formula={"=MIN(B3:B11)"} index={3} format={'$#,##0'}></CellDirective>
</CellsDirective>
</RowDirective>
<RowDirective>
<CellsDirective>
<CellDirective index={1} value={'Max Spend'} style={fontStyle} colSpan={2}></CellDirective>
<CellDirective formula={"=MAX(B3:B11)"} index={3} format={'$#,##0'}></CellDirective>
</CellsDirective>
</RowDirective>
</RowsDirective>
<RangesDirective>
<RangeDirective dataSource={data} startCell={"A2"}></RangeDirective>
</RangesDirective>
<ColumnsDirective>
<ColumnDirective width={150}></ColumnDirective>
<ColumnDirective width={120}></ColumnDirective>
<ColumnDirective width={120}></ColumnDirective>
<ColumnDirective width={120}></ColumnDirective>
<ColumnDirective width={140}></ColumnDirective>
<ColumnDirective width={150}></ColumnDirective>
</ColumnsDirective>
</SheetDirective>
</SheetsDirective>
</SpreadsheetComponent> </div>
);
};
export default App;
const root = createRoot(document.getElementById('root')!);
root.render(<App />);/**
* Formula data source
*/
export let data = [
{
'Category': 'Household Utilities',
'Monthly Spend': '=C3/12',
'Annual Spend': 3000,
'Last Year Spend': 3000,
'Percentage Change': '=C3/D3', // You can set the expression or formula as string
'Average Change': '=7.9/E3',
},
{
'Category': 'Food',
'Monthly Spend': '=C4/12',
'Annual Spend': 2500,
'Last Year Spend': 2250,
'Percentage Change': { formula: '=C4/D4' }, // You can also set as object with formula field
'Average Change': '=7.9/E4',
},
{
'Category': 'Gasoline',
'Monthly Spend': '=C5/12',
'Annual Spend': 1500,
'Last Year Spend': 1200,
'Percentage Change': { formula: '=C5/D5' },
'Average Change': '=7.9/E5',
},
{
'Category': 'Clothes',
'Monthly Spend': '=C6/12',
'Annual Spend': 1200,
'Last Year Spend': 1000,
'Percentage Change': '=C6/D6',
'Average Change': '=7.9/E6',
},
{
'Category': 'Insurance',
'Monthly Spend': '=C7/12',
'Annual Spend': 1500,
'Last Year Spend': 1500,
'Percentage Change': '=C7/D7',
'Average Change': '=7.9/E7',
},
{
'Category': 'Taxes',
'Monthly Spend': '=C8/12',
'Annual Spend': 3500,
'Last Year Spend': 3500,
'Percentage Change': '=C8/D8',
'Average Change': '=7.9/E8',
},
{
'Category': 'Entertainment',
'Monthly Spend': '=C9/12',
'Annual Spend': 2000,
'Last Year Spend': 2250,
'Percentage Change': '=C9/D9',
'Average Change': '=7.9/E9',
},
{
'Category': 'Vacation',
'Monthly Spend': '=C10/12',
'Annual Spend': 1500,
'Last Year Spend': 2000,
'Percentage Change': '=C10/D10',
'Average Change': '=7.9/E10',
},
{
'Category': 'Miscellaneous',
'Monthly Spend': '=C11/12',
'Annual Spend': 1250,
'Last Year Spend': 1558,
'Percentage Change': '=C11/D11',
'Average Change': '=7.9/E11',
}
];/**
* Formula data source
*/
export let data: Object[] = [
{
'Category': 'Household Utilities',
'Monthly Spend': '=C3/12', // Setting formula through data binding
'Annual Spend': 3000,
'Last Year Spend': 3000,
'Percentage Change': '=C3/D3', // You can set the expression or formula as string
'Average Change': '=7.9/E3',
},
{
'Category': 'Food',
'Monthly Spend': '=C4/12',
'Annual Spend': 2500,
'Last Year Spend': 2250,
'Percentage Change': { formula: '=C4/D4' }, // You can also set as object with formula field
'Average Change': '=7.9/E4',
},
{
'Category': 'Gasoline',
'Monthly Spend': '=C5/12',
'Annual Spend': 1500,
'Last Year Spend': 1200,
'Percentage Change': { formula: '=C5/D5' },
'Average Change': '=7.9/E5',
},
{
'Category': 'Clothes',
'Monthly Spend': '=C6/12',
'Annual Spend': 1200,
'Last Year Spend': 1000,
'Percentage Change': '=C6/D6',
'Average Change': '=7.9/E6',
},
{
'Category': 'Insurance',
'Monthly Spend': '=C7/12',
'Annual Spend': 1500,
'Last Year Spend': 1500,
'Percentage Change': '=C7/D7',
'Average Change': '=7.9/E7',
},
{
'Category': 'Taxes',
'Monthly Spend': '=C8/12',
'Annual Spend': 3500,
'Last Year Spend': 3500,
'Percentage Change': '=C8/D8',
'Average Change': '=7.9/E8',
},
{
'Category': 'Entertainment',
'Monthly Spend': '=C9/12',
'Annual Spend': 2000,
'Last Year Spend': 2250,
'Percentage Change': '=C9/D9',
'Average Change': '=7.9/E9',
},
{
'Category': 'Vacation',
'Monthly Spend': '=C10/12',
'Annual Spend': 1500,
'Last Year Spend': 2000,
'Percentage Change': '=C10/D10',
'Average Change': '=7.9/E10',
},
{
'Category': 'Miscellaneous',
'Monthly Spend': '=C11/12',
'Annual Spend': 1250,
'Last Year Spend': 1558,
'Percentage Change': '=C11/D11',
'Average Change': '=7.9/E11',
},
];Second, if you want to directly compute any formula or expression, you can use the computeExpression method. This method will work for both built-in and used-defined/custom formula.
The following code example shows how to use computeExpression method in the spreadsheet.
import * as React from 'react';
import { createRoot } from 'react-dom/client';
import { SpreadsheetComponent, SheetsDirective, SheetDirective, RangesDirective, RowsDirective, RowDirective, CellDirective, CellsDirective } from '@syncfusion/ej2-react-spreadsheet';
import { RangeDirective, ColumnsDirective, ColumnDirective } from '@syncfusion/ej2-react-spreadsheet';
import { data } from './datasource';

function App() {
    const spreadsheetRef = React.useRef(null);
    const styles = { textAlign: 'center', fontWeight: 'bold', verticalAlign: 'middle', fontStyle: 'italic', fontSize: '15pt' };
    const cellStyle = { fontStyle: 'italic', fontWeight: 'bold' };
    const fontStyle = { fontWeight: 'bold', textAlign: 'right' };
    // Custom function to calculate percentage between two cell values.
    const calculatePercentage = (firstCell, secondCell) => {
        return Number(firstCell) / Number(secondCell);
    };
    React.useEffect(() => {
        let spreadsheet = spreadsheetRef.current;
        if (spreadsheet) {
            spreadsheet.cellFormat({ fontWeight: 'bold', textAlign: 'center' }, 'A2:E2');
            spreadsheet.numberFormat('$#,##0', 'B3:D12');
            spreadsheet.numberFormat('0%', 'E3:E12');
            // Adding custom function for calculating the percentage between two cells.
            spreadsheet.addCustomFunction(calculatePercentage, 'PERCENTAGE');
            // Calculate percentage using custom added formula in E11 cell.
            spreadsheet.updateCell({ formula: '=PERCENTAGE(C11,D11)' }, 'E11');
            // Calculate expressions using computeExpression in E10 cell.
            spreadsheet.updateCell({ value: spreadsheet.computeExpression('C10/D10') }, 'E10');
            // Calculate custom formula values using computeExpression in E12 cell.
            spreadsheet.updateCell({ value: spreadsheet.computeExpression('=PERCENTAGE(C12,D12)') }, 'E12');
            // Calculate SUM (built-in) formula values using computeExpression in D12 cell.
            spreadsheet.updateCell({ value: spreadsheet.computeExpression('=SUM(D3:D11)') }, 'D12');
        }
    }, []);

    return (<div>
        <SpreadsheetComponent ref={spreadsheetRef} showSheetTabs={false} showRibbon={false}>
            <SheetsDirective>
                <SheetDirective>
                    <RowsDirective>
                        <RowDirective height={40} customHeight={true}>
                            <CellsDirective>
                                <CellDirective value={'Monthly Expense'} style={styles} colSpan={5}></CellDirective>
                            </CellsDirective>
                        </RowDirective>
                        <RowDirective height={30}></RowDirective>
                        <RowDirective index={11}>
                            <CellsDirective>
                                <CellDirective value={'Totals'} style={cellStyle}></CellDirective>
                                <CellDirective formula={'=SUM(B3:B11)'} ></CellDirective>
                                <CellDirective formula={'=SUM(C3:C11)'}></CellDirective>
                                <CellDirective formula={'=SUM(D3:D11)'}></CellDirective>
                            </CellsDirective>
                        </RowDirective>
                        <RowDirective>
                            <CellsDirective>
                                <CellDirective index={1} value={'Number of Categories'} style={fontStyle} colSpan={2}></CellDirective>
                                <CellDirective formula={'=COUNTA(A3:A11)'} index={3}></CellDirective>
                            </CellsDirective>
                        </RowDirective>
                        <RowDirective>
                            <CellsDirective>
                                <CellDirective index={1} value={'Average Spend'} style={fontStyle} colSpan={2}></CellDirective>
                                <CellDirective formula={'=AVERAGE(B3:B11)'} index={3} format={'$#,##0'}></CellDirective>
                            </CellsDirective>
                        </RowDirective>
                        <RowDirective>
                            <CellsDirective>
                                <CellDirective index={1} value={'Min Spend'} style={fontStyle} colSpan={2}></CellDirective>
                                <CellDirective formula={"=MIN(B3:B11)"} index={3} format={'$#,##0'}></CellDirective>
                            </CellsDirective>
                        </RowDirective>
                        <RowDirective>
                            <CellsDirective>
                                <CellDirective index={1} value={'Max Spend'} style={fontStyle} colSpan={2}></CellDirective>
                                <CellDirective formula={"=MAX(B3:B11)"} index={3} format={'$#,##0'}></CellDirective>
                            </CellsDirective>
                        </RowDirective>
                    </RowsDirective>
                    <RangesDirective>
                        <RangeDirective dataSource={data} startCell={"A2"}></RangeDirective>
                    </RangesDirective>
                    <ColumnsDirective>
                        <ColumnDirective width={150}></ColumnDirective>
                        <ColumnDirective width={120}></ColumnDirective>
                        <ColumnDirective width={120}></ColumnDirective>
                        <ColumnDirective width={120}></ColumnDirective>
                        <ColumnDirective width={120}></ColumnDirective>
                        <ColumnDirective width={120}></ColumnDirective>
                    </ColumnsDirective>
                </SheetDirective>
            </SheetsDirective>
        </SpreadsheetComponent> </div>
    );
};
export default App;

const root = createRoot(document.getElementById('root'));
root.render(<App />);
import * as React from 'react';
import { createRoot } from 'react-dom/client';
import { SpreadsheetComponent, SheetsDirective, SheetDirective, RangesDirective, RowsDirective, RowDirective, CellDirective, CellsDirective } from '@syncfusion/ej2-react-spreadsheet';
import { RangeDirective, ColumnsDirective, ColumnDirective } from '@syncfusion/ej2-react-spreadsheet';
import { CellStyleModel } from '@syncfusion/ej2-react-spreadsheet';
import { data } from './datasource';
function App() {
const spreadsheetRef = React.useRef<SpreadsheetComponent>(null);
const styles: CellStyleModel = { textAlign: 'center', fontWeight: 'bold', verticalAlign: 'middle', fontStyle: 'italic', fontSize: '15pt' };
const cellStyle: CellStyleModel = { fontStyle: 'italic', fontWeight: 'bold' };
const fontStyle: CellStyleModel = { fontWeight: 'bold', textAlign: 'right' };
// Custom function to calculate percentage between two cell values.
const calculatePercentage = (firstCell: string, secondCell: string): number => {
return Number(firstCell) / Number(secondCell);
};
React.useEffect(() => {
let spreadsheet = spreadsheetRef.current;
if (spreadsheet) {
spreadsheet.cellFormat({ fontWeight: 'bold', textAlign: 'center' }, 'A2:E2');
spreadsheet.numberFormat('$#,##0', 'B3:D12');
spreadsheet.numberFormat('0%', 'E3:E12');
// Adding custom function for calculating the percentage between two cells.
spreadsheet.addCustomFunction(calculatePercentage, 'PERCENTAGE');
// Calculate percentage using custom added formula in E11 cell.
spreadsheet.updateCell({ formula: '=PERCENTAGE(C11,D11)' }, 'E11');
// Calculate expressions using computeExpression in E10 cell.
spreadsheet.updateCell({ value: spreadsheet.computeExpression('C10/D10') as string }, 'E10');
// Calculate custom formula values using computeExpression in E12 cell.
spreadsheet.updateCell({ value: spreadsheet.computeExpression('=PERCENTAGE(C12,D12)') as string }, 'E12');
// Calculate SUM (built-in) formula values using computeExpression in D12 cell.
spreadsheet.updateCell({ value: spreadsheet.computeExpression('=SUM(D3:D11)') as string }, 'D12');
}
}, []);
return (<div>
<SpreadsheetComponent ref={spreadsheetRef} showSheetTabs={false} showRibbon={false}>
<SheetsDirective>
<SheetDirective>
<RowsDirective>
<RowDirective height={40} customHeight={true}>
<CellsDirective>
<CellDirective value={'Monthly Expense'} style={styles} colSpan={5}></CellDirective>
</CellsDirective>
</RowDirective>
<RowDirective height={30}></RowDirective>
<RowDirective index={11}>
<CellsDirective>
<CellDirective value={'Totals'} style={cellStyle}></CellDirective>
<CellDirective formula={'=SUM(B3:B11)'} ></CellDirective>
<CellDirective formula={'=SUM(C3:C11)'}></CellDirective>
<CellDirective formula={'=SUM(D3:D11)'}></CellDirective>
</CellsDirective>
</RowDirective>
<RowDirective>
<CellsDirective>
<CellDirective index={1} value={'Number of Categories'} style={fontStyle} colSpan={2}></CellDirective>
<CellDirective formula={'=COUNTA(A3:A11)'} index={3}></CellDirective>
</CellsDirective>
</RowDirective>
<RowDirective>
<CellsDirective>
<CellDirective index={1} value={'Average Spend'} style={fontStyle} colSpan={2}></CellDirective>
<CellDirective formula={'=AVERAGE(B3:B11)'} index={3} format={'$#,##0'}></CellDirective>
</CellsDirective>
</RowDirective>
<RowDirective>
<CellsDirective>
<CellDirective index={1} value={'Min Spend'} style={fontStyle} colSpan={2}></CellDirective>
<CellDirective formula={"=MIN(B3:B11)"} index={3} format={'$#,##0'}></CellDirective>
</CellsDirective>
</RowDirective>
<RowDirective>
<CellsDirective>
<CellDirective index={1} value={'Max Spend'} style={fontStyle} colSpan={2}></CellDirective>
<CellDirective formula={"=MAX(B3:B11)"} index={3} format={'$#,##0'}></CellDirective>
</CellsDirective>
</RowDirective>
</RowsDirective>
<RangesDirective>
<RangeDirective dataSource={data} startCell={"A2"}></RangeDirective>
</RangesDirective>
<ColumnsDirective>
<ColumnDirective width={150}></ColumnDirective>
<ColumnDirective width={120}></ColumnDirective>
<ColumnDirective width={120}></ColumnDirective>
<ColumnDirective width={120}></ColumnDirective>
<ColumnDirective width={120}></ColumnDirective>
<ColumnDirective width={120}></ColumnDirective>
</ColumnsDirective>
</SheetDirective>
</SheetsDirective>
</SpreadsheetComponent> </div>
);
};
export default App;
const root = createRoot(document.getElementById('root')!);
root.render(<App />);/**
* Formula data source
*/
export let data = [
{
'Category': 'Household Utilities',
'Monthly Spend': '=C3/12',
'Annual Spend': 3000,
'Last Year Spend': 3000,
'Percentage Change': '=C3/D3' // You can set the expression or formula as string
},
{
'Category': 'Food',
'Monthly Spend': '=C4/12',
'Annual Spend': 2500,
'Last Year Spend': 2250,
'Percentage Change': { formula: '=C4/D4' } // You can also set as object with formula field
},
{
'Category': 'Gasoline',
'Monthly Spend': '=C5/12',
'Annual Spend': 1500,
'Last Year Spend': 1200,
'Percentage Change': { formula: '=C5/D5' }
},
{
'Category': 'Clothes',
'Monthly Spend': '=C6/12',
'Annual Spend': 1200,
'Last Year Spend': 1000,
'Percentage Change': '=C6/D6'
},
{
'Category': 'Insurance',
'Monthly Spend': '=C7/12',
'Annual Spend': 1500,
'Last Year Spend': 1500,
'Percentage Change': '=C7/D7'
},
{
'Category': 'Taxes',
'Monthly Spend': '=C8/12',
'Annual Spend': 3500,
'Last Year Spend': 3500,
'Percentage Change': '=C8/D8'
},
{
'Category': 'Entertainment',
'Monthly Spend': '=C9/12',
'Annual Spend': 2000,
'Last Year Spend': 2250,
'Percentage Change': '=C9/D9'
},
{
'Category': 'Vacation',
'Monthly Spend': '=C10/12',
'Annual Spend': 1500,
'Last Year Spend': 2000,
'Percentage Change': '=C10/D10'
},
{
'Category': 'Miscellaneous',
'Monthly Spend': '=C11/12',
'Annual Spend': 1250,
'Last Year Spend': 1558,
'Percentage Change': '=C11/D11'
}
];/**
* Formula data source
*/
export let data: Object[] = [
{
'Category': 'Household Utilities',
'Monthly Spend': '=C3/12', // Setting formula through data binding
'Annual Spend': 3000,
'Last Year Spend': 3000,
'Percentage Change': '=C3/D3' // You can set the expression or formula as string
},
{
'Category': 'Food',
'Monthly Spend': '=C4/12',
'Annual Spend': 2500,
'Last Year Spend': 2250,
'Percentage Change': { formula: '=C4/D4' } // You can also set as object with formula field
},
{
'Category': 'Gasoline',
'Monthly Spend': '=C5/12',
'Annual Spend': 1500,
'Last Year Spend': 1200,
'Percentage Change': { formula: '=C5/D5' }
},
{
'Category': 'Clothes',
'Monthly Spend': '=C6/12',
'Annual Spend': 1200,
'Last Year Spend': 1000,
'Percentage Change': '=C6/D6'
},
{
'Category': 'Insurance',
'Monthly Spend': '=C7/12',
'Annual Spend': 1500,
'Last Year Spend': 1500,
'Percentage Change': '=C7/D7'
},
{
'Category': 'Taxes',
'Monthly Spend': '=C8/12',
'Annual Spend': 3500,
'Last Year Spend': 3500,
'Percentage Change': '=C8/D8'
},
{
'Category': 'Entertainment',
'Monthly Spend': '=C9/12',
'Annual Spend': 2000,
'Last Year Spend': 2250,
'Percentage Change': '=C9/D9'
},
{
'Category': 'Vacation',
'Monthly Spend': '=C10/12',
'Annual Spend': 1500,
'Last Year Spend': 2000,
'Percentage Change': '=C10/D10'
},
{
'Category': 'Miscellaneous',
'Monthly Spend': '=C11/12',
'Annual Spend': 1250,
'Last Year Spend': 1558,
'Percentage Change': '=C11/D11'
}
];Formula bar
Formula bar is used to edit or enter cell data in much easier way. By default, the formula bar is enabled in the spreadsheet. Use the showFormulaBar property to enable or disable the formula bar.
Named Ranges
You can define a meaningful name for a cell range and use it in the formula for calculation. It makes your formula much easier to understand and maintain. You can add named ranges to the Spreadsheet in the following ways,
- Using the
definedNamescollection, you can add multiple named ranges at initial load. - Use the
addDefinedNamemethod to add a named range dynamically. - You can remove an added named range dynamically using the
removeDefinedNamemethod. - Select the range of cells, and then enter the name for the selected range in the name box.
The following code example shows the usage of named ranges support.
import * as React from 'react';
import { createRoot } from 'react-dom/client';
import { SpreadsheetComponent, SheetsDirective, SheetDirective, RangesDirective, RowsDirective, RowDirective, CellDirective, CellsDirective } from '@syncfusion/ej2-react-spreadsheet';
import { RangeDirective, ColumnsDirective, ColumnDirective, DefinedNamesDirective, DefinedNameDirective } from '@syncfusion/ej2-react-spreadsheet';
import { getComponent } from '@syncfusion/ej2-base';
import { data } from './datasource';

function App() {
    const spreadsheetRef = React.useRef(null);
    const styles = { textAlign: 'center', fontWeight: 'bold', verticalAlign: 'middle', fontStyle: 'italic', fontSize: '15pt' };
    const cellStyle = { fontStyle: 'italic', fontWeight: 'bold' };
    const fontStyle = { fontWeight: 'bold', textAlign: 'right' };
    const beforeDataBound = () => {
        let spreadsheetObj = getComponent(document.getElementById("spreadsheet"), "spreadsheet");
        // Adding name dynamically for `last year spending` and `percentage change` ranges.
        spreadsheetObj.addDefinedName({ name: 'LastYearSpendings', refersTo: '=D3:D11' });
        spreadsheetObj.addDefinedName({ name: 'PercentageChange', refersTo: '=E3:E11' });
    };
    React.useEffect(() => {
        let spreadsheet = spreadsheetRef.current;
        if (spreadsheet) {
            // Removing the unwanted `PercentageChange` named range
            spreadsheet.removeDefinedName('PercentageChange', '');
            spreadsheet.cellFormat({ fontWeight: 'bold', textAlign: 'center' }, 'A2:E2');
            spreadsheet.numberFormat('$#,##0', 'B3:D12');
            spreadsheet.numberFormat('0%', 'E3:E12');
        }
    }, []);

    return (
        <div>
            <SpreadsheetComponent id='spreadsheet' ref={spreadsheetRef} beforeDataBound={beforeDataBound} showSheetTabs={false} showRibbon={false}>
                <SheetsDirective>
                    <SheetDirective name={"Budget Details"}>
                        <RowsDirective>
                            <RowDirective height={40} customHeight={true}>
                                <CellsDirective>
                                    <CellDirective value={'Monthly Expense'} style={styles} colSpan={5}></CellDirective>
                                </CellsDirective>
                            </RowDirective>
                            <RowDirective height={30}></RowDirective>
                            <RowDirective index={11}>
                                <CellsDirective>
                                    <CellDirective value={'Totals'} style={cellStyle}></CellDirective>
                                    <CellDirective formula={'=SUM(MonthlySpendings)'} ></CellDirective>
                                    <CellDirective formula={'=SUM(AnnualSpendings)'}></CellDirective>
                                    <CellDirective formula={'=SUM(LastYearSpendings)'}></CellDirective>
                                    <CellDirective formula={'=C12/D12'}></CellDirective>
                                </CellsDirective>
                            </RowDirective>
                            <RowDirective>
                                <CellsDirective>
                                    <CellDirective index={1} value={'Number of Categories'} style={fontStyle} colSpan={2}></CellDirective>
                                    <CellDirective formula={'=COUNTA(Categories)'} index={3}></CellDirective>
                                </CellsDirective>
                            </RowDirective>
                            <RowDirective>
                                <CellsDirective>
                                    <CellDirective index={1} value={'Average Spend'} style={fontStyle} colSpan={2}></CellDirective>
                                    <CellDirective formula={'=AVERAGE(MonthlySpendings)'} index={3} format={'$#,##0'}></CellDirective>
                                </CellsDirective>
                            </RowDirective>
                            <RowDirective>
                                <CellsDirective>
                                    <CellDirective index={1} value={'Min Spend'} style={fontStyle} colSpan={2}></CellDirective>
                                    <CellDirective formula={"=MIN(MonthlySpendings)"} index={3} format={'$#,##0'}></CellDirective>
                                </CellsDirective>
                            </RowDirective>
                            <RowDirective>
                                <CellsDirective>
                                    <CellDirective index={1} value={'Max Spend'} style={fontStyle} colSpan={2}></CellDirective>
                                    <CellDirective formula={"=MAX(MonthlySpendings)"} index={3} format={'$#,##0'}></CellDirective>
                                </CellsDirective>
                            </RowDirective>
                        </RowsDirective>
                        <RangesDirective>
                            <RangeDirective dataSource={data} startCell={"A2"}></RangeDirective>
                        </RangesDirective>
                        <ColumnsDirective>
                            <ColumnDirective width={150}></ColumnDirective>
                            <ColumnDirective width={120}></ColumnDirective>
                            <ColumnDirective width={120}></ColumnDirective>
                            <ColumnDirective width={120}></ColumnDirective>
                            <ColumnDirective width={120}></ColumnDirective>
                        </ColumnsDirective>
                    </SheetDirective>
                </SheetsDirective>
                <DefinedNamesDirective>
                    <DefinedNameDirective name={'Categories'} refersTo={"=Budget Details!A3:A11"}> </DefinedNameDirective>
                    <DefinedNameDirective name={'MonthlySpendings'} refersTo={"=Budget Details!B3:B11"}> </DefinedNameDirective>
                    <DefinedNameDirective name={'AnnualSpendings'} refersTo={"=Budget Details!C3:C11"}> </DefinedNameDirective>
                </DefinedNamesDirective>
            </SpreadsheetComponent>
        </div>
    );
};
export default App;

const root = createRoot(document.getElementById('root'));
root.render(<App />);
import * as React from 'react';
import { createRoot } from 'react-dom/client';
import { SpreadsheetComponent, SheetsDirective, SheetDirective, RangesDirective, RowsDirective, RowDirective, CellDirective, CellsDirective } from '@syncfusion/ej2-react-spreadsheet';
import { RangeDirective, ColumnsDirective, ColumnDirective, CellStyleModel, DefinedNamesDirective, DefinedNameDirective } from '@syncfusion/ej2-react-spreadsheet';
import { getComponent } from '@syncfusion/ej2-base';
import { data } from './datasource';
function App() {
const spreadsheetRef = React.useRef<SpreadsheetComponent>(null);
const styles: CellStyleModel = { textAlign: 'center', fontWeight: 'bold', verticalAlign: 'middle', fontStyle: 'italic', fontSize: '15pt' };
const cellStyle: CellStyleModel = { fontStyle: 'italic', fontWeight: 'bold' };
const fontStyle: CellStyleModel = { fontWeight: 'bold', textAlign: 'right' };
const beforeDataBound = (): void => {
let spreadsheetObj: SpreadsheetComponent = getComponent(document.getElementById("spreadsheet") as HTMLElement, "spreadsheet");
// Adding name dynamically for `last year spending` and `percentage change` ranges.
spreadsheetObj.addDefinedName({ name: 'LastYearSpendings', refersTo: '=D3:D11' });
spreadsheetObj.addDefinedName({ name: 'PercentageChange', refersTo: '=E3:E11' });
};
React.useEffect(() => {
let spreadsheet = spreadsheetRef.current;
if (spreadsheet) {
// Removing the unwanted `PercentageChange` named range
spreadsheet.removeDefinedName('PercentageChange', '');
spreadsheet.cellFormat({ fontWeight: 'bold', textAlign: 'center' }, 'A2:E2');
spreadsheet.numberFormat('$#,##0', 'B3:D12');
spreadsheet.numberFormat('0%', 'E3:E12');
}
}, []);
return (
<div>
<SpreadsheetComponent id='spreadsheet' ref={spreadsheetRef} beforeDataBound={beforeDataBound} showSheetTabs={false} showRibbon={false}>
<SheetsDirective>
<SheetDirective name={"Budget Details"}>
<RowsDirective>
<RowDirective height={40} customHeight={true}>
<CellsDirective>
<CellDirective value={'Monthly Expense'} style={styles} colSpan={5}></CellDirective>
</CellsDirective>
</RowDirective>
<RowDirective height={30}></RowDirective>
<RowDirective index={11}>
<CellsDirective>
<CellDirective value={'Totals'} style={cellStyle}></CellDirective>
<CellDirective formula={'=SUM(MonthlySpendings)'} ></CellDirective>
<CellDirective formula={'=SUM(AnnualSpendings)'}></CellDirective>
<CellDirective formula={'=SUM(LastYearSpendings)'}></CellDirective>
<CellDirective formula={'=C12/D12'}></CellDirective>
</CellsDirective>
</RowDirective>
<RowDirective>
<CellsDirective>
<CellDirective index={1} value={'Number of Categories'} style={fontStyle} colSpan={2}></CellDirective>
<CellDirective formula={'=COUNTA(Categories)'} index={3}></CellDirective>
</CellsDirective>
</RowDirective>
<RowDirective>
<CellsDirective>
<CellDirective index={1} value={'Average Spend'} style={fontStyle} colSpan={2}></CellDirective>
<CellDirective formula={'=AVERAGE(MonthlySpendings)'} index={3} format={'$#,##0'}></CellDirective>
</CellsDirective>
</RowDirective>
<RowDirective>
<CellsDirective>
<CellDirective index={1} value={'Min Spend'} style={fontStyle} colSpan={2}></CellDirective>
<CellDirective formula={"=MIN(MonthlySpendings)"} index={3} format={'$#,##0'}></CellDirective>
</CellsDirective>
</RowDirective>
<RowDirective>
<CellsDirective>
<CellDirective index={1} value={'Max Spend'} style={fontStyle} colSpan={2}></CellDirective>
<CellDirective formula={"=MAX(MonthlySpendings)"} index={3} format={'$#,##0'}></CellDirective>
</CellsDirective>
</RowDirective>
</RowsDirective>
<RangesDirective>
<RangeDirective dataSource={data} startCell={"A2"}></RangeDirective>
</RangesDirective>
<ColumnsDirective>
<ColumnDirective width={150}></ColumnDirective>
<ColumnDirective width={120}></ColumnDirective>
<ColumnDirective width={120}></ColumnDirective>
<ColumnDirective width={120}></ColumnDirective>
<ColumnDirective width={120}></ColumnDirective>
</ColumnsDirective>
</SheetDirective>
</SheetsDirective>
<DefinedNamesDirective>
<DefinedNameDirective name={'Categories'} refersTo={"=Budget Details!A3:A11"}> </DefinedNameDirective>
<DefinedNameDirective name={'MonthlySpendings'} refersTo={"=Budget Details!B3:B11"}> </DefinedNameDirective>
<DefinedNameDirective name={'AnnualSpendings'} refersTo={"=Budget Details!C3:C11"}> </DefinedNameDirective>
</DefinedNamesDirective>
</SpreadsheetComponent>
</div>
);
};
export default App;
const root = createRoot(document.getElementById('root')!);
root.render(<App />);/**
* Formula data source
*/
export let data = [
{
'Category': 'Household Utilities',
'Monthly Spend': '=C3/12',
'Annual Spend': 3000,
'Last Year Spend': 3000,
'Percentage Change': '=C3/D3' // You can set the expression or formula as string
},
{
'Category': 'Food',
'Monthly Spend': '=C4/12',
'Annual Spend': 2500,
'Last Year Spend': 2250,
'Percentage Change': { formula: '=C4/D4' } // You can also set as object with formula field
},
{
'Category': 'Gasoline',
'Monthly Spend': '=C5/12',
'Annual Spend': 1500,
'Last Year Spend': 1200,
'Percentage Change': { formula: '=C5/D5' }
},
{
'Category': 'Clothes',
'Monthly Spend': '=C6/12',
'Annual Spend': 1200,
'Last Year Spend': 1000,
'Percentage Change': '=C6/D6'
},
{
'Category': 'Insurance',
'Monthly Spend': '=C7/12',
'Annual Spend': 1500,
'Last Year Spend': 1500,
'Percentage Change': '=C7/D7'
},
{
'Category': 'Taxes',
'Monthly Spend': '=C8/12',
'Annual Spend': 3500,
'Last Year Spend': 3500,
'Percentage Change': '=C8/D8'
},
{
'Category': 'Entertainment',
'Monthly Spend': '=C9/12',
'Annual Spend': 2000,
'Last Year Spend': 2250,
'Percentage Change': '=C9/D9'
},
{
'Category': 'Vacation',
'Monthly Spend': '=C10/12',
'Annual Spend': 1500,
'Last Year Spend': 2000,
'Percentage Change': '=C10/D10'
},
{
'Category': 'Miscellaneous',
'Monthly Spend': '=C11/12',
'Annual Spend': 1250,
'Last Year Spend': 1558,
'Percentage Change': '=C11/D11'
}
];/**
* Formula data source
*/
export let data: Object[] = [
{
'Category': 'Household Utilities',
'Monthly Spend': '=C3/12', // Setting formula through data binding
'Annual Spend': 3000,
'Last Year Spend': 3000,
'Percentage Change': '=C3/D3' // You can set the expression or formula as string
},
{
'Category': 'Food',
'Monthly Spend': '=C4/12',
'Annual Spend': 2500,
'Last Year Spend': 2250,
'Percentage Change': { formula: '=C4/D4' } // You can also set as object with formula field
},
{
'Category': 'Gasoline',
'Monthly Spend': '=C5/12',
'Annual Spend': 1500,
'Last Year Spend': 1200,
'Percentage Change': { formula: '=C5/D5' }
},
{
'Category': 'Clothes',
'Monthly Spend': '=C6/12',
'Annual Spend': 1200,
'Last Year Spend': 1000,
'Percentage Change': '=C6/D6'
},
{
'Category': 'Insurance',
'Monthly Spend': '=C7/12',
'Annual Spend': 1500,
'Last Year Spend': 1500,
'Percentage Change': '=C7/D7'
},
{
'Category': 'Taxes',
'Monthly Spend': '=C8/12',
'Annual Spend': 3500,
'Last Year Spend': 3500,
'Percentage Change': '=C8/D8'
},
{
'Category': 'Entertainment',
'Monthly Spend': '=C9/12',
'Annual Spend': 2000,
'Last Year Spend': 2250,
'Percentage Change': '=C9/D9'
},
{
'Category': 'Vacation',
'Monthly Spend': '=C10/12',
'Annual Spend': 1500,
'Last Year Spend': 2000,
'Percentage Change': '=C10/D10'
},
{
'Category': 'Miscellaneous',
'Monthly Spend': '=C11/12',
'Annual Spend': 1250,
'Last Year Spend': 1558,
'Percentage Change': '=C11/D11'
}
];Calculation Mode
The Spreadsheet provides a Calculation Mode feature like the calculation options in online Excel. This feature allows you to control when and how formulas are recalculated in the spreadsheet. The available modes are:
-
Automatic: Formulas are recalculated instantly whenever a change occurs in the dependent cells. -
Manual: Formulas are recalculated only when triggered explicitly by the user using options likeCalculate SheetorCalculate Workbook.
You can configure the calculate mode using the calculationMode property of the Spreadsheet. These modes offer flexibility to balance real-time updates and performance optimization.
Automatic Mode
In Automatic Mode, formulas are recalculated instantly whenever a dependent cell is modified. This mode is perfect for scenarios where real-time updates are essential, ensuring that users see the latest results without additional actions.
For example, consider a spreadsheet where cell C1 contains the formula =A1+B1. When the value in A1 or B1 changes, C1 updates immediately without requiring any user intervention. You can enable this mode by setting the calculationMode property to Automatic.
The following code example demonstrates how to set the Automatic calculation mode in a Spreadsheet.
import * as React from 'react';
import { createRoot } from 'react-dom/client';
import { SpreadsheetComponent, SheetsDirective, SheetDirective, RangesDirective } from '@syncfusion/ej2-react-spreadsheet';
import { RangeDirective, ColumnsDirective, ColumnDirective } from '@syncfusion/ej2-react-spreadsheet';
import { data } from './datasource';

function App() {
    const spreadsheetRef = React.useRef(null);
    React.useEffect(() => {
        let spreadsheet = spreadsheetRef.current;
        if (spreadsheet) {
            spreadsheet.cellFormat({ fontWeight: 'bold', textAlign: 'center' }, 'A1:H1');
        }
    }, []);

    return (
        <div>
            <SpreadsheetComponent id='spreadsheet' ref={spreadsheetRef} calculationMode={'Automatic'}>
                <SheetsDirective>
                    <SheetDirective name={"Product Details"}>
                        <RangesDirective>
                            <RangeDirective dataSource={data} startCell={"A1"}></RangeDirective>
                        </RangesDirective>
                        <ColumnsDirective>
                            <ColumnDirective width={130}></ColumnDirective>
                            <ColumnDirective width={92}></ColumnDirective>
                            <ColumnDirective width={96}></ColumnDirective>
                        </ColumnsDirective>
                    </SheetDirective>
                </SheetsDirective>
            </SpreadsheetComponent>
        </div>
    );
};
export default App;

const root = createRoot(document.getElementById('root'));
root.render(<App />);
import * as React from 'react';
import { createRoot } from 'react-dom/client';
import { SpreadsheetComponent, SheetsDirective, SheetDirective, RangesDirective } from '@syncfusion/ej2-react-spreadsheet';
import { RangeDirective, ColumnsDirective, ColumnDirective } from '@syncfusion/ej2-react-spreadsheet';
import { data } from './datasource';
function App() {
const spreadsheetRef = React.useRef<SpreadsheetComponent>(null);
React.useEffect(() => {
let spreadsheet = spreadsheetRef.current;
if (spreadsheet) {
spreadsheet.cellFormat({ fontWeight: 'bold', textAlign: 'center' }, 'A1:H1');
}
}, []);
return (
<div>
<SpreadsheetComponent id='spreadsheet' ref={spreadsheetRef} calculationMode={'Automatic'}>
<SheetsDirective>
<SheetDirective name={"Product Details"}>
<RangesDirective>
<RangeDirective dataSource={data} startCell={"A1"}></RangeDirective>
</RangesDirective>
<ColumnsDirective>
<ColumnDirective width={130}></ColumnDirective>
<ColumnDirective width={92}></ColumnDirective>
<ColumnDirective width={96}></ColumnDirective>
</ColumnsDirective>
</SheetDirective>
</SheetsDirective>
</SpreadsheetComponent>
</div>
);
};
export default App;
const root = createRoot(document.getElementById('root')!);
root.render(<App />);/**
* Formula data source
*/
export let data = [
{ 'Item Name': 'Casual Shoes', Date: '2/14/2024', Time: '11:34:32 AM', Quantity: 10, Price: 20, Amount: '=PRODUCT(D2:E2)', Discount: '2%', Profit: '=PRODUCT(G2:F2)' },
{ 'Item Name': 'Sports Shoes', Date: '6/11/2024', Time: '05:56:32 AM', Quantity: 20, Price: 30, Amount: '=PRODUCT(D3:E3)', Discount: '5%', Profit: '=PRODUCT(G3:F3)' },
{ 'Item Name': 'Formal Shoes', Date: '7/27/2024', Time: '03:32:44 AM', Quantity: 20, Price: 15, Amount: '=PRODUCT(D4:E4)', Discount: '7.5%', Profit: '=PRODUCT(G4:F4)' },
{ 'Item Name': 'Sandals & Floaters', Date: '11/21/2024', Time: '06:23:54 PM', Quantity: 15, Price: 20.45, Amount: '=PRODUCT(D5:E5)', Discount: '11%', Profit: '=PRODUCT(G5:F5)' },
{ 'Item Name': 'Flip- Flops & Slippers', Date: '6/23/2024', Time: '12:43:59 AM', Quantity: 30, Price: 10.67, Amount: '=PRODUCT(D6:E6)', Discount: '10%', Profit: '=PRODUCT(G6:F6)' },
{ 'Item Name': 'Sneakers', Date: '7/22/2024', Time: '10:55:53 AM', Quantity: 40, Price: 20, Amount: '=PRODUCT(D7:E7)', Discount: '13.2%', Profit: '=PRODUCT(G7:F7)' },
{ 'Item Name': 'Running Shoes', Date: '2/4/2024', Time: '03:44:34 AM', Quantity: 20, Price: 10.5, Amount: '=PRODUCT(D8:E8)', Discount: '3%', Profit: '=PRODUCT(G8:F8)' },
{ 'Item Name': 'Loafers', Date: '11/30/2024', Time: '03:12:52 AM', Quantity: 31, Price: 10, Amount: '=PRODUCT(D9:E9)', Discount: '6.67%', Profit: '=PRODUCT(G9:F9)' },
{ 'Item Name': 'Cricket Shoes', Date: '7/9/2024', Time: '11:32:14 PM', Quantity: 41, Price: 30, Amount: '=PRODUCT(D10:E10)', Discount: '12.5%', Profit: '=PRODUCT(G10:F10)' },
{ 'Item Name': 'T-Shirts', Date: '10/31/2024', Time: '12:01:44 AM', Quantity: 50, Price: 10.75, Amount: '=PRODUCT(D11:E11)', Discount: '9%', Profit: '=PRODUCT(G11:F11)' }
];/**
* Formula data source
*/
export let data: Object[] = [
{ 'Item Name': 'Casual Shoes', Date: '2/14/2024', Time: '11:34:32 AM', Quantity: 10, Price: 20, Amount: '=PRODUCT(D2:E2)', Discount: '2%', Profit: '=PRODUCT(G2:F2)' },
{ 'Item Name': 'Sports Shoes', Date: '6/11/2024', Time: '05:56:32 AM', Quantity: 20, Price: 30, Amount: '=PRODUCT(D3:E3)', Discount: '5%', Profit: '=PRODUCT(G3:F3)' },
{ 'Item Name': 'Formal Shoes', Date: '7/27/2024', Time: '03:32:44 AM', Quantity: 20, Price: 15, Amount: '=PRODUCT(D4:E4)', Discount: '7.5%', Profit: '=PRODUCT(G4:F4)' },
{ 'Item Name': 'Sandals & Floaters', Date: '11/21/2024', Time: '06:23:54 PM', Quantity: 15, Price: 20.45, Amount: '=PRODUCT(D5:E5)', Discount: '11%', Profit: '=PRODUCT(G5:F5)' },
{ 'Item Name': 'Flip- Flops & Slippers', Date: '6/23/2024', Time: '12:43:59 AM', Quantity: 30, Price: 10.67, Amount: '=PRODUCT(D6:E6)', Discount: '10%', Profit: '=PRODUCT(G6:F6)' },
{ 'Item Name': 'Sneakers', Date: '7/22/2024', Time: '10:55:53 AM', Quantity: 40, Price: 20, Amount: '=PRODUCT(D7:E7)', Discount: '13.2%', Profit: '=PRODUCT(G7:F7)' },
{ 'Item Name': 'Running Shoes', Date: '2/4/2024', Time: '03:44:34 AM', Quantity: 20, Price: 10.5, Amount: '=PRODUCT(D8:E8)', Discount: '3%', Profit: '=PRODUCT(G8:F8)' },
{ 'Item Name': 'Loafers', Date: '11/30/2024', Time: '03:12:52 AM', Quantity: 31, Price: 10, Amount: '=PRODUCT(D9:E9)', Discount: '6.67%', Profit: '=PRODUCT(G9:F9)' },
{ 'Item Name': 'Cricket Shoes', Date: '7/9/2024', Time: '11:32:14 PM', Quantity: 41, Price: 30, Amount: '=PRODUCT(D10:E10)', Discount: '12.5%', Profit: '=PRODUCT(G10:F10)' },
{ 'Item Name': 'T-Shirts', Date: '10/31/2024', Time: '12:01:44 AM', Quantity: 50, Price: 10.75, Amount: '=PRODUCT(D11:E11)', Discount: '9%', Profit: '=PRODUCT(G11:F11)' }
];Manual Mode
In Manual Mode, formulas are not recalculated automatically when cell values are modified. Instead, recalculations must be triggered explicitly. This mode is ideal for scenarios where performance optimization is a priority, such as working with large datasets or computationally intensive formulas.
For example, imagine a spreadsheet where cell C1 contains the formula =A1+B1. When the value in A1 or B1 changes, the value in C1 will not update automatically. Instead, the recalculation must be initiated manually using either the Calculate Sheet or Calculate Workbook option. To manually initiate recalculation, the Spreadsheet provides two options:
-
Calculate Sheet: Recalculates formulas for the active sheet only. -
Calculate Workbook: Recalculates formulas across all sheets in the workbook.
The following code example demonstrates how to set the Manual calculation mode in a Spreadsheet.
import * as React from 'react';
import { createRoot } from 'react-dom/client';
import { SpreadsheetComponent, SheetsDirective, SheetDirective, RangesDirective } from '@syncfusion/ej2-react-spreadsheet';
import { RangeDirective, ColumnsDirective, ColumnDirective } from '@syncfusion/ej2-react-spreadsheet';
import { data } from './datasource';

function App() {
    const spreadsheetRef = React.useRef(null);
    React.useEffect(() => {
        let spreadsheet = spreadsheetRef.current;
        if (spreadsheet) {
            spreadsheet.cellFormat({ fontWeight: 'bold', textAlign: 'center' }, 'A1:H1');
        }
    }, []);

    return (
        <div>
            <SpreadsheetComponent id='spreadsheet' ref={spreadsheetRef} calculationMode={'Manual'}>
                <SheetsDirective>
                    <SheetDirective name={"Product Details"}>
                        <RangesDirective>
                            <RangeDirective dataSource={data} startCell={"A1"}></RangeDirective>
                        </RangesDirective>
                        <ColumnsDirective>
                            <ColumnDirective width={130}></ColumnDirective>
                            <ColumnDirective width={92}></ColumnDirective>
                            <ColumnDirective width={96}></ColumnDirective>
                        </ColumnsDirective>
                    </SheetDirective>
                </SheetsDirective>
            </SpreadsheetComponent>
        </div>
    );
};
export default App;

const root = createRoot(document.getElementById('root'));
root.render(<App />);
import * as React from 'react';
import { createRoot } from 'react-dom/client';
import { SpreadsheetComponent, SheetsDirective, SheetDirective, RangesDirective } from '@syncfusion/ej2-react-spreadsheet';
import { RangeDirective, ColumnsDirective, ColumnDirective } from '@syncfusion/ej2-react-spreadsheet';
import { data } from './datasource';
function App() {
const spreadsheetRef = React.useRef<SpreadsheetComponent>(null);
React.useEffect(() => {
let spreadsheet = spreadsheetRef.current;
if (spreadsheet) {
spreadsheet.cellFormat({ fontWeight: 'bold', textAlign: 'center' }, 'A1:H1');
}
}, []);
return (
<div>
<SpreadsheetComponent id='spreadsheet' ref={spreadsheetRef} calculationMode={'Manual'}>
<SheetsDirective>
<SheetDirective name={"Product Details"}>
<RangesDirective>
<RangeDirective dataSource={data} startCell={"A1"}></RangeDirective>
</RangesDirective>
<ColumnsDirective>
<ColumnDirective width={130}></ColumnDirective>
<ColumnDirective width={92}></ColumnDirective>
<ColumnDirective width={96}></ColumnDirective>
</ColumnsDirective>
</SheetDirective>
</SheetsDirective>
</SpreadsheetComponent>
</div>
);
};
export default App;
const root = createRoot(document.getElementById('root')!);
root.render(<App />);/**
* Formula data source
*/
export let data = [
{ 'Item Name': 'Casual Shoes', Date: '2/14/2024', Time: '11:34:32 AM', Quantity: 10, Price: 20, Amount: '=PRODUCT(D2:E2)', Discount: '2%', Profit: '=PRODUCT(G2:F2)' },
{ 'Item Name': 'Sports Shoes', Date: '6/11/2024', Time: '05:56:32 AM', Quantity: 20, Price: 30, Amount: '=PRODUCT(D3:E3)', Discount: '5%', Profit: '=PRODUCT(G3:F3)' },
{ 'Item Name': 'Formal Shoes', Date: '7/27/2024', Time: '03:32:44 AM', Quantity: 20, Price: 15, Amount: '=PRODUCT(D4:E4)', Discount: '7.5%', Profit: '=PRODUCT(G4:F4)' },
{ 'Item Name': 'Sandals & Floaters', Date: '11/21/2024', Time: '06:23:54 PM', Quantity: 15, Price: 20.45, Amount: '=PRODUCT(D5:E5)', Discount: '11%', Profit: '=PRODUCT(G5:F5)' },
{ 'Item Name': 'Flip- Flops & Slippers', Date: '6/23/2024', Time: '12:43:59 AM', Quantity: 30, Price: 10.67, Amount: '=PRODUCT(D6:E6)', Discount: '10%', Profit: '=PRODUCT(G6:F6)' },
{ 'Item Name': 'Sneakers', Date: '7/22/2024', Time: '10:55:53 AM', Quantity: 40, Price: 20, Amount: '=PRODUCT(D7:E7)', Discount: '13.2%', Profit: '=PRODUCT(G7:F7)' },
{ 'Item Name': 'Running Shoes', Date: '2/4/2024', Time: '03:44:34 AM', Quantity: 20, Price: 10.5, Amount: '=PRODUCT(D8:E8)', Discount: '3%', Profit: '=PRODUCT(G8:F8)' },
{ 'Item Name': 'Loafers', Date: '11/30/2024', Time: '03:12:52 AM', Quantity: 31, Price: 10, Amount: '=PRODUCT(D9:E9)', Discount: '6.67%', Profit: '=PRODUCT(G9:F9)' },
{ 'Item Name': 'Cricket Shoes', Date: '7/9/2024', Time: '11:32:14 PM', Quantity: 41, Price: 30, Amount: '=PRODUCT(D10:E10)', Discount: '12.5%', Profit: '=PRODUCT(G10:F10)' },
{ 'Item Name': 'T-Shirts', Date: '10/31/2024', Time: '12:01:44 AM', Quantity: 50, Price: 10.75, Amount: '=PRODUCT(D11:E11)', Discount: '9%', Profit: '=PRODUCT(G11:F11)' }
];/**
* Formula data source
*/
export let data: Object[] = [
{ 'Item Name': 'Casual Shoes', Date: '2/14/2024', Time: '11:34:32 AM', Quantity: 10, Price: 20, Amount: '=PRODUCT(D2:E2)', Discount: '2%', Profit: '=PRODUCT(G2:F2)' },
{ 'Item Name': 'Sports Shoes', Date: '6/11/2024', Time: '05:56:32 AM', Quantity: 20, Price: 30, Amount: '=PRODUCT(D3:E3)', Discount: '5%', Profit: '=PRODUCT(G3:F3)' },
{ 'Item Name': 'Formal Shoes', Date: '7/27/2024', Time: '03:32:44 AM', Quantity: 20, Price: 15, Amount: '=PRODUCT(D4:E4)', Discount: '7.5%', Profit: '=PRODUCT(G4:F4)' },
{ 'Item Name': 'Sandals & Floaters', Date: '11/21/2024', Time: '06:23:54 PM', Quantity: 15, Price: 20.45, Amount: '=PRODUCT(D5:E5)', Discount: '11%', Profit: '=PRODUCT(G5:F5)' },
{ 'Item Name': 'Flip- Flops & Slippers', Date: '6/23/2024', Time: '12:43:59 AM', Quantity: 30, Price: 10.67, Amount: '=PRODUCT(D6:E6)', Discount: '10%', Profit: '=PRODUCT(G6:F6)' },
{ 'Item Name': 'Sneakers', Date: '7/22/2024', Time: '10:55:53 AM', Quantity: 40, Price: 20, Amount: '=PRODUCT(D7:E7)', Discount: '13.2%', Profit: '=PRODUCT(G7:F7)' },
{ 'Item Name': 'Running Shoes', Date: '2/4/2024', Time: '03:44:34 AM', Quantity: 20, Price: 10.5, Amount: '=PRODUCT(D8:E8)', Discount: '3%', Profit: '=PRODUCT(G8:F8)' },
{ 'Item Name': 'Loafers', Date: '11/30/2024', Time: '03:12:52 AM', Quantity: 31, Price: 10, Amount: '=PRODUCT(D9:E9)', Discount: '6.67%', Profit: '=PRODUCT(G9:F9)' },
{ 'Item Name': 'Cricket Shoes', Date: '7/9/2024', Time: '11:32:14 PM', Quantity: 41, Price: 30, Amount: '=PRODUCT(D10:E10)', Discount: '12.5%', Profit: '=PRODUCT(G10:F10)' },
{ 'Item Name': 'T-Shirts', Date: '10/31/2024', Time: '12:01:44 AM', Quantity: 50, Price: 10.75, Amount: '=PRODUCT(D11:E11)', Discount: '9%', Profit: '=PRODUCT(G11:F11)' }
];Supported Formulas
The following are the list of formulas supported in spreadsheet,
| Formula | Description |
|---|---|
| ABS | Returns the value of a number without its sign. |
| ADDRESS | Returns a cell reference as text, given specified row and column numbers. |
| AND | Returns TRUE if all the arguments are TRUE, otherwise returns FALSE. |
| AVERAGE | Calculates average for the series of numbers and/or cells excluding text. |
| AVERAGEA | Calculates the average for the cells evaluating TRUE as 1, text and FALSE as 0. |
| AVERAGEIF | Clears content of the active cell and enables edit mode. |
| AVERAGEIFS | Calculates average for the cells based on specified conditions. |
| CEILING | Rounds a number up to the nearest multiple of a given factor. |
| CHOOSE | Returns a value from list of values, based on index number. |
| CHAR | Returns the character from the specified number. |
| CODE | Returns the numeric code for the first character in a given string. |
| CONCAT | Concatenates a list or a range of text strings. |
| CONCATENATE | Combines two or more strings together. |
| COUNT | Counts the cells that contain numeric values in a range. |
| COUNTA | Counts the cells that contains values in a range. |
| COUNTBLANK | Returns the number of empty cells in a specified range of cells. |
| COUNTIF | Counts the cells based on specified condition. |
| COUNTIFS | Counts the cells based on specified conditions. |
| DATE | Returns the date based on given year, month, and day. |
| DATEVALUE | Converts a date string into date value. |
| DAY | Returns the day from the given date. |
| DAYS | Returns the number of days between two dates. |
| DECIMAL | Converts a text representation of a number in a given base into a decimal number. |
| DEGREES | Converts radians to degrees. |
| DOLLAR | Converts the number to currency formatted text. |
| EDATE | Returns a date with given number of months before or after the specified date. |
| EOMONTH | Returns the last day of the month that is a specified number of months before or after an initially supplied start date. |
| EVEN | Rounds a positive number up and negative number down to the nearest even integer. |
| EXACT | Checks whether a two text strings are exactly same and returns TRUE or FALSE. |
| EXP | Returns e raised to the power of the given number. |
| FACT | Returns the factorial of a number. |
| FIND | Returns the position of a string within another string, which is case sensitive. |
| FLOOR | Rounds a number down to the nearest multiple of a given factor. |
| HLOOKUP | Looks for a value in the top row of the array of values and then returns a value in the same column from a row in the array that you specify. |
| HOUR | Returns the number of hours in a specified time string. |
| IF | Returns value based on the given expression. |
| IFERROR | Returns value if no error found else it will return specified value. |
| IFS | Returns value based on the given multiple expressions. |
| INDEX | Returns a value of the cell in a given range based on row and column number. |
| INT | Rounds a number down to the nearest integer. |
| INTERCEPT | Calculates the point of the Y-intercept line via linear regression. |
| ISNUMBER | Returns true when the value parses as a numeric value. |
| LARGE | Returns the k-th largest value in a given array. |
| LEN | Returns a number of characters in a given string. |
| LN | Returns the natural logarithm of a number. |
| LOG | Returns the logarithm of a number to the base that you specify. |
| LOOKUP | Looks for a value in a one-row or one-column range, then returns a value from the same position in a second one-row or one-column range. |
| MATCH | Returns the relative position of a specified value in given range. |
| MAX | Returns the largest number of the given arguments. |
| MEDIAN | Returns the median of the given set of numbers. |
| MINUTE | Returns the number of minutes in a specified time string. |
| MIN | Returns the smallest number of the given arguments. |
| MOD | Returns a remainder after a number is divided by divisor. |
| MONTH | Returns the number of months in a specified date string. |
| NOT | Returns the inverse of a given logical expression. |
| NOW | Returns the current date and time. |
| ODD | Rounds a positive number up and negative number down to the nearest odd integer. |
| OR | Returns TRUE if any of the arguments are TRUE, otherwise returns FALSE. |
| PI | Returns the value of pi. |
| POWER | Returns the result of a number raised to power. |
| PRODUCT | Multiplies a series of numbers and/or cells. |
| RADIANS | Converts degrees into radians. |
| RAND | Returns a random number between 0 and 1. |
| RANDBETWEEN | Returns a random integer based on specified values. |
| ROUND | Rounds a number to the specified number of digits. |
| ROUNDDOWN | Rounds a number down, toward zero. |
| ROUNDUP | Rounds a number up, away from zero. |
| RSQ | Returns the square of the Pearson product moment correlation coefficient based on data points in known_y’s and known_x’s. |
| SECOND | Returns the number of seconds in a specified time string. |
| SMALL | Returns the k-th smallest value in a given array. |
| SLOPE | Returns the slope of the line from linear regression of the data points. |
| SORT | Sorts the contents of a column, range, or array in ascending or descending order. |
| SQRT | Returns the square root of a positive number. |
| SUBTOTAL | Returns subtotal for a range using the given function number. |
| SUM | Adds a series of numbers and/or cells. |
| SUMIF | Adds the cells based on specified condition. |
| SUMIFS | Adds the cells based on specified conditions. |
| SUMPRODUCT | Returns the sum of the products of the corresponding array in given arrays. |
| T | Checks whether a value is text or not and returns the text. |
| TEXT | Converts the supplied value into text by using the user-specified format. |
| TIME | Converts hours, minutes, seconds to the time formatted text. |
| TODAY | Returns the current date. |
| TRUNC | Truncates a supplied number to a specified number of decimal places. |
| UNIQUE | Returns a unique values from a range or array. |
| VLOOKUP | Looks for a specific value in the first column of a lookup range and returns a corresponding value from a different column within the same row. |
Formula Error Dialog
If you enter an invalid formula in a cell, an error dialog with an error message will appear. For instance, a formula with the incorrect number of arguments, a formula without parenthesis, etc.
| Error Message | Reason |
|---|---|
| We found that you typed a formula with an invalid arguments | Occurs when passing an argument even though it wasn’t needed. |
| We found that you typed a formula with an empty expression | Occurs when passing an empty expression in the argument. |
| We found that you typed a formula with one or more missing opening or closing parenthesis | Occurs when an open parenthesis or a close parenthesis is missing. |
| We found that you typed a formula which is improper | Occurs when passing a single reference but a range was needed. |
| We found that you typed a formula with a wrong number of arguments | Occurs when the required arguments were not passed. |
| We found that you typed a formula which requires 3 arguments | Occurs when the required 3 arguments were not passed. |
| We found that you typed a formula with a mismatched quotes | Occurs when passing an argument with mismatched quotes. |
| We found that you typed a formula with a circular reference | Occurs when passing a formula with circular cell reference. |
| We found that you typed a formula which is invalid | Except in the cases mentioned above, all other errors will fall into this broad category. |
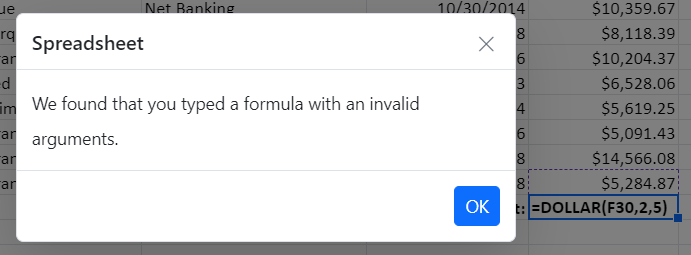
Note
You can refer to our React Spreadsheet feature tour page for its groundbreaking feature representations. You can also explore our React Spreadsheet example to knows how to present and manipulate data.