Getting started with EJ2 JavaScript Diagram control
22 Jul 202610 minutes to read
This section explains how to create and render a simple Essential® JS 2 Diagram in a plain JavaScript application.
Ready to streamline your Syncfusion® JavaScript development? Discover the full potential of Syncfusion® JavaScript controls with Syncfusion® AI Coding Assistant. Effortlessly integrate, configure, and enhance your projects with intelligent, context-aware code suggestions, streamlined setups, and real-time insights—all seamlessly integrated into your preferred AI-powered IDEs like VS Code, Cursor, Syncfusion® CodeStudio and more. Explore Syncfusion® AI Coding Assistant.
Setup for local environment
Follow these steps to set up your local environment.
Prerequisite: If you plan to use the local-script setup with a local HTTP server (e.g.,
npx http-server), ensureNode.jsis installed on your machine.
Step 1: Create a root folder named my-diagram-app for your application.
Step 2: Create a my-diagram-app/resources folder to store local script and style files.
Step 3: Open Visual Studio Code and create my-diagram-app/index.js and my-diagram-app/index.html files to initialize the Essential® JS 2 Diagram control.
Adding Syncfusion® resources
The Essential® JS 2 Diagram control can be initialized using one of the following methods:
- Using local script and style.
- Using CDN link for script and style.
Using local script and style
The following steps continue from the Setup for local environment section above. Each resource-loading approach (local script vs. CDN) replaces steps 1–4 below.
Step 1: Download Essential Studio® JavaScript (Essential® JS 2) to obtain the global scripts and styles. Note that the Diagram control depends on the ej2-base, ej2-popups, and ej2-navigations packages; using the combined ej2.min.js bundle (as shown in the example below) includes these dependencies automatically.
Step 2: Identify the location of the script and style files from the build installation location. The syntax for the file paths is as follows:
Syntax:
Script:
**(installed location)**/Syncfusion/Essential Studio/{RELEASE_VERSION}/Web(Essential JS 2)/javascript/{PACKAGE_NAME}/dist/global/{PACKAGE_NAME}.min.js
Styles:**(installed location)**/Syncfusion/Essential Studio/{RELEASE_VERSION}/Web(Essential JS 2)/javascript/{PACKAGE_NAME}/styles/tailwind3.css
For the Diagram control, use
ej2-diagramsas the{PACKAGE_NAME}. The{RELEASE_VERSION}is the installed Essential Studio build version (e.g.,33.2.3).
Example:
Script:
C:/Program Files (x86)/Syncfusion/Essential Studio/33.2.3/Web(Essential JS 2)/javascript/ej2-diagrams/dist/global/ej2-diagrams.min.js
Styles:C:/Program Files (x86)/Syncfusion/Essential Studio/33.2.3/Web(Essential JS 2)/javascript/ej2-diagrams/styles/tailwind3.css
Step 3: Copy the combined global script (ej2.min.js) and the theme style file (tailwind3.css) into the resources folder. These are the files referenced by the HTML example in the next step.
Step 4: Add references to the scripts and styles into the index.html file to render the Syncfusion® Diagram.
The following example shows how to reference the combined bundle (ej2.min.js) and combined style (tailwind3.css) in an HTML file. To use the package-specific ej2-diagrams.min.js instead, replace the script reference with the package-specific file described in the syntax above:
<!DOCTYPE html>
<html xmlns="http://www.w3.org/1999/xhtml">
<head>
    <title>Essential® JS 2</title>
    <!-- Essential® JS 2 tailwind3 theme -->
    <link href="resources/tailwind3.css" rel="stylesheet" type="text/css"/>

    <!-- Essential® JS 2 Diagram's global script -->
    <script src="resources/ej2.min.js" type="text/javascript"></script>
</head>

<body>
    <!-- Add the HTML <div> element for diagram  -->
    <div id="diagram"></div>
    <script src="index.js" type="text/javascript"></script>
</body>

</html>
For the local-script setup, the combined
tailwind3.cssfile includes styles for all Essential® JS 2 controls (base, popups, navigations, and diagrams). If you prefer package-specific CSS files, copy the individualtailwind3.cssfiles from theej2-base,ej2-popups,ej2-navigations, andej2-diagramspackages into the resources folder and reference each one separately, as shown in the CDN example below.
Using CDN link for script and style
Using CDN links, you can reference the scripts and styles directly in the index.html.
Syntax:
Script:
https://cdn.syncfusion.com/ej2/{RELEASE_VERSION}/dist/{PACKAGE_NAME}.min.js
Styles:https://cdn.syncfusion.com/ej2/{RELEASE_VERSION}/{PACKAGE_NAME}/styles/tailwind3.css
Example:
Script:
https://cdn.syncfusion.com/ej2/33.2.3/dist/ej2.min.js
Styles:ej2-base,ej2-popups,ej2-navigations, andej2-diagramstailwind3.cssfiles (e.g.,https://cdn.syncfusion.com/ej2/33.2.3/ej2-diagrams/styles/tailwind3.css)
The following example shows how to reference the scripts and styles in an HTML file using CDN links to render the Syncfusion® Diagram.
<!DOCTYPE html>
<html xmlns="http://www.w3.org/1999/xhtml">

<head>
    <title>Essential® JS 2 Diagram</title>

    <!-- Essential® JS 2 Diagram's dependent tailwind3 theme -->
    <link href="https://cdn.syncfusion.com/ej2/33.2.3/ej2-base/styles/tailwind3.css" rel="stylesheet">
    <link href="https://cdn.syncfusion.com/ej2/33.2.3/ej2-popups/styles/tailwind3.css" rel="stylesheet">
    <link href="https://cdn.syncfusion.com/ej2/33.2.3/ej2-navigations/styles/tailwind3.css" rel="stylesheet">
    <link href="https://cdn.syncfusion.com/ej2/33.2.3/ej2-diagrams/styles/tailwind3.css" rel="stylesheet">

    <!-- Essential® JS 2 Diagram's global script -->
    <script src="https://cdn.syncfusion.com/ej2/33.2.3/dist/ej2.min.js" type="text/javascript"></script>
</head>

<body>
    <!-- Add the HTML <div> element for diagram  -->
    <div id="diagram"></div>
    <script src="index.js" type="text/javascript"></script>
</body>

</html>
NOTE
The
{PACKAGE_NAME}.min.jsfile (e.g.,ej2-diagrams.min.js) and the package-specific{PACKAGE_NAME}/styles/tailwind3.cssfile (e.g.,ej2-diagrams/styles/tailwind3.css) contain only the Diagram package, while the combinedej2.min.jsbundle and the combinedtailwind3.cssfile include all Essential® JS 2 controls.
Create your first Diagram with nodes and connectors
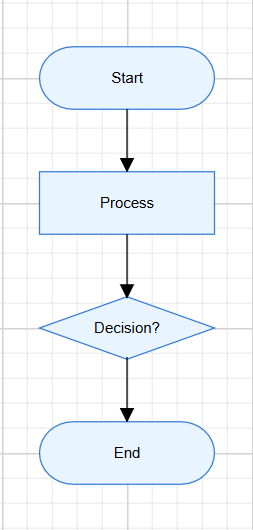
This section explains how to create a simple flowchart by adding nodes, customizing their appearance, and connecting them using connectors.
The following example creates a flowchart with four nodes: Start, Process, Decision, and End. It also applies common node and connector settings through the getNodeDefaults and getConnectorDefaults callback bindings.
Replace the entire contents of my-diagram-app/index.js with the following code:
// Node defaults function
function nodeDefaults(node) {
    node.width = 140;
    node.height = 50;
    node.style = { fill: '#E8F4FF', strokeColor: '#357BD2' };
    return node;
}

// Connector defaults function
function connectorDefaults(connector) {
    connector.type = 'Orthogonal';
    connector.targetDecorator = { shape: 'Arrow', width: 10, height: 10 };
    return connector;
}

// Initialize the Diagram control
let diagram = new ej.diagrams.Diagram({
    width: '100%',
    height: '580px',
    getNodeDefaults: nodeDefaults,
    getConnectorDefaults: connectorDefaults,
    nodes: [
        {
            id: 'node1',
            offsetX: 300,
            offsetY: 100,
            shape: { type: 'Flow', shape: 'Terminator' },
            annotations: [{ content: 'Start' }]
        },
        {
            id: 'node2',
            offsetX: 300,
            offsetY: 200,
            shape: { type: 'Flow', shape: 'Process' },
            annotations: [{ content: 'Process' }]
        },
        {
            id: 'node3',
            offsetX: 300,
            offsetY: 300,
            shape: { type: 'Flow', shape: 'Decision' },
            annotations: [{ content: 'Decision?' }]
        },
        {
            id: 'node4',
            offsetX: 300,
            offsetY: 400,
            shape: { type: 'Flow', shape: 'Terminator' },
            annotations: [{ content: 'End' }]
        }
    ],
    connectors: [
        {
            id: 'connector1',
            sourceID: 'node1',
            targetID: 'node2'
        },
        {
            id: 'connector2',
            sourceID: 'node2',
            targetID: 'node3'
        },
        {
            id: 'connector3',
            sourceID: 'node3',
            targetID: 'node4'
        }
    ]
});

// Render initialized Diagram
diagram.appendTo('#diagram');
Use the index.html from the Using CDN link for script and style example above. For the local-script setup, replace the CDN URLs with your local resources/ paths.
Run the application
Now, open index.html in a web browser. It will render the Essential® JS 2 Diagram control.
NOTE
For the local-script setup, serve the application via a local HTTP server (e.g., npx http-server or the Code Studio Live Server extension) instead of opening the HTML file directly with the file:/ protocol, to avoid browser security restrictions.
NOTE
If the diagram does not render, open the browser developer tools (F12) and check the Console for errors. Common causes include incorrect script/style file paths, missing dependencies, or a blocked CDN request.