Header and content of panels
23 Jan 202524 minutes to read
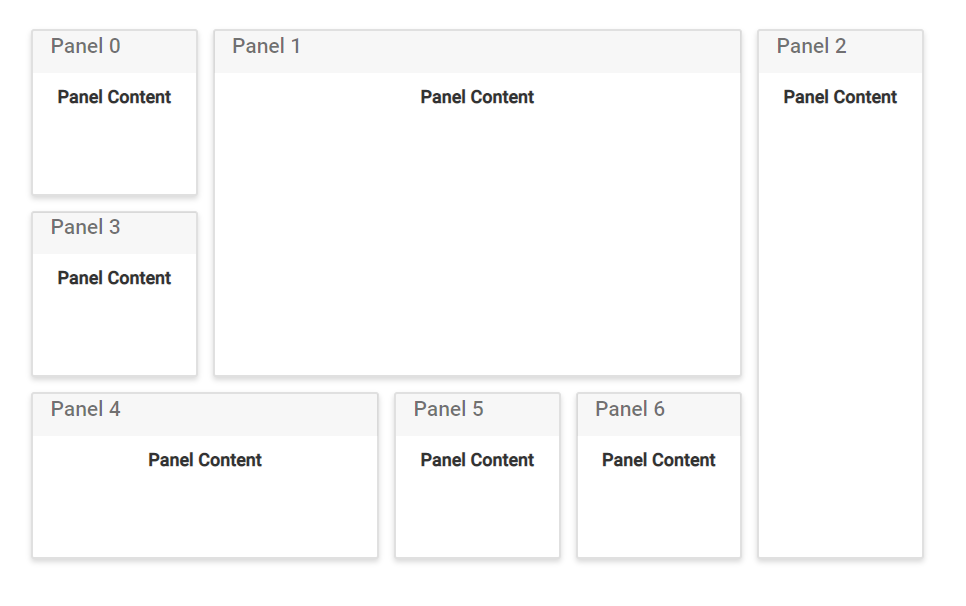
The Dashboard Layout control is mostly used to represent the data used for monitoring or managing a process. These data or any HTML template can be placed as the content of a panel using the content property. Also, word or phrase that summarize the panel’s content can be added as the header on the top of each panel using the header property of the panel.
@{
    ...
    panelCellSpacingModel modelValue = new panelCellSpacingModel();
    modelValue.cellSpacing = new double[] { 10, 10 };
}


<div>
    <!--  Dashboardlayout element declaration -->
    <ejs-dashboardlayout id="dashboard_default" columns="6" cellSpacing="@modelValue.cellSpacing">
        <e-dashboardlayout-panels>
            <e-dashboardlayout-panel id="Panel0" sizeX="1" sizeY="1" row="0" col="0" header="<div>Panel 0</div>" content="<div class='content'>Panel Content</div>">
            </e-dashboardlayout-panel>
            <e-dashboardlayout-panel id="Panel1" sizeX="3" sizeY="2" row="0" col="1" header="<div>Panel 1</div>" content="<div class='content'>Panel Content</div>">
            </e-dashboardlayout-panel>
            <e-dashboardlayout-panel id="Panel2" sizeX="1" sizeY="3" row="0" col="4" header="<div>Panel 2</div>" content="<div class='content'>Panel Content</div>">
            </e-dashboardlayout-panel>
            <e-dashboardlayout-panel id="Panel3" sizeX="1" sizeY="1" row="1" col="0" header="<div>Panel 3</div>" content="<div class='content'>Panel Content</div>">
            </e-dashboardlayout-panel>
            <e-dashboardlayout-panel id="Panel4" sizeX="2" sizeY="1" row="2" col="1" header="<div>Panel 4</div>" content="<div class='content'>Panel Content</div>">
            </e-dashboardlayout-panel>
            <e-dashboardlayout-panel id="Panel5" sizeX="1" sizeY="1" row="2" col="2" header="<div>Panel 5</div>" content="<div class='content'>Panel Content</div>">
            </e-dashboardlayout-panel>
            <e-dashboardlayout-panel id="Panel6" sizeX="1" sizeY="1" row="2" col="3" header="<div>Panel 6</div>" content="<div class='content'>Panel Content</div>">
            </e-dashboardlayout-panel>
        </e-dashboardlayout-panels>
    </ejs-dashboardlayout>
</div>
<!-- end of dashboardlayout element -->
<style>
    /* DashboardLayout element styles  */
    #dashboard_default .e-panel .e-panel-container .content {
        font-weight: 600;
        text-align: center;
        margin-top: 10px;
        line-height: 100%;
    }

    .e-dashboard-layout.e-control .e-panel .e-panel-container .e-panel-header {
        color: rgba(0, 0, 0, 0.61);
    }

    .e-panel .e-header-text {
        padding: 12px 0 12px 0;
    }

    #dashboard .e-panel-container .e-panel-header {
        border-bottom: 1px solid #888383;
    }

    .e-dashboard-layout.e-control .e-panel:hover {
        border: 0px;
    }

    .e-dashboard-layout.e-control .e-panel .e-panel-header {
        font-size: 15px;
        font-weight: 500;
        height: 37px;
        padding: 10px;
        vertical-align: middle;
        /* text-align: left; */
        border-bottom: 0.5px solid rgba(0, 0, 0, .125);
    }

    .e-panel-header {
        padding: 10px;
        margin-bottom: 0;
        background-color: rgba(0, 0, 0, .03);
    }
</style>
public class panelCellSpacingModel
{
public double[]? cellSpacing { get; set; }
}Placing components as content
In a dashboard, controls like charts, grids, maps, gauges, and more can be used to present complex data. Such controls can be placed as the panel content by assigning the corresponding control element as the content template of the panel.
NOTE
You must assign the empty div element inside the content template to add the control as content and also define the .e-panel, .e-panel-container, .e-panel-header, and .e-panel-content classes while rendering the DashboardLayout control using content template.
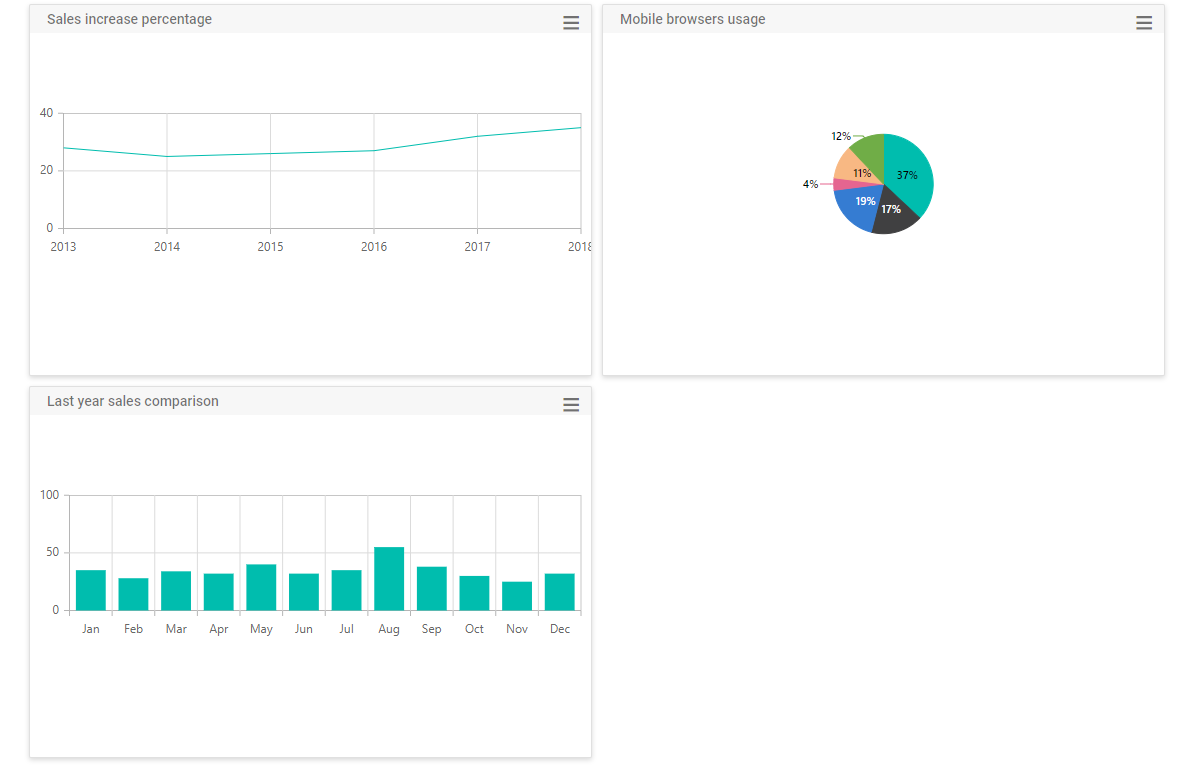
The following sample demonstrates how to add ej2-chart controls as the content for each panel in the DashboardLayout control.
@{
    ...
    componentSpacingModel modelValue = new componentSpacingModel();
    modelValue.cellSpacing = new double[] { 10, 10 };

    List<ChartData> chartData = new List<ChartData>
        {
            new ChartData { month = "Jan", sales = 35, },
            new ChartData { month = "Feb", sales = 28, },
            new ChartData { month = "Mar", sales = 34, },
            new ChartData { month = "Apr", sales = 32, },
            new ChartData { month = "May", sales = 40, },
            new ChartData { month = "Jun", sales = 32, },
            new ChartData { month = "Jul", sales = 35, },
            new ChartData { month = "Aug", sales = 55, },
            new ChartData { month = "Sep", sales = 38, },
            new ChartData { month = "Oct", sales = 30, },
            new ChartData { month = "Nov", sales = 25, },
            new ChartData { month = "Dec", sales = 32, }
        };

    List<LineData> lineData = new List<LineData>
        {
            new LineData { x = 2013, y = 28, },
            new LineData { x = 2014, y = 25, },
            new LineData { x = 2015, y = 26, },
            new LineData { x = 2016, y = 27, },
            new LineData { x = 2017, y = 32, },
            new LineData { x = 2018, y = 35, }
        };

    List<PieData> pieData1 = new List<PieData>
        {
            new PieData { x = "Chrome", y = 37, text = "37%", },
            new PieData { x = "UC Browser", y = 17, text = "17%", },
            new PieData { x = "iPhone", y = 19, text = "19%", },
            new PieData { x = "Others", y = 4, text = "4%", },
            new PieData { x = "Opera", y = 11, text = "11%", },
            new PieData { x = "Android", y = 12, text = "12%", }
        };
}


<div>
    <!--  DashboardLayout element declaration -->
    <ejs-dashboardlayout id="dashboard" columns="6" draggableHandle=".e-panel-header" cellSpacing="@modelValue.cellSpacing">
        <e-dashboardlayout-panels>
            <e-dashboardlayout-panel id="Panel1" sizeX="3" sizeY="2" row="0" col="3">
                <e-content-template>
                    <div>
                        <div class="e-panel-container">
                            <div class="e-panel-header">
                                <div>
                                    Last year sales comparison
                                </div>
                            </div>
                            <div class="e-panel-content">
                                <!--   Column Chart element declaration -->
                                <ejs-chart id="columnChart" height="162px">
                                    <e-chart-primaryxaxis valueType="Category"></e-chart-primaryxaxis>
                                    <e-series-collection>
                                        <e-series dataSource="chartData" xName='month' yName='sales' type="@Syncfusion.EJ2.Charts.ChartSeriesType.Column">
                                        </e-series>
                                    </e-series-collection>
                                </ejs-chart>
                                <!-- end of column chart element -->
                            </div>
                        </div>
                    </div>
                </e-content-template>
            </e-dashboardlayout-panel>
            <e-dashboardlayout-panel id="Panel2" sizeX="3" sizeY="2" row="0" col="3">
                <e-content-template>
                    <div>
                        <div class="e-panel-container">
                            <div class="e-panel-header">
                                <div>
                                    Mobile browsers usage
                                </div>
                            </div>
                            <div class="e-panel-content">
                                <!--   Pie Chart element declaration -->
                                <ejs-accumulationchart id="pieChart1" enableAnimation="false" enableSmartLabels="true" height="162px">
                                    <e-accumulationchart-tooltipsettings enable="true" format="${point.x} : <b>${point.y}%</b>"></e-accumulationchart-tooltipsettings>
                                    <e-accumulationchart-legendsettings visible="false">
                                    </e-accumulationchart-legendsettings>
                                    <e-accumulation-series-collection>
                                        <e-accumulation-series dataSource="pieData1" xName="x" yName="y" radius="70%" name="Browser">
                                            <e-accumulationseries-datalabel name="text" visible="true" position="Inside">
                                            </e-accumulationseries-datalabel>
                                        </e-accumulation-series>
                                    </e-accumulation-series-collection>
                                </ejs-accumulationchart>
                                <!-- end of pie chart element -->
                            </div>
                        </div>
                    </div>
                </e-content-template>
            </e-dashboardlayout-panel>
            <e-dashboardlayout-panel id="Panel3" sizeX="3" sizeY="2" row="1" col="0">
                <e-content-template>
                    <div>
                        <div class="e-panel-container">
                            <div class="e-panel-header">
                                <div>
                                    Sales increase percentage
                                </div>
                            </div>
                            <div class="e-panel-content">
                                <!--   Line Chart element declaration -->
                                <ejs-chart id="lineChart" height="162px">
                                    <e-chart-primaryxaxis valueType="Category"></e-chart-primaryxaxis>
                                    <e-series-collection>
                                        <e-series dataSource="lineData" xName='x' yName='y' type="@Syncfusion.EJ2.Charts.ChartSeriesType.Line">
                                        </e-series>
                                    </e-series-collection>
                                </ejs-chart>
                                <!-- end of line chart element -->
                            </div>
                        </div>
                    </div>
                </e-content-template>
            </e-dashboardlayout-panel>
        </e-dashboardlayout-panels>
    </ejs-dashboardlayout>
    <!-- end of dashboardlayout element -->
</div>

<script>
    document.addEventListener('DOMContentLoaded', function () {
        var lineObj = document.getElementById('lineChart').ej2_instances[0];
        var pieObj = document.getElementById('pieChart1').ej2_instances[0];
        var splineObj = document.getElementById('columnChart').ej2_instances[0];
        lineObj.refresh(); pieObj.refresh(); splineObj.refresh();
    });
</script>
<style>
    /* DashboardLayout element styles  */
    .e-dashboard-layout.e-control .e-panel .e-panel-container .e-panel-header {
        color: rgba(0, 0, 0, 0.61);
    }

    .e-panel .e-header-text {
        padding: 12px 0 12px 0;
    }

    #dashboard .e-panel-container .e-panel-header {
        border-bottom: 1px solid #888383;
    }

    .e-dashboard-layout.e-control .e-panel:hover {
        border: 0px;
    }

    .e-dashboard-layout.e-control .e-panel .e-panel-header {
        font-size: 15px;
        font-weight: 500;
        height: 37px;
        padding: 10px;
        vertical-align: middle;
        /* text-align: left; */
        border-bottom: 0.5px solid rgba(0, 0, 0, .125);
    }

    .e-panel-header {
        padding: 10px;
        margin-bottom: 0;
        background-color: rgba(0, 0, 0, .03);
    }

    .e-dashboard-layout.e-control .e-panel .e-panel-header {
        height: 30px
    }

        .e-dashboard-layout.e-control .e-panel .e-panel-header div {
            text-align: center;
        }

    .header {
        padding: 5px;
        display: inline-block;
    }

    .e-panel-content {
        height: 162px;
    }
    /* custom generated icons styles */
    @@font-face {
        font-family: 'e-icons';
        src: url(data:application/x-font-ttf;charset=utf-8;base64,AAEAAAAKAIAAAwAgT1MvMjciQ6oAAAEoAAAAVmNtYXBH1Ec8AAABsAAAAHJnbHlmKcXfOQAAAkAAAAg4aGVhZBLt+DYAAADQAAAANmhoZWEHogNsAAAArAAAACRobXR4LvgAAAAAAYAAAAAwbG9jYQukCgIAAAIkAAAAGm1heHABGQEOAAABCAAAACBuYW1lR4040wAACngAAAJtcG9zdEFgIbwAAAzoAAAArAABAAADUv9qAFoEAAAA//UD8wABAAAAAAAAAAAAAAAAAAAADAABAAAAAQAAlbrm7l8PPPUACwPoAAAAANfuWa8AAAAA1+5ZrwAAAAAD8wPzAAAACAACAAAAAAAAAAEAAAAMAQIAAwAAAAAAAgAAAAoACgAAAP8AAAAAAAAAAQPqAZAABQAAAnoCvAAAAIwCegK8AAAB4AAxAQIAAAIABQMAAAAAAAAAAAAAAAAAAAAAAAAAAAAAUGZFZABA4QLhkANS/2oAWgPzAJYAAAABAAAAAAAABAAAAAPoAAAD6AAAA+gAAAPoAAAD6AAAA+gAAAPoAAAD6AAAA+gAAAPoAAAD6AAAAAAAAgAAAAMAAAAUAAMAAQAAABQABABeAAAADgAIAAIABuEC4QnhD+ES4RvhkP//AADhAuEJ4QvhEuEa4ZD//wAAAAAAAAAAAAAAAAABAA4ADgAOABYAFgAYAAAAAQACAAYABAADAAgABwAKAAkABQALAAAAAAAAAB4AQABaAQYB5gJkAnoCjgKwA8oEHAAAAAIAAAAAA+oDlQAEAAoAAAEFESERCQEVCQE1AgcBZv0mAXQB5P4c/g4Cw/D+lwFpAcP+s24BTf6qbgAAAAEAAAAAA+oD6gALAAATCQEXCQEHCQEnCQF4AYgBiGP+eAGIY/54/nhjAYj+eAPr/ngBiGP+eP54YwGI/nhjAYgBiAAAAwAAAAAD6gOkAAMABwALAAA3IRUhESEVIREhFSEVA9b8KgPW/CoD1vwq6I0B64wB640AAAEAAAAAA+oD4QCaAAABMx8aHQEPDjEPAh8bIT8bNS8SPxsCAA0aGhgMDAsLCwoKCgkJCQgHBwYGBgUEBAMCAgECAwUFBggICQoLCwwMDg0GAgEBAgIDBAMIBiIdHh0cHBoZFhUSEAcFBgQDAwEB/CoBAQMDBAUGBw8SFRYYGhsbHB0cHwsJBQQEAwIBAQMEDg0NDAsLCQkJBwYGBAMCAQEBAgIDBAQFBQYGBwgICAkJCgoKCwsLDAwMGRoD4gMEBwQFBQYGBwgICAkKCgsLDAwNDQ4ODxAQEBEWFxYWFhYVFRQUExIRERAOFxMLCggIBgYFBgQMDAwNDg4QDxERERIJCQkKCQkJFRQJCQoJCQgJEhERERAPDw4NDQsMBwgFBgYICQkKDAwODw8RERMTExUUFhUWFxYWFxEQEBAPDg4NDQwMCwsKCgkICAgHBgYFBQQEBQQAAAAAAwAAAAAD8wPzAEEAZQDFAAABMx8FFREzHwYdAg8GIS8GPQI/BjM1KwEvBT0CPwUzNzMfBR0CDwUrAi8FPQI/BTMnDw8fFz8XLxcPBgI+BQQDAwMCAT8EBAMDAwIBAQIDAwMEBP7cBAQDAwMCAQECAwMDBAQ/PwQEAwMDAgEBAgMDAwQE0AUEAwMDAgEBAgMDAwQFfAUEAwMDAgEBAgMDAwQFvRsbGRcWFRMREA4LCQgFAwEBAwUHCgsOEBETFRYXGRocHR4eHyAgISIiISAgHx4eHRsbGRcWFRMREA4LCQgFAwEBAwUHCgsOEBETFRYXGRsbHR4eHyAgISIiISAgHx4eAqYBAgIDBAQE/rMBAQEDAwQEBGgEBAQDAgIBAQEBAgIDBAQEaAQEBAMDAQEB0AECAwMDBAVoBAQDAwMCAeUBAgIEAwQEaAUEAwMDAgEBAgMDAwQFaAQEAwQCAgElERMVFhcZGhwdHh4fICAhIiIhICAfHh4dGxsZFxYVExEQDgsJCAUDAQEDBQcKCw4QERMVFhcZGxsdHh4fICAhIiIhICAfHh4dHBoZFxYVExEQDgsKBwUDAQEDBQcKCw4AAAIAAAAAA9MD6QALAE8AAAEOAQcuASc+ATceAQEHBgcnJgYPAQYWHwEGFBcHDgEfAR4BPwEWHwEeATsBMjY/ATY3FxY2PwE2Ji8BNjQnNz4BLwEuAQ8BJi8BLgErASIGApsBY0tKYwICY0pLY/7WEy4nfAkRBWQEAwdqAwNqBwMEZAURCXwnLhMBDgnICg4BEy4mfQkRBGQFAwhpAwNpCAMFZAQSCH0mLhMBDgrICQ4B9UpjAgJjSkpjAgJjAZWEFB4yBAYIrggSBlIYMhhSBhIIrggFAzIfE4QJDAwJhBQeMgQGCK4IEgZSGDIYUgYSCK4IBQMyHxOECQwMAAEAAAAAAwED6gAFAAAJAicJAQEbAef+FhoBzf4zA+v+Ff4VHwHMAc0AAAAAAQAAAAADAQPqAAUAAAEXCQEHAQLlHf4zAc0a/hYD6x7+M/40HwHrAAEAAAAAA/MD8wALAAATCQEXCQE3CQEnCQENAY7+cmQBjwGPZP5yAY5k/nH+cQOP/nH+cWQBjv5yZAGPAY9k/nEBjwAAAwAAAAAD8wPzAEAAgQEBAAAlDw4rAS8dPQE/DgUVDw4BPw47AR8dBRUfHTsBPx09AS8dKwEPHQL1DQ0ODg4PDw8QEBAQERERERUUFBQTExITEREREBAPDw0ODAwLCwkJCAcGBgQEAgIBAgIEAwUFBgYHBwkICQoCygECAgQDBQUGBgcHCQgJCv3QDQ0ODg4PDw8QEBAQERERERUUFBQTExITEREREBAPDw0ODAwLCwkJCAcGBgQEAgL8fgIDBQUHCAkKCwwNDg8PERESExQUFRYWFhgXGBkZGRoaGRkZGBcYFhYWFRQUExIREQ8PDg0MCwoJCAcFBQMCAgMFBQcICQoLDA0ODw8RERITFBQVFhYWGBcYGRkZGhoZGRkYFxgWFhYVFBQTEhERDw8ODQwLCgkIBwUFAwLFCgkICQcHBgYFBQMEAgIBAgIEBAYGBwgJCQsLDAwODQ8PEBARERETEhMTFBQUFREREREQEBAQDw8PDg4ODQ31ERERERAQEBAPDw8ODg4NDQIwCgkICQcHBgYFBQMEAgIBAgIEBAYGBwgJCQsLDAwODQ8PEBARERETEhMTFBQUFRoZGRkYFxgWFhYVFBQTEhERDw8ODQwLCgkIBwUFAwICAwUFBwgJCgsMDQ4PDxEREhMUFBUWFhYYFxgZGRkaGhkZGRgXGBYWFhUUFBMSEREPDw4NDAsKCQgHBQUDAgIDBQUHCAkKCwwNDg8PERESExQUFRYWFhgXGBkZGQAAAQAAAAAD6gPqAEMAABMhHw8RDw8hLw8RPw6aAswNDgwMDAsKCggIBwUFAwIBAQIDBQUHCAgKCgsMDAwODf00DQ4MDAwLCgoICAcFBQMCAQECAwUFBwgICgoLDAwMDgPrAQIDBQUHCAgKCgsLDA0NDv00Dg0NDAsLCgoICAcFBQMCAQECAwUFBwgICgoLCwwNDQ4CzA4NDQwLCwoKCAgHBQUDAgAAABIA3gABAAAAAAAAAAEAAAABAAAAAAABAA0AAQABAAAAAAACAAcADgABAAAAAAADAA0AFQABAAAAAAAEAA0AIgABAAAAAAAFAAsALwABAAAAAAAGAA0AOgABAAAAAAAKACwARwABAAAAAAALABIAcwADAAEECQAAAAIAhQADAAEECQABABoAhwADAAEECQACAA4AoQADAAEECQADABoArwADAAEECQAEABoAyQADAAEECQAFABYA4wADAAEECQAGABoA+QADAAEECQAKAFgBEwADAAEECQALACQBayBlLWljb25zLW1ldHJvUmVndWxhcmUtaWNvbnMtbWV0cm9lLWljb25zLW1ldHJvVmVyc2lvbiAxLjBlLWljb25zLW1ldHJvRm9udCBnZW5lcmF0ZWQgdXNpbmcgU3luY2Z1c2lvbiBNZXRybyBTdHVkaW93d3cuc3luY2Z1c2lvbi5jb20AIABlAC0AaQBjAG8AbgBzAC0AbQBlAHQAcgBvAFIAZQBnAHUAbABhAHIAZQAtAGkAYwBvAG4AcwAtAG0AZQB0AHIAbwBlAC0AaQBjAG8AbgBzAC0AbQBlAHQAcgBvAFYAZQByAHMAaQBvAG4AIAAxAC4AMABlAC0AaQBjAG8AbgBzAC0AbQBlAHQAcgBvAEYAbwBuAHQAIABnAGUAbgBlAHIAYQB0AGUAZAAgAHUAcwBpAG4AZwAgAFMAeQBuAGMAZgB1AHMAaQBvAG4AIABNAGUAdAByAG8AIABTAHQAdQBkAGkAbwB3AHcAdwAuAHMAeQBuAGMAZgB1AHMAaQBvAG4ALgBjAG8AbQAAAAACAAAAAAAAAAoAAAAAAAAAAAAAAAAAAAAAAAAAAAAAAAwBAgEDAQQBBQEGAQcBCAEJAQoBCwEMAQ0AB2hvbWUtMDELQ2xvc2UtaWNvbnMHbWVudS0wMQR1c2VyB0JUX2luZm8PU2V0dGluZ19BbmRyb2lkDWNoZXZyb24tcmlnaHQMY2hldnJvbi1sZWZ0CE1UX0NsZWFyDE1UX0p1bmttYWlscwRzdG9wAAA=) format('truetype');
        font-weight: normal;
        font-style: normal;
    }

    .handler.burg-icon:before {
        content: '\e10d';
        font-size: 16px;
    }

    .handler.burg-icon {
        float: right;
        padding-top: 2%;
    }
</style>
public class componentSpacingModel
{
public double[]? cellSpacing { get; set; }
}
public class ChartData
{
public string? month;
public double sales;
}
public class LineData
{
public double x;
public double y;
}
public class PieData
{
public string x;
public double y;
public string? text;
}NOTE
You can refer to our ASP.NET Core Dashboard Layout feature tour page for its groundbreaking feature representations. You can also explore our ASP.NET Core Dashboard Layout example to knows how to present and manipulate data.

