How can I help you?
Database data in Angular Chart component
13 Mar 20266 minutes to read
- Create the chart data table using a database. You can find the database table below.
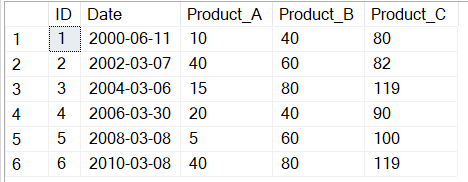
You can assign data from the database to the chart. The dataSource property of the series should be provided with the data from the server; it accepts a JavaScript array of objects.
  [
    { ID: 1, Date: "2000-06-11", Product_A: 10, Product_B: 40, Product_C: 80 },
    { ID: 2, Date: "2002-03-07", Product_A: 40, Product_B: 60, Product_C: 82 },
    { ID: 3, Date: "2004-03-06", Product_A: 15, Product_B: 80, Product_C: 119 },
    { ID: 4, Date: "2006-03-30", Product_A: 20, Product_B: 40, Product_C: 90 },
    { ID: 5, Date: "2008-03-08", Product_A: 5, Product_B: 60, Product_C: 100 },
    { ID: 6, Date: "2010-03-08", Product_A: 40, Product_B: 80, Product_C: 119 }
]- Using the Angular CLI, use a service to get data from the database.
ng generate service chartThe command generates ChartService class in src/app/chart.service.ts as follows:
import { Injectable } from '@angular/core';

@Injectable({
  providedIn: 'root',
})
export class ChartService {

  constructor() { }

}- Create a function call inside
ngOnInit()to fetch the chart data from the service inapp.component.tsfile.
app.component.ts (partial)
ngOnInit(): void {
  this.getData();
}

getData(): void {
  this.chartService.get().subscribe(data => {
    this.data = data;
  });
}
app.module.ts
import { BrowserModule } from '@angular/platform-browser';
import { NgModule } from '@angular/core';
// import the ChartModule for the Chart component
import { ChartModule, DateTimeService, LineSeriesService, DateTimeCategoryService, StripLineService} from '@syncfusion/ej2-angular-charts';
import { AppRoutingModule } from './app-routing.module';
import { AppComponent } from './app.component';
import { ChartService } from './chart.service';
import { HttpClientModule } from '@angular/common/http';


@NgModule({
  declarations: [
    AppComponent
  ],
  imports: [
    BrowserModule, ChartModule, HttpClientModule,
    AppRoutingModule
  ],
  providers: [ChartService, DateTimeService, LineSeriesService, DateTimeCategoryService, StripLineService],
  bootstrap: [AppComponent]
})
export class AppModule { }
The Angular HttpClient method returns an Observable.
chart.service.ts
import { Injectable } from '@angular/core';
import { HttpClient } from '@angular/common/http';
import { Observable } from 'rxjs';

@Injectable({
  providedIn: 'root'
})
export class ChartService {
  constructor(private http: HttpClient) { }

  get(): Observable<any> {
    return this.http.get('YOUR BACKEND URL');
  }
}
In app.component.ts, configure the primaryXAxis and primaryYAxis properties to define the chart axes, and set the title property to display a chart heading. The valueType and labelFormat properties are configured on the X-axis to parse the date values correctly. Each series uses the type, xName, yName, name, and marker properties to define how the data is rendered.
app.component.ts
import { Component, OnInit } from '@angular/core';
import { ChartService } from './chart.service';
@Component({
selector: 'app-root',
template: `<ejs-chart id="chart-container" [primaryXAxis]='primaryXAxis' [primaryYAxis]='primaryYAxis' [title]='title'>
<e-series-collection>
<e-series [dataSource]='data' type='Line' xName='Date' [marker]='marker' yName='Product_A' name='Product A'></e-series>
<e-series [dataSource]='data' type='Line' xName='Date' [marker]='marker' yName='Product_B' name='Product B'></e-series>
<e-series [dataSource]='data' type='Line' xName='Date' [marker]='marker' yName='Product_C' name='Product C'></e-series>
</e-series-collection>
</ejs-chart>`,
styleUrls: ['./app.component.sass']
})
export class AppComponent implements OnInit {
public primaryXAxis: object;
public title: string;
public primaryYAxis: object;
public marker: object;
public data: object[];
constructor(private chartService: ChartService) { }
ngOnInit(): void {
this.primaryXAxis = {
valueType: 'DateTime',
title: 'Sales Across Years',
labelFormat: 'yMMM'
};
this.primaryYAxis = {
title: 'Sales Amount in millions(USD)'
};
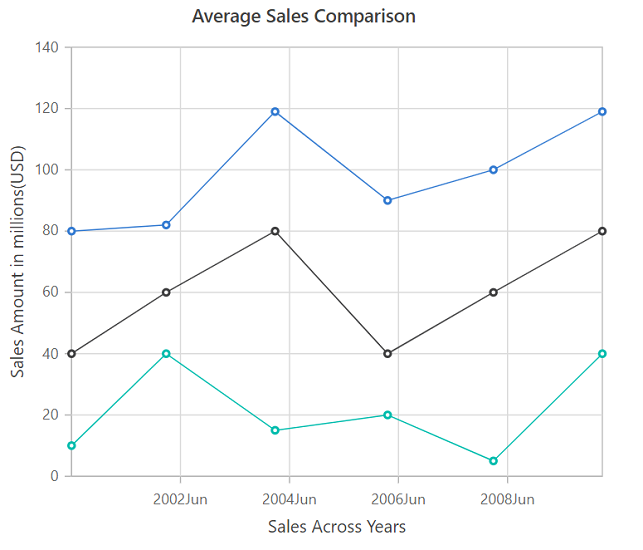
this.title = 'Average Sales Comparison';
this.marker = { visible: true };
this.getData();
}
getData(): void {
this.chartService.get().subscribe(data => {
this.data = data;
});
}
}The following screenshot shows the chart that fetches the data from the server.