Annotations in Angular Chart
31 Aug 202624 minutes to read
In this guide, you’ll learn how to add, position, and customize annotations in the Syncfusion Angular Chart component to highlight trends, thresholds, and other details directly inside the chart area.
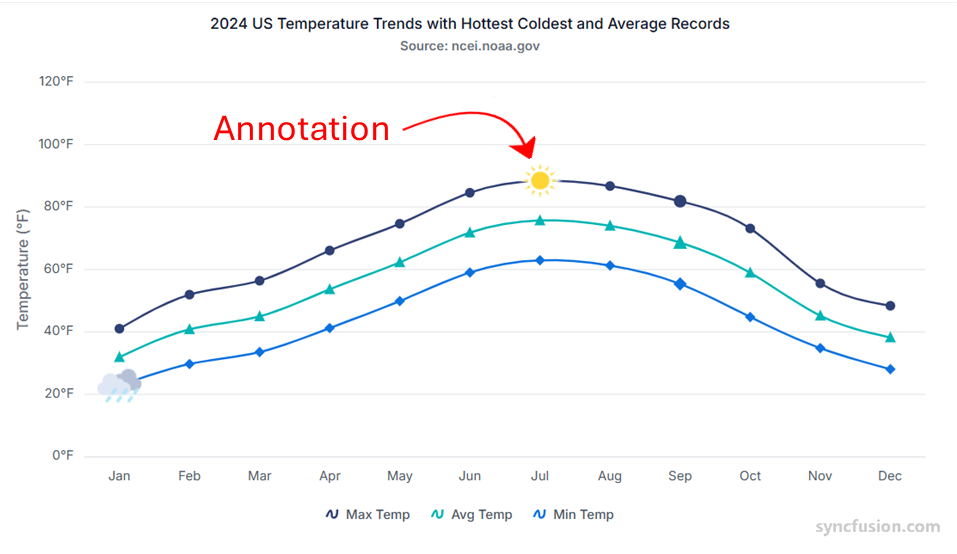
Chart annotations allow highlighting specific areas of the chart using text, shapes, images, or custom HTML elements. Annotations can be used to emphasize trends, mark thresholds, show custom notes, or surface extra details inline within the chart area.
Prerequisites
Before adding annotations, make sure the package below is installed:
-
@syncfusion/ej2-angular-charts— see the Syncfusion Angular compatibility matrix for the supported Angular version range.
For a step-by-step setup, see Getting Started with Angular Chart.
Note: To use the annotation feature in Chart, add
ChartAnnotationServiceto the standalone component’sproviders(or to@NgModule.providersfor non-standalone apps). See the snippet below for an example.
Annotations are added using the annotations option. Set the content property to specify the HTML or template string that should be rendered within the chart.
To know more about annotations, you can check on this video:
import { ChartModule } from '@syncfusion/ej2-angular-charts'
import { CategoryService, DateTimeService, ScrollBarService, ColumnSeriesService, LineSeriesService,
    ChartAnnotationService, RangeColumnSeriesService, StackingColumnSeriesService,LegendService, TooltipService
 } from '@syncfusion/ej2-angular-charts'


import { Component, OnInit } from '@angular/core';
@Component({
imports: [
         ChartModule
    ],

providers: [ CategoryService, DateTimeService, ScrollBarService, LineSeriesService, ColumnSeriesService,
        ChartAnnotationService, RangeColumnSeriesService, StackingColumnSeriesService, LegendService, TooltipService,],
standalone: true,
    selector: 'app-container',
    template: `<ejs-chart id="chart-container" [primaryXAxis]='primaryXAxis'[primaryYAxis]='primaryYAxis' [title]='title'>
        <e-annotations>
            <e-annotation  content='70 Gold Medals' region='Series' coordinateUnits='Point' x='Japan' y=75>
            </e-annotation>
        </e-annotations>
        <e-series-collection>
            <e-series [dataSource]='chartData' type='Column' xName='country' yName='gold' name='Gold'></e-series>
        </e-series-collection>
    </ejs-chart>`
})
export class AppComponent implements OnInit {
    public primaryXAxis?: Object;
    public chartData?: Object[];
    public title?: string;
    public primaryYAxis?: Object;
    ngOnInit(): void {
        this.chartData = [
             { country: "USA", gold: 50 },
             { country: "China", gold: 40 },
             { country: "Japan", gold: 70 },
             { country: "Australia", gold: 60 },
             { country: "France", gold: 50 },
             { country: "Germany", gold: 40 },
             { country: "Italy", gold: 40 },
             { country: "Sweden", gold: 30 }
        ];
        this.primaryXAxis = {
           valueType: 'Category',
           title: 'Countries'
        };
        this.primaryYAxis = {
            minimum: 0, maximum: 80,
            interval: 20, title: 'Medals'
        };
        this.title = 'Olympic Medals';
    }

}
import { bootstrapApplication } from '@angular/platform-browser';
import { AppComponent } from './app.component';
bootstrapApplication(AppComponent).catch((err) => console.error(err));Region
Annotations can be positioned relative to either the overall Chart area or a specific Series using the region property. When placed relative to the chart, the annotation uses the chart’s coordinate system. When placed relative to a series, the annotation aligns with that series’ data points, so the annotation’s x value must match the category/name defined by the series’ xName. By default, annotations are placed with respect to the Chart.
import { ChartModule } from '@syncfusion/ej2-angular-charts'
import { CategoryService, DateTimeService, ScrollBarService, ColumnSeriesService, LineSeriesService,
    ChartAnnotationService, RangeColumnSeriesService, StackingColumnSeriesService,LegendService, TooltipService
 } from '@syncfusion/ej2-angular-charts'


import { Component, OnInit } from '@angular/core';
import { columnData } from './datasource';
@Component({
imports: [
         ChartModule
    ],

providers: [ CategoryService, DateTimeService, ScrollBarService, LineSeriesService, ColumnSeriesService,
        ChartAnnotationService, RangeColumnSeriesService, StackingColumnSeriesService, LegendService, TooltipService,],
standalone: true,
    selector: 'app-container',
    template: `<ejs-chart id="chart-container" [primaryXAxis]='primaryXAxis'[primaryYAxis]='primaryYAxis' [title]='title'>
        <e-annotations>
            <e-annotation  content='<div>Highest Medal Count</div>' region='Series' coordinateUnits='Point' x='Japan' y=75>
            </e-annotation>
        </e-annotations>
        <e-series-collection>
            <e-series [dataSource]='chartData' type='Column' xName='country' yName='gold' name='Gold'></e-series>
        </e-series-collection>
    </ejs-chart>`
})
export class AppComponent implements OnInit {
    public primaryXAxis?: Object;
    public chartData?: Object[];
    public title?: string;
    public primaryYAxis?: Object;
    ngOnInit(): void {
        this.chartData = columnData;
        this.primaryXAxis = {
           valueType: 'Category',
           title: 'Countries'
        };
        this.primaryYAxis = {
            minimum: 0, maximum: 80,
            interval: 20, title: 'Medals'
        };
        this.title = 'Olympic Medals';
    }

}
import { bootstrapApplication } from '@angular/platform-browser';
import { AppComponent } from './app.component';
bootstrapApplication(AppComponent).catch((err) => console.error(err));Coordinate Units
Use the coordinateUnits property to define how annotation coordinates are interpreted. The default value is Pixel. Choose between:
-
Pixel– The annotation is positioned using fixed pixel values within the chart area. -
Point– The annotation is positioned based on chart data points (xandyvalues).
When using Point, the x value must match a value your x-axis can resolve: a category label (e.g. 'Japan') for valueType: 'Category'; a Date or DateOffset value for valueType: 'DateTime'; or a numeric value for valueType: 'Double'. For region='Chart', x must still resolve against the primary x-axis and y against the primary y-axis; for region='Series', x must match the series’ xName value.
import { ChartModule } from '@syncfusion/ej2-angular-charts'
import { CategoryService, DateTimeService, ScrollBarService, ColumnSeriesService, LineSeriesService,
    ChartAnnotationService, RangeColumnSeriesService, StackingColumnSeriesService,LegendService, TooltipService
 } from '@syncfusion/ej2-angular-charts'


import { Component, OnInit } from '@angular/core';
import { columnData } from './datasource';
@Component({
imports: [
         ChartModule
    ],

providers: [ CategoryService, DateTimeService, ScrollBarService, LineSeriesService, ColumnSeriesService,
        ChartAnnotationService, RangeColumnSeriesService, StackingColumnSeriesService, LegendService, TooltipService,],
standalone: true,
    selector: 'app-container',
    template: `<ejs-chart id="chart-container" [primaryXAxis]='primaryXAxis'[primaryYAxis]='primaryYAxis' [title]='title'>
        <e-annotations>
            <e-annotation  content='<div style="border: 1px solid black; padidng: 5px 5px 5px 5px, backgrund:#f5f5f5">Annotation in Pixel</div>'
             coordinateUnits='Pixel' x=150 y=75>
            </e-annotation>
        </e-annotations>
        <e-series-collection>
            <e-series [dataSource]='chartData' type='Column' xName='country' yName='gold' name='Gold'></e-series>
        </e-series-collection>
    </ejs-chart>`
})
export class AppComponent implements OnInit {
    public primaryXAxis?: Object;
    public chartData?: Object[];
    public title?: string;
    public primaryYAxis?: Object;
    ngOnInit(): void {
        this.chartData = columnData;
        this.primaryXAxis = {
           valueType: 'Category',
           title: 'Countries'
        };
        this.primaryYAxis = {
            minimum: 0, maximum: 80,
            interval: 20, title: 'Medals'
        };
        this.title = 'Olympic Medals';
    }

}
import { bootstrapApplication } from '@angular/platform-browser';
import { AppComponent } from './app.component';
bootstrapApplication(AppComponent).catch((err) => console.error(err));Alignment
Annotation provides verticalAlignment and horizontalAlignment. The verticalAlignment can be customized via Top, Bottom, or Middle (default: Middle); the horizontalAlignment can be customized via Near, Far, or Center (default: Center).
import { ChartModule } from '@syncfusion/ej2-angular-charts'
import { CategoryService, DateTimeService, ScrollBarService, ColumnSeriesService, LineSeriesService,
    ChartAnnotationService, RangeColumnSeriesService, StackingColumnSeriesService,LegendService, TooltipService
 } from '@syncfusion/ej2-angular-charts'


import { Component, OnInit } from '@angular/core';
import { columnData } from './datasource';
@Component({
imports: [
         ChartModule
    ],

providers: [ CategoryService, DateTimeService, ScrollBarService, LineSeriesService, ColumnSeriesService,
        ChartAnnotationService, RangeColumnSeriesService, StackingColumnSeriesService, LegendService, TooltipService,],
standalone: true,
    selector: 'app-container',
    template: `<ejs-chart id="chart-container" [primaryXAxis]='primaryXAxis'[primaryYAxis]='primaryYAxis' [title]='title'>
        <e-annotations>
            <e-annotation  content='<div style="border: 1px solid black; padidng: 5px 5px 5px 5px, backgrund:#f5f5f5">Highest Medal Count</div>'
           verticalAlignment='Top' horizontalAlignment='Near' x='France' y=50>
            </e-annotation>
        </e-annotations>
        <e-series-collection>
            <e-series [dataSource]='chartData' type='Column' xName='country' yName='gold' name='Gold'></e-series>
        </e-series-collection>
    </ejs-chart>`
})
export class AppComponent implements OnInit {
    public primaryXAxis?: Object;
    public chartData?: Object[];
    public title?: string;
    public primaryYAxis?: Object;
    public border?: Object;
    public margin?: Object;
    ngOnInit(): void {
        this.chartData = columnData;
        this.primaryXAxis = {
           valueType: 'Category',
           title: 'Countries'
        };
        this.primaryYAxis = {
            minimum: 0, maximum: 80,
            interval: 20, title: 'Medals'
        };
        this.title = 'Olympic Medals';
    }

}
import { bootstrapApplication } from '@angular/platform-browser';
import { AppComponent } from './app.component';
bootstrapApplication(AppComponent).catch((err) => console.error(err));Annotation Customization
Use annotations to enrich the chart with custom visuals such as dashed reference lines, watermarks, footers, y-axis subtitles, and stacked-column totals. The samples in this section cover each scenario.
Y-Axis Subtitle
By setting a text <div> in the content option of an annotation object, you can add a subtitle to the chart y-axis. Set coordinateUnits to Pixel, adjust the x and y location of the text (the sample below positions the subtitle near the top-left of the y-axis), and apply transform: rotate(-90deg) to a <div> wrapper inside content so the subtitle orients vertically alongside the y-axis.
import { ChartModule } from '@syncfusion/ej2-angular-charts'
import { CategoryService, DateTimeService, ScrollBarService, ColumnSeriesService, LineSeriesService,
    ChartAnnotationService, RangeColumnSeriesService, StackingColumnSeriesService,LegendService, TooltipService
 } from '@syncfusion/ej2-angular-charts'


import { Component, OnInit } from '@angular/core';
import { columnData } from './datasource';
@Component({
imports: [
         ChartModule
    ],

providers: [ CategoryService, DateTimeService, ScrollBarService, LineSeriesService, ColumnSeriesService,
        ChartAnnotationService, RangeColumnSeriesService, StackingColumnSeriesService, LegendService, TooltipService,],
standalone: true,
    selector: 'app-container',
    template: `<ejs-chart id="chart-container" [primaryXAxis]='primaryXAxis'[primaryYAxis]='primaryYAxis' [title]='title'>
        <e-annotations>
            <e-annotation content='<div id="text" style="transform: rotate(-90deg);">Speed</div>'
           verticalAlignment='Top' horizontalAlignment='Near' x=18 y=180 coordinateUnits='Pixel'>
            </e-annotation>
        </e-annotations>
        <e-series-collection>
            <e-series [dataSource]='chartData' type='Column' xName='country' yName='gold' name='Gold'></e-series>
        </e-series-collection>
    </ejs-chart>
    <style></style>`
})
export class AppComponent implements OnInit {
    public primaryXAxis?: Object;
    public chartData?: Object[];
    public title?: string;
    public primaryYAxis?: Object;
    public border?: Object;
    public margin?: Object;
    ngOnInit(): void {
        this.chartData = columnData;
        this.primaryXAxis = {
           valueType: 'Category',
           title: 'Countries'
        };
        this.primaryYAxis = {
            minimum: 0, maximum: 80,
            interval: 20, title: 'm3/min'
        };
        this.title = 'Olympic Medals';
    }

}
import { bootstrapApplication } from '@angular/platform-browser';
import { AppComponent } from './app.component';
bootstrapApplication(AppComponent).catch((err) => console.error(err));Dotted Line
Set the annotation coordinateUnits to Point to draw a horizontal dashed line anchored at a specific data point. Although the line is anchored at one (x, y) position, the wrapper <div> inside content uses width: 10000px with border-top: 3px dashed so the dashed bar visually spans across the plot area from that data point.
import { ChartModule, ChartAllModule, AccumulationChartAllModule } from '@syncfusion/ej2-angular-charts'
import { GridModule } from '@syncfusion/ej2-angular-grids'
import { PageService } from '@syncfusion/ej2-angular-grids'
import { AccumulationChartModule } from '@syncfusion/ej2-angular-charts'
import { DialogModule } from '@syncfusion/ej2-angular-popups'
import { PieSeriesService, AccumulationTooltipService, AccumulationDataLabelService } from '@syncfusion/ej2-angular-charts'
import {
    LineSeriesService, DateTimeService, DataLabelService, StackingColumnSeriesService, CategoryService,
    StepAreaSeriesService, SplineSeriesService, ScrollBarService, ChartAnnotationService, LegendService, TooltipService, StripLineService,
    SelectionService, ScatterSeriesService, ZoomService, ColumnSeriesService, AreaSeriesService, RangeAreaSeriesService
} from '@syncfusion/ej2-angular-charts'


import { Component, OnInit } from '@angular/core';

@Component({
imports: [
         ChartModule, ChartAllModule, AccumulationChartAllModule, AccumulationChartModule, GridModule, DialogModule
    ],

providers: [LineSeriesService, DateTimeService, ColumnSeriesService, DataLabelService, ZoomService, StackingColumnSeriesService, CategoryService,
        StepAreaSeriesService, SplineSeriesService, ChartAnnotationService, LegendService, TooltipService, StripLineService,
        PieSeriesService, AccumulationTooltipService, ScrollBarService, AccumulationDataLabelService, SelectionService, ScatterSeriesService,
        PageService, AreaSeriesService, RangeAreaSeriesService ],
standalone: true,
    selector: 'app-container',
    template: `<ejs-chart id="chart-container" [primaryXAxis]='primaryXAxis' [title]='title'
     [tooltip]='tooltip'>
     <e-annotations>
    <e-annotation visible = true
                    content='<div id = "test" style="border-top:3px dashed grey;border-top-width: 2px; width: 10000px"></div>'
                    x = '2014' y = 50
                    coordinateUnits='Point'>
                </e-annotation>
            </e-annotations>
        <e-series-collection>
            <e-series [dataSource]='chartData' type='Line' xName='x' yName='y' name='Max Temp'></e-series>
        </e-series-collection>
    </ejs-chart>`
})
export class AppComponent implements OnInit {
    public primaryXAxis?: Object;
    public chartData?: Object[];
    public title?: string;
    public marker?: Object;
    public primaryYAxis?: Object;
    public tooltip: Object = {
        enable: true
    };
    ngOnInit(): void {
        this.chartData =[
        { x: '2014', y:34 }, { x: '2015', y: 38 },
        { x: '2016', y: 44 }, { x: '2017', y: 51 },
        { x: '2018', y: 61 }, { x: '2019', y: 76 },
        { x: '2020', y: 82 }
                ];
        this.primaryXAxis = {
        valueType: 'Category'
        };
        this.title =  'NC Weather Report - 2016';
    }
}
import { bootstrapApplication } from '@angular/platform-browser';
import { AppComponent } from './app.component';
bootstrapApplication(AppComponent).catch((err) => console.error(err));Watermark
Use an annotation to add a watermark to the chart. Initialize the element with the annotation property and provide the HTML for the watermark via the content option. In the example below the watermark text is “syncfusion”, positioned with coordinateUnits='Point' so it aligns with a category on the x-axis (matching a category label such as 'Wed').
    <!-- watermark for chart -->
       <e-annotations>
            <e-annotation  content='<div id="chart_cloud" style="font-size:450%; opacity: 0.3;" >syncfusion</div>'
            x='Wed' y= 20 coordinateUnits= 'Point' horizontalAlignment='Center'>
            </e-annotation>
        </e-annotations>
Footer
Use the x and y options of the annotation object to place a footer at the bottom of the chart. Use coordinateUnits='Pixel' with absolute coordinates (the values shown assume a chart of approximately 800 × 480 pixels; adjust x and y based on your chart’s actual size, and note that pixel offsets may shift on responsive resize because Pixel units are tied to the chart’s outer dimensions).
<!-- footer for chart -->
<e-annotations>
        <e-annotation  content='<div id="chart" > <a href="https://www.syncfusion.com" target="_blank" aria-label="Visit Syncfusion website">www.syncfusion.com</a></div>'
            x=400 y=440 coordinateUnits='Pixel' horizontalAlignment='Center'>
            </e-annotation>
</e-annotations>import { ChartModule, ChartAllModule, AccumulationChartAllModule } from '@syncfusion/ej2-angular-charts'
import { AccumulationChartModule } from '@syncfusion/ej2-angular-charts'
import { PieSeriesService, AccumulationTooltipService, AccumulationDataLabelService } from '@syncfusion/ej2-angular-charts'
import {
LineSeriesService, DateTimeService, DataLabelService, StackingColumnSeriesService, CategoryService,
StepAreaSeriesService, SplineSeriesService, ScrollBarService, ChartAnnotationService, LegendService, TooltipService, StripLineService,
SelectionService, ScatterSeriesService, ZoomService, ColumnSeriesService, AreaSeriesService, RangeAreaSeriesService
} from '@syncfusion/ej2-angular-charts'
import { Component, OnInit } from '@angular/core';
@Component({
imports: [
ChartModule, ChartAllModule, AccumulationChartAllModule, AccumulationChartModule
],
providers: [LineSeriesService, DateTimeService, ColumnSeriesService, DataLabelService, ZoomService, StackingColumnSeriesService, CategoryService,
StepAreaSeriesService, SplineSeriesService, ChartAnnotationService, LegendService, TooltipService, StripLineService,
PieSeriesService, AccumulationTooltipService, ScrollBarService, AccumulationDataLabelService, SelectionService, ScatterSeriesService,
AreaSeriesService, RangeAreaSeriesService ],
standalone: true,
selector: 'app-container',
template: `<ejs-chart id="chart-container" [primaryXAxis]='primaryXAxis'[primaryYAxis]='primaryYAxis' [title]='title'>
<e-annotations>
<e-annotation content='<div id="chart_cloud" style="font-size:450%; opacity: 0.3;" >syncfusion</div>'
x='Wed' y= 20 coordinateUnits= 'Point' horizontalAlignment='Center'>
</e-annotation>
<e-annotation content='<div id="chart" > <a href="https://www.syncfusion.com" target="_blank">www.syncfusion.com</a></div>'
x=400 y=440 coordinateUnits='Pixel' horizontalAlignment='Center'>
</e-annotation>
</e-annotations>
<e-series-collection>
<e-series [dataSource]='chartData' type='Spline' xName='x' yName='y' name='Max Temp' width=2 [marker]='marker'></e-series>
</e-series-collection>
</ejs-chart>`
})
export class AppComponent implements OnInit {
public primaryXAxis?: Object;
public chartData?: Object[];
public title?: string;
public marker?: Object;
public primaryYAxis?: Object;
ngOnInit(): void {
this.chartData =[
{ x: 'Sun', y: 15 }, { x: 'Mon', y: 5 },{ x: 'Tue', y: 32 },
{ x: 'Wed', y: 15 },{ x: 'Thu', y: 29 }, { x: 'Fri', y: 24 },
{ x: 'Sat', y: 18 },
];
this.primaryXAxis = {
valueType: 'Category',
interval: 1, majorGridLines: { width: 0 },
labelIntersectAction: 'Rotate90'
};
this.primaryYAxis = {
minimum: 0,
maximum: 40,
interval: 10,
};
this.marker = { visible: true};
this.title = 'NC Weather Report - 2016';
}
}import { bootstrapApplication } from '@angular/platform-browser';
import { AppComponent } from './app.component';
bootstrapApplication(AppComponent).catch((err) => console.error(err));Stacking Total
To show the total at each stacked data point, handle the annotationRender event (the binding (annotationRender)='annotationRender($event)' is shown in the snippet below) to compute the series’ stacked value (visibleSeries[lastIndex].stackedValues.endValues[index] — see Series.stackedValues) and update the annotation content’s nested <span> (args.content.children[0].children[0].innerHTML) before each annotation is rendered.
import { ChartModule, ChartAllModule, AccumulationChartAllModule } from '@syncfusion/ej2-angular-charts'
import { GridModule } from '@syncfusion/ej2-angular-grids'
import { PageService } from '@syncfusion/ej2-angular-grids'
import { AccumulationChartModule } from '@syncfusion/ej2-angular-charts'
import { DialogModule } from '@syncfusion/ej2-angular-popups'
import { PieSeriesService, AccumulationTooltipService, AccumulationDataLabelService } from '@syncfusion/ej2-angular-charts'
import {
    LineSeriesService, DateTimeService, DataLabelService, StackingColumnSeriesService, CategoryService,
    StepAreaSeriesService, SplineSeriesService, ScrollBarService, ChartAnnotationService, LegendService, TooltipService, StripLineService,
    SelectionService, ScatterSeriesService, ZoomService, ColumnSeriesService, AreaSeriesService, RangeAreaSeriesService
} from '@syncfusion/ej2-angular-charts'


import { Component, OnInit, ViewChild } from '@angular/core';
import { IAnnotationRenderEventArgs, Series } from '@syncfusion/ej2-angular-charts';
import { ChartComponent } from '@syncfusion/ej2-angular-charts';

@Component({
imports: [
         ChartModule, ChartAllModule, AccumulationChartAllModule, AccumulationChartModule, GridModule, DialogModule
    ],

providers: [LineSeriesService, DateTimeService, ColumnSeriesService, DataLabelService, ZoomService, StackingColumnSeriesService, CategoryService,
        StepAreaSeriesService, SplineSeriesService, ChartAnnotationService, LegendService, TooltipService, StripLineService,
        PieSeriesService, AccumulationTooltipService, ScrollBarService, AccumulationDataLabelService, SelectionService, ScatterSeriesService,
        PageService, AreaSeriesService, RangeAreaSeriesService ],
standalone: true,
    selector: 'app-container',
    template: `<ejs-chart #chart id="chart-container" [primaryXAxis]='primaryXAxis'[primaryYAxis]='primaryYAxis' [title]='title' (annotationRender) = 'annotationRender($event)'>
         <e-annotations>
            <e-annotation content='<div id="point1" style="font-size:11px;font-weight:bold;color:gray;fill:gray;"><span>12</span></div>'
               x='Jamesh' y='11' coordinateUnits='Point' region='Series'>
            </e-annotation>
            <e-annotation content='<div id="point1" style="font-size:11px;font-weight:bold;color:gray;fill:gray;"><span>12</span></div>'
               x='Michael' y='10' coordinateUnits='Point' region='Series'>
            </e-annotation>
            <e-annotation content='<div id="point1" style="font-size:11px;font-weight:bold;color:gray;fill:gray;"><span>12</span></div>'
               x='John' y='12' coordinateUnits= 'Point' region='Series'>
            </e-annotation>
        </e-annotations>
        <e-series-collection>
            <e-series [dataSource]='data1' type='StackingColumn' xName='x' yName='y' name='Apple' [marker]='marker'></e-series>
                <e-series [dataSource]='data2' type='StackingColumn' xName='x' yName='y' name='Orange' [marker]='marker'></e-series>
                <e-series [dataSource]='data3' type='StackingColumn' xName='x' yName='y' name='Grapes' [marker]='marker'></e-series>
        </e-series-collection>
    </ejs-chart>`
})
export class AppComponent implements OnInit {
    public primaryXAxis?: Object;
    public data1?: Object[];
    public data2?: Object[];
    public data3?: Object[];
    public title?: string;
    public marker?: Object;
    public primaryYAxis?: Object;
    public i:number = 0;
    @ViewChild('chart')
    public chart?:ChartComponent;
    public annotationRender(args: IAnnotationRenderEventArgs):void{
          let length = this.chart!.series.length - 1;
          let value = ((this.chart as ChartComponent ).visibleSeries[length] as any).stackedValues.endValues[this.i];
          this.i += (this.i == length) ? -length : 1;
          args.content.children[0].children[0].innerHTML = value.toString();
        }
    ngOnInit(): void {
        this.data1 = [{ x: 'Jamesh', y: 5 }, { x: 'Michael', y: 4 }, { x: 'John', y: 5 }];
        this.data2 = [{ x: 'Jamesh', y: 4 }, { x: 'Michael', y: 3 }, { x: 'John', y: 4 }];
        this.data3 = [{ x: 'Jamesh', y: 1 }, { x: 'Michael', y: 2 }, { x: 'John', y: 2 }];
        this.primaryXAxis = {
           title: 'Manager',
            valueType: 'Category', interval: 1, majorGridLines: { width: 0 }
            };
        this.marker = { dataLabel: { visible: true, position: 'Top', font: { fontWeight: '600', color: '#ffffff' }}};
        this.title =  'Fruit Consumption';
    }
}
import { bootstrapApplication } from '@angular/platform-browser';
import { AppComponent } from './app.component';
bootstrapApplication(AppComponent).catch((err) => console.error(err));Binding to Multiple Axes
When the chart has more than one x-axis or y-axis, target a specific axis by setting the annotation’s xAxisName and yAxisName properties to the corresponding axis names declared on the chart.
<e-annotations>
    <e-annotation
        content='<div>Annotation on secondary y-axis</div>'
        xAxisName='secondaryX'
        yAxisName='secondaryY'
        coordinateUnits='Pixel'
        x=10 y=10>
    </e-annotation>
</e-annotations>
The full multi-axis chart setup (including axes array and axis naming) is documented under Multi-Panes.
Troubleshooting
If the annotation does not render or behaves unexpectedly, check the following:
-
Service not provided – Console shows
ChartAnnotationServiceerrors when an annotation is added without registering the service. ConfirmChartAnnotationServiceis listed in the componentproviders(or in@NgModule.providersfor module-based apps). -
Annotation not appearing – When using
coordinateUnits='Point', verify that thex/yvalues resolve against the axis. Withregion='Series',xmust match the series’xNamevalue; withregion='Chart',xmust match the primary x-axis value. -
Pixel offset mismatch – Pixel units depend on the chart’s outer width and height. If the chart is rendered inside a responsive container, recompute
x/yafter resize or switch toPointunits. -
Empty or broken HTML – The
contentis parsed as HTML; quotes and entities must be escaped correctly inside the template.
See Also
- Dynamically Update Annotation Content on Point Click in Angular Chart
-
Chart Events — for a list of supported chart events, including
annotationRender.