How can I help you?
Getting Started with the Vue HeatMap Component in Vue 3
10 Feb 202620 minutes to read
This article provides a step-by-step guide for setting up a Vite project with a JavaScript environment and integrating the Syncfusion® Vue HeatMap component using the Composition API / Options API.
Vue 3 supports two authoring styles: the Composition API (recommended for new projects) and the Options API (the traditional Vue 2 pattern). Both approaches are covered in this guide using practical code examples. Choose the style that best fits your project requirements.
You can explore some useful features in the HeatMap component using the video below.
Prerequisites
Before beginning, ensure the following prerequisites are met:
- Node.js: Version 14 or later installed on your system
- Package Manager: NPM (v6+) or Yarn (v1.22+)
- Code Editor: Any JavaScript-enabled editor (e.g., Visual Studio Code)
- Syncfusion License (for production use): Review licensing requirements
For detailed system requirements, refer to System requirements for Syncfusion Vue UI components
Set up the Vite project
A recommended approach for beginning with Vue is to scaffold a project using Vite. To create a new Vite project, use one of the commands that are specific to either NPM or Yarn.
npm create vite@latestor
yarn create viteUsing one of the above commands will lead you to set up additional configurations for the project as below:
1.Define the project name: We can specify the name of the project directly. Let’s specify the name of the project as my-project for this article.
? Project name: » my-project2.Select Vue as the framework. It will create a Vue 3 project.
? Select a framework: » - Use arrow-keys. Return to submit.
Vanilla
> Vue
  React
  Preact
  Lit
  Svelte
  Others
3.Choose JavaScript as the framework variant to build this Vite project using JavaScript and Vue.
? Select a variant: » - Use arrow-keys. Return to submit.
> JavaScript
  TypeScript
  Customize with create-vue ↗
  Nuxt ↗
4.Upon completing the aforementioned steps to create the my-project, run the following command to install its dependencies:
cd my-project
npm install
or
cd my-project
yarn install
Now that my-project is ready to run with default settings, let’s add Syncfusion® components to the project.
Add Syncfusion® Vue packages
Syncfusion® Vue component packages are available at npmjs.com. To use Syncfusion® Vue components in the project, install the corresponding npm package.
This article uses the Vue HeatMap component as an example. To use the Vue HeatMap component in the project, the @syncfusion/ej2-vue-heatmap package needs to be installed using the following command:
npm install @syncfusion/ej2-vue-heatmap --saveor
yarn add @syncfusion/ej2-vue-heatmapAdd Syncfusion® Vue component
Follow the below steps to add the Vue HeatMap component using Composition API or Options API:
- Import and register the HeatMap component and its child directives in the
scriptsection of the src/App.vue file. For the Composition API, add thesetupattribute to thescripttag to enable the Composition API syntax. The component will be automatically registered in the template.
<script setup>
import { HeatMapComponent  as EjsHeatmap, Tooltip, Legend }  from "@syncfusion/ej2-vue-heatmap";
import { HeatMap } from '@syncfusion/ej2-heatmap';
HeatMap.Inject(Legend, Tooltip);
</script><script>
import { HeatMapComponent, Tooltip, Legend } from "@syncfusion/ej2-vue-heatmap";
//Component registration
export default {
name: "App",
components: {
'ejs-heatmap': HeatMapComponent
}
}
</script>- In the
templatesection, define the HeatMap component with the dataSource, xAxis, yAxis, and other property bindings.
<template>
    <ejs-heatmap id="heatmap" :dataSource='dataSource' :xAxis='xAxis' :yAxis='yAxis' :titleSettings='titleSettings' :legendSettings='legendSettings' :cellSettings='cellSettings' :showTooltip='showTooltip'></ejs-heatmap>
</template>- In the
scriptsection, declare the values for the HeatMap properties defined in thetemplatesection.
<script setup>
    const xAxis = {
          labels: ['Nancy', 'Andrew','Janet', 'Margaret', 'Steven', 'Michael', 'Robert', 'Laura', 'Anne', 'Paul', 'Karin', 'Mario'],
    };
    const yAxis = {
        labels: ['Mon', 'Tues', 'Wed', 'Thurs', 'Fri', 'Sat'],
    };
    const cellSettings = {
        showLabel: true,
    };
    const titleSettings = {
        text: 'Sales Revenue per Employee (in 1000 US$)',
        textStyle: {
            size: '15px',
            fontWeight: '500',
            fontStyle: 'Normal',
            fontFamily: 'Segoe UI'
        }
    };
    const dataSource = [
        [73, 39, 26, 39, 94, 0],
        [93, 58, 53, 38, 26, 68],
        [99, 28, 22, 4, 66, 90],
        [14, 26, 97, 69, 69, 3],
        [7, 46, 47, 47, 88, 6],
        [41, 55, 73, 23, 3, 79],
        [56, 69, 21, 86, 3, 33],
        [45, 7, 53, 81, 95, 79],
        [60, 77, 74, 68, 88, 51],
        [25, 25, 10, 12, 78, 14],
        [25, 56, 55, 58, 12, 82],
        [74, 33, 88, 23, 86, 59]
    ];
    const legendSettings = {
      visible:true,
      position: 'Right',
      showLabel: true,
      height: "150"
    };
    const showTooltip = true;
</script><script>
data() {
return {
xAxis: {
labels: ['Nancy', 'Andrew','Janet', 'Margaret', 'Steven', 'Michael', 'Robert', 'Laura', 'Anne', 'Paul', 'Karin', 'Mario'],
},
yAxis:{
labels: ['Mon', 'Tues', 'Wed', 'Thurs', 'Fri', 'Sat'],
},
cellSettings: {
showLabel: true,
},
titleSettings: {
text: 'Sales Revenue per Employee (in 1000 US$)',
textStyle: {
size: '15px',
fontWeight: '500',
fontStyle: 'Normal',
fontFamily: 'Segoe UI'
}
},
dataSource: [
[73, 39, 26, 39, 94, 0],
[93, 58, 53, 38, 26, 68],
[99, 28, 22, 4, 66, 90],
[14, 26, 97, 69, 69, 3],
[7, 46, 47, 47, 88, 6],
[41, 55, 73, 23, 3, 79],
[56, 69, 21, 86, 3, 33],
[45, 7, 53, 81, 95, 79],
[60, 77, 74, 68, 88, 51],
[25, 25, 10, 12, 78, 14],
[25, 56, 55, 58, 12, 82],
[74, 33, 88, 23, 86, 59]
],
legendSettings: {
visible:true,
position: 'Right',
showLabel: true,
height: "150"
},
showTooltip:true
};
}
</script>Here is the summarized code for the above steps in the src/App.vue file:
<template>
    <ejs-heatmap id="heatmap" :dataSource='dataSource' :xAxis='xAxis' :yAxis='yAxis' :titleSettings='titleSettings' :legendSettings='legendSettings' :cellSettings='cellSettings' :showTooltip='showTooltip'></ejs-heatmap>
</template>

<script setup>
import { HeatMapComponent  as EjsHeatmap, Tooltip, Legend }  from "@syncfusion/ej2-vue-heatmap";
import { HeatMap } from '@syncfusion/ej2-heatmap';
HeatMap.Inject(Legend, Tooltip);
    const xAxis = {
          labels: ['Nancy', 'Andrew','Janet', 'Margaret', 'Steven', 'Michael', 'Robert', 'Laura', 'Anne', 'Paul', 'Karin', 'Mario'],
    };
    const yAxis = {
        labels: ['Mon', 'Tues', 'Wed', 'Thurs', 'Fri', 'Sat'],
    };
    const cellSettings = {
        showLabel: true,
    };
    const titleSettings = {
        text: 'Sales Revenue per Employee (in 1000 US$)',
        textStyle: {
            size: '15px',
            fontWeight: '500',
            fontStyle: 'Normal',
            fontFamily: 'Segoe UI'
        }
    };
    const dataSource = [
        [73, 39, 26, 39, 94, 0],
        [93, 58, 53, 38, 26, 68],
        [99, 28, 22, 4, 66, 90],
        [14, 26, 97, 69, 69, 3],
        [7, 46, 47, 47, 88, 6],
        [41, 55, 73, 23, 3, 79],
        [56, 69, 21, 86, 3, 33],
        [45, 7, 53, 81, 95, 79],
        [60, 77, 74, 68, 88, 51],
        [25, 25, 10, 12, 78, 14],
        [25, 56, 55, 58, 12, 82],
        [74, 33, 88, 23, 86, 59]
    ];
    const legendSettings = {
      visible:true,
      position: 'Right',
      showLabel: true,
      height: "150"
    };
    const showTooltip = true;
</script><template>
<ejs-heatmap id="heatmap" :dataSource='dataSource' :xAxis='xAxis' :yAxis='yAxis' :titleSettings='titleSettings' :legendSettings='legendSettings' :cellSettings='cellSettings' :showTooltip='showTooltip'></ejs-heatmap>
</template>
<script>
import { HeatMapComponent, Tooltip, Legend } from "@syncfusion/ej2-vue-heatmap";
// Component registration
export default {
name: "App",
// Declaring component and its directives
components: {
'ejs-heatmap': HeatMapComponent
},
// Bound properties declarations
data() {
return {
xAxis: {
labels: ['Nancy', 'Andrew','Janet', 'Margaret', 'Steven', 'Michael', 'Robert', 'Laura', 'Anne', 'Paul', 'Karin', 'Mario'],
},
yAxis:{
labels: ['Mon', 'Tues', 'Wed', 'Thurs', 'Fri', 'Sat'],
},
cellSettings: {
showLabel: true,
},
titleSettings: {
text: 'Sales Revenue per Employee (in 1000 US$)',
textStyle: {
size: '15px',
fontWeight: '500',
fontStyle: 'Normal',
fontFamily: 'Segoe UI'
}
},
dataSource: [
[73, 39, 26, 39, 94, 0],
[93, 58, 53, 38, 26, 68],
[99, 28, 22, 4, 66, 90],
[14, 26, 97, 69, 69, 3],
[7, 46, 47, 47, 88, 6],
[41, 55, 73, 23, 3, 79],
[56, 69, 21, 86, 3, 33],
[45, 7, 53, 81, 95, 79],
[60, 77, 74, 68, 88, 51],
[25, 25, 10, 12, 78, 14],
[25, 56, 55, 58, 12, 82],
[74, 33, 88, 23, 86, 59]
],
legendSettings: {
visible:true,
position: 'Right',
showLabel: true,
height: "150"
},
showTooltip:true
};
},
provide: {
heatmap:[Tooltip, Legend]
}
};
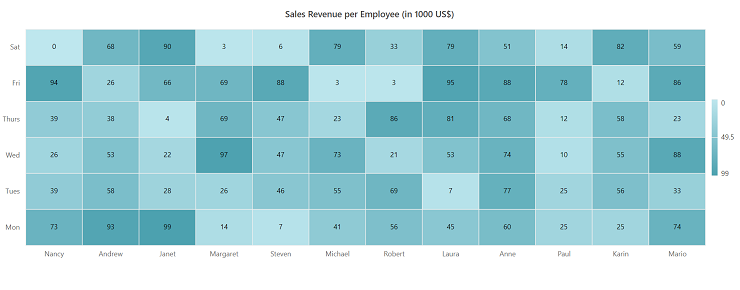
</script>Run the application
To run the project, use the following command:
npm run devor
yarn run devThe Vite server will start on a local port (typically http://localhost:5173). Open this URL in your browser to view the HeatMap component in action. The output will display as follows: