Getting Started with the Vue HeatMap Component in Vue 2
10 Feb 202624 minutes to read
This article provides a step-by-step guide for setting up a Vue 2 project using Vue-CLI and integrating the Syncfusion® Vue HeatMap component into your application.
Prerequisites
System requirements for Syncfusion® Vue UI components
Dependencies
The HeatMap component requires the following packages:
|-- @syncfusion/ej2-vue-heatmap
    |-- @syncfusion/ej2-base
    |-- @syncfusion/ej2-data
    |-- @syncfusion/ej2-heatmap
    |-- @syncfusion/ej2-vue-base
    |-- @syncfusion/ej2-svg-base
Setting up the Vue 2 project
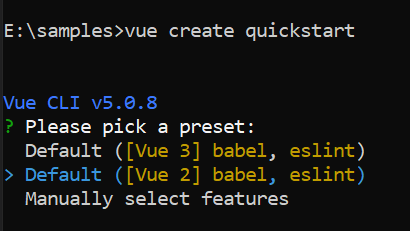
To create a new Vue 2 project using Vue-CLI, use the vue create command. Follow these steps to install Vue CLI and initialize your project:
npm install -g @vue/cli
vue create quickstart
cd quickstart
npm run serve
or
yarn global add @vue/cli
vue create quickstart
cd quickstart
yarn run serve
When prompted, select the Default ([Vue 2] babel, eslint) option from the menu.
After the quickstart project is created with default settings, proceed to add Syncfusion® components to the project.
Add Syncfusion® Vue packages
Syncfusion® packages are available at npmjs.com. To use the Vue HeatMap component, install the required npm package.
This article uses the Vue HeatMap component as an example. Install the @syncfusion/ej2-vue-heatmap package by running the following command:
npm install @syncfusion/ej2-vue-heatmap --saveor
yarn add @syncfusion/ej2-vue-heatmapAdding Syncfusion® Vue HeatMap component
To add the Vue HeatMap component to your project, follow these steps:
1. Import and register the HeatMap component in the script section of the src/App.vue file.
<script>
import { HeatMapComponent } from '@syncfusion/ej2-vue-heatmap';

export default {
  components: {
    'ejs-heatmap' : HeatMapComponent
  },
  data: function() {
    return {
      dataSource: [
        [73, 39, 26, 39, 94, 0],
        [93, 58, 53, 38, 26, 68],
        [99, 28, 22, 4, 66, 90],
        [14, 26, 97, 69, 69, 3],
        [7, 46, 47, 47, 88, 6],
        [41, 55, 73, 23, 3, 79],
        [56, 69, 21, 86, 3, 33],
        [45, 7, 53, 81, 95, 79],
        [60, 77, 74, 68, 88, 51],
        [25, 25, 10, 12, 78, 14],
        [25, 56, 55, 58, 12, 82],
        [74, 33, 88, 23, 86, 59]
      ]
    }
  }
}
</script>
2. In the template section, define the HeatMap component element.
<template>
    <div id="app">
      <ejs-heatmap id="heatmap" :dataSource='dataSource'></ejs-heatmap>
    </div>
</template>
Here is the complete code for the src/App.vue file after implementing the above steps:
<template>
  <ejs-heatmap id="heatmap" :dataSource='dataSource'></ejs-heatmap>
</template>
<script>
import { HeatMapComponent } from "@syncfusion/ej2-vue-heatmap";

export default {
  name: "App",
  components: {
    'ejs-heatmap': HeatMapComponent
  },
  data: function () {
    return {
      dataSource: [
        [73, 39, 26, 39, 94, 0],
        [93, 58, 53, 38, 26, 68],
        [99, 28, 22, 4, 66, 90],
        [14, 26, 97, 69, 69, 3],
        [7, 46, 47, 47, 88, 6],
        [41, 55, 73, 23, 3, 79],
        [56, 69, 21, 86, 3, 33],
        [45, 7, 53, 81, 95, 79],
        [60, 77, 74, 68, 88, 51],
        [25, 25, 10, 12, 78, 14],
        [25, 56, 55, 58, 12, 82],
        [74, 33, 88, 23, 86, 59]
      ]
    }
  }
}
</script>
Run the project
To run the project, use the following command:
npm run serveor
yarn run serveModule injection
The heat map components are segregated into individual feature-wise modules. To use its feature, you need to inject its feature service in the AppModule. In the current application,the basic heat map is modified to visualize sales revenue data for week, and the tooltip and legend features of the heat map are used. Find the relevant feature modules and descriptions as follows.
- Legend - Provides the legend feature by injecting it.
- Tooltip - Provides the tooltip feature by injecting it.
Now, import the above-mentioned modules from the heat map package and inject them into provide.
<script>
import Vue from "vue";
import { HeatMapComponent, Legend, Tooltip } from "@syncfusion/ej2-vue-heatmap";

export default {
  components: {
    'ejs-heatmap': HeatMapComponent
  },
  provide: {
    heatmap: [Legend, Tooltip]
  }
};
</script>
Available feature modules:
- Legend - Enables the legend display to indicate the color gradient and value ranges.
- Tooltip - Enables interactive tooltips that display information when hovering over HeatMap cells.
Populate the HeatMap with data
Add data to the HeatMap by binding a two-dimensional array to the dataSource property:
<template>
  <div id="app">
    <ejs-heatmap id="heatmap" :dataSource='dataSource'></ejs-heatmap>
  </div>
</template>
<script>
import { HeatMapComponent } from '@syncfusion/ej2-vue-heatmap';

export default {
  name: "App",
  components: {
    'ejs-heatmap': HeatMapComponent
  },
  data: function () {
    return {
      dataSource: [
        [73, 39, 26, 39, 94, 0],
        [93, 58, 53, 38, 26, 68],
        [99, 28, 22, 4, 66, 90],
        [14, 26, 97, 69, 69, 3],
        [7, 46, 47, 47, 88, 6],
        [41, 55, 73, 23, 3, 79],
        [56, 69, 21, 86, 3, 33],
        [45, 7, 53, 81, 95, 79],
        [60, 77, 74, 68, 88, 51],
        [25, 25, 10, 12, 78, 14],
        [25, 56, 55, 58, 12, 82],
        [74, 33, 88, 23, 86, 59]
      ]
    }
  }
}
</script>Enable axis labels
Display axis labels on the HeatMap using the xAxis and yAxis properties. Axis labels provide context for the data values displayed in each cell.
<template>
  <div class="control_wrapper">
    <ejs-heatmap id="heatmap" :dataSource='dataSource' :xAxis='xAxis' :yAxis='yAxis'></ejs-heatmap>
  </div>
</template>
<script>
import { HeatMapComponent, Tooltip, Legend } from '@syncfusion/ej2-vue-heatmap';

export default {
  name: "App",
  components: {
    'ejs-heatmap': HeatMapComponent
  },
  data: function () {
    return {
      xAxis: {
        labels: ['Nancy', 'Andrew', 'Janet', 'Margaret', 'Steven',
          'Michael', 'Robert', 'Laura', 'Anne', 'Paul', 'Karin', 'Mario'],
      },
      yAxis: {
        labels: ['Mon', 'Tues', 'Wed', 'Thurs', 'Fri', 'Sat'],
      },
      dataSource: [
        [73, 39, 26, 39, 94, 0],
        [93, 58, 53, 38, 26, 68],
        [99, 28, 22, 4, 66, 90],
        [14, 26, 97, 69, 69, 3],
        [7, 46, 47, 47, 88, 6],
        [41, 55, 73, 23, 3, 79],
        [56, 69, 21, 86, 3, 33],
        [45, 7, 53, 81, 95, 79],
        [60, 77, 74, 68, 88, 51],
        [25, 25, 10, 12, 78, 14],
        [25, 56, 55, 58, 12, 82],
        [74, 33, 88, 23, 86, 59]
      ]
    }
  },
  provide: {
    heatmap: [Tooltip, Legend]
  },
}
</script>Add a HeatMap title
Include a title on the HeatMap using the titleSettings property. A title provides context and improves the clarity of the visualization.
<template>
    <div class="control_wrapper">
        <ejs-heatmap id="heatmap" :dataSource='dataSource' :xAxis='xAxis' :yAxis='yAxis'
            :titleSettings='titleSettings'></ejs-heatmap>
    </div>
</template>
<script>
import { HeatMapComponent, Tooltip, Legend } from '@syncfusion/ej2-vue-heatmap';

export default {
    name: "App",
    components: {
        'ejs-heatmap': HeatMapComponent
    },
    data: function () {
        return {
            xAxis: {
                labels: ['Nancy', 'Andrew', 'Janet', 'Margaret', 'Steven',
                    'Michael', 'Robert', 'Laura', 'Anne', 'Paul', 'Karin', 'Mario'],
            },
            yAxis: {
                labels: ['Mon', 'Tues', 'Wed', 'Thurs', 'Fri', 'Sat'],
            },
            titleSettings: {
                text: 'Sales Revenue per Employee (in 1000 US$)',
                textStyle: {
                    size: '15px',
                    fontWeight: '500',
                    fontStyle: 'Normal',
                    fontFamily: 'Segoe UI'
                }
            },
            dataSource: [
                [73, 39, 26, 39, 94, 0],
                [93, 58, 53, 38, 26, 68],
                [99, 28, 22, 4, 66, 90],
                [14, 26, 97, 69, 69, 3],
                [7, 46, 47, 47, 88, 6],
                [41, 55, 73, 23, 3, 79],
                [56, 69, 21, 86, 3, 33],
                [45, 7, 53, 81, 95, 79],
                [60, 77, 74, 68, 88, 51],
                [25, 25, 10, 12, 78, 14],
                [25, 56, 55, 58, 12, 82],
                [74, 33, 88, 23, 86, 59]
            ]
        }
    },
    provide: {
        heatmap: [Tooltip, Legend]
    },
}
</script>Enable the legend
Display a legend on the HeatMap by enabling the legendSettings property. Set the visible property to true and ensure the Legend module is injected into the provide option.
<template>
    <div class="control_wrapper">
        <ejs-heatmap id="heatmap" :dataSource='dataSource' :xAxis='xAxis' :yAxis='yAxis' :titleSettings='titleSettings'
            :legendSettings='legendSettings'></ejs-heatmap>
    </div>
</template>
<script>
import { HeatMapComponent, Tooltip, Legend } from '@syncfusion/ej2-vue-heatmap';

export default {
    name: "App",
    components: {
        'ejs-heatmap': HeatMapComponent
    },
    data: function () {
        return {
            xAxis: {
                labels: ['Nancy', 'Andrew', 'Janet', 'Margaret', 'Steven',
                    'Michael', 'Robert', 'Laura', 'Anne', 'Paul', 'Karin', 'Mario'],
            },
            yAxis: {
                labels: ['Mon', 'Tues', 'Wed', 'Thurs', 'Fri', 'Sat'],
            },
            titleSettings: {
                text: 'Sales Revenue per Employee (in 1000 US$)',
                textStyle: {
                    size: '15px',
                    fontWeight: '500',
                    fontStyle: 'Normal',
                    fontFamily: 'Segoe UI'
                }
            },
            dataSource: [
                [73, 39, 26, 39, 94, 0],
                [93, 58, 53, 38, 26, 68],
                [99, 28, 22, 4, 66, 90],
                [14, 26, 97, 69, 69, 3],
                [7, 46, 47, 47, 88, 6],
                [41, 55, 73, 23, 3, 79],
                [56, 69, 21, 86, 3, 33],
                [45, 7, 53, 81, 95, 79],
                [60, 77, 74, 68, 88, 51],
                [25, 25, 10, 12, 78, 14],
                [25, 56, 55, 58, 12, 82],
                [74, 33, 88, 23, 86, 59]
            ],
            legendSettings: {
                visible: true,
                position: 'Right',
                showLabel: true,
                height: "150"
            }
        }
    },
    provide: {
        heatmap: [Tooltip, Legend]
    },
}
</script>Add data labels
Enhance HeatMap readability by displaying data labels in each cell. Set the showLabel property to true in the cellSettings object.
<template>
    <div class="control_wrapper">
       <ejs-heatmap id="heatmap" :dataSource='dataSource' :xAxis='xAxis' :yAxis='yAxis' :titleSettings='titleSettings' :legendSettings='legendSettings' :cellSettings='cellSettings'>
       </ejs-heatmap>
    </div>
</template>
<script>
import { HeatMapComponent, Tooltip, Legend } from '@syncfusion/ej2-vue-heatmap';

export default {
name: "App",
  components: {
    'ejs-heatmap': HeatMapComponent
  },
  data: function() {
    return {
        xAxis: {
            labels: ['Nancy', 'Andrew','Janet', 'Margaret', 'Steven',
                        'Michael', 'Robert', 'Laura', 'Anne', 'Paul', 'Karin', 'Mario'],
         },
        yAxis:{
            labels: ['Mon', 'Tues', 'Wed', 'Thurs', 'Fri', 'Sat'],
        },
        cellSettings: {
            showLabel: true,
        },
        titleSettings: {
            text: 'Sales Revenue per Employee (in 1000 US$)',
            textStyle: {
                size: '15px',
                fontWeight: '500',
                fontStyle: 'Normal',
                fontFamily: 'Segoe UI'
            }
        },
        dataSource: [
            [73, 39, 26, 39, 94, 0],
            [93, 58, 53, 38, 26, 68],
            [99, 28, 22, 4, 66, 90],
            [14, 26, 97, 69, 69, 3],
            [7, 46, 47, 47, 88, 6],
            [41, 55, 73, 23, 3, 79],
            [56, 69, 21, 86, 3, 33],
            [45, 7, 53, 81, 95, 79],
            [60, 77, 74, 68, 88, 51],
            [25, 25, 10, 12, 78, 14],
            [25, 56, 55, 58, 12, 82],
            [74, 33, 88, 23, 86, 59]
        ],
        legendSettings: {
            visible:true,
            position: 'Right',
            showLabel: true,
            height: "150"
        }
    }
  },
  provide:{
    heatmap:[Tooltip, Legend]
},
}
</script>Apply a custom cell palette
Customize the color scheme of HeatMap cells using the paletteSettings property. The palette property allows you to define custom colors, while the type property controls whether colors are applied as fixed or gradient modes.
<template>
    <ejs-heatmap id="heatmap" :dataSource='dataSource' :xAxis='xAxis' :yAxis='yAxis' :titleSettings='titleSettings'
        :legendSettings='legendSettings' :cellSettings='cellSettings' :paletteSettings='paletteSettings'></ejs-heatmap>
</template>
<script>
import { HeatMapComponent, Tooltip, Legend } from '@syncfusion/ej2-vue-heatmap';

export default {
    name: "App",
    components: {
        'ejs-heatmap': HeatMapComponent
    },
    data: function () {
        return {
            xAxis: {
                labels: ['Nancy', 'Andrew', 'Janet', 'Margaret', 'Steven',
                    'Michael', 'Robert', 'Laura', 'Anne', 'Paul', 'Karin', 'Mario'],
            },
            yAxis: {
                labels: ['Mon', 'Tues', 'Wed', 'Thurs', 'Fri', 'Sat'],
            },
            cellSettings: {
                showLabel: true,
            },
            titleSettings: {
                text: 'Sales Revenue per Employee (in 1000 US$)',
                textStyle: {
                    size: '15px',
                    fontWeight: '500',
                    fontStyle: 'Normal',
                    fontFamily: 'Segoe UI'
                }
            },
            dataSource: [
                [73, 39, 26, 39, 94, 0],
                [93, 58, 53, 38, 26, 68],
                [99, 28, 22, 4, 66, 90],
                [14, 26, 97, 69, 69, 3],
                [7, 46, 47, 47, 88, 6],
                [41, 55, 73, 23, 3, 79],
                [56, 69, 21, 86, 3, 33],
                [45, 7, 53, 81, 95, 79],
                [60, 77, 74, 68, 88, 51],
                [25, 25, 10, 12, 78, 14],
                [25, 56, 55, 58, 12, 82],
                [74, 33, 88, 23, 86, 59]
            ],
            legendSettings: {
                visible: true,
                position: 'Right',
                showLabel: true,
                height: "150"
            },
            paletteSettings: {
                palette: [
                    { value: 0, color: '#C06C84' },
                    { value: 50, color: '#6C5B7B' },
                    { value: 100, color: '#355C7D' }
                ],
                type: "Gradient"
            }
        }
    },
    provide: {
        heatmap: [Tooltip, Legend]
    },
}
</script>Enable tooltips
Tooltips provide additional information when space constraints prevent displaying data labels. Enable tooltips by setting the showTooltip property to true and injecting the Tooltip module into the provide option.
<template>
    <ejs-heatmap id="heatmap" :dataSource='dataSource' :xAxis='xAxis' :yAxis='yAxis' :titleSettings='titleSettings'
        :legendSettings='legendSettings' :cellSettings='cellSettings' :showTooltip='showTooltip'></ejs-heatmap>
</template>
<script>
import { HeatMapComponent, Tooltip, Legend } from '@syncfusion/ej2-vue-heatmap';

export default {
    name: "App",
    components: {
        'ejs-heatmap': HeatMapComponent
    },
    data: function () {
        return {
            xAxis: {
                labels: ['Nancy', 'Andrew', 'Janet', 'Margaret', 'Steven',
                    'Michael', 'Robert', 'Laura', 'Anne', 'Paul', 'Karin', 'Mario'],
            },
            yAxis: {
                labels: ['Mon', 'Tues', 'Wed', 'Thurs', 'Fri', 'Sat'],
            },
            cellSettings: {
                showLabel: true,
            },
            titleSettings: {
                text: 'Sales Revenue per Employee (in 1000 US$)',
                textStyle: {
                    size: '15px',
                    fontWeight: '500',
                    fontStyle: 'Normal',
                    fontFamily: 'Segoe UI'
                }
            },
            dataSource: [
                [73, 39, 26, 39, 94, 0],
                [93, 58, 53, 38, 26, 68],
                [99, 28, 22, 4, 66, 90],
                [14, 26, 97, 69, 69, 3],
                [7, 46, 47, 47, 88, 6],
                [41, 55, 73, 23, 3, 79],
                [56, 69, 21, 86, 3, 33],
                [45, 7, 53, 81, 95, 79],
                [60, 77, 74, 68, 88, 51],
                [25, 25, 10, 12, 78, 14],
                [25, 56, 55, 58, 12, 82],
                [74, 33, 88, 23, 86, 59]
            ],
            legendSettings: {
                visible: true,
                position: 'Right',
                showLabel: true,
                height: "150"
            },
            showTooltip: true
        }
    },
    provide: {
        heatmap: [Tooltip, Legend]
    },
}
</script>