Getting Started with Angular Diagram Component
17 Jul 20268 minutes to read
This section explains the steps required to create a simple diagram and demonstrates the basic usage of the diagram component.
Ready to streamline your Syncfusion® Angular development? Discover the full potential of Syncfusion® Angular components with Syncfusion® AI Coding Assistant. Effortlessly integrate, configure, and enhance your projects with intelligent, context-aware code suggestions, streamlined setups, and real-time insights—all seamlessly integrated into your preferred AI-powered IDEs like VS Code, Cursor, Syncfusion® CodeStudio and more. Explore Syncfusion® AI Coding Assistant
Prerequisites
Before getting started, ensure that your development environment meets the system requirements for Syncfusion® Angular UI components.
Before You Begin
This guide uses the standalone application structure generated by the latest Angular CLI.
The main files used in this guide are:
-
src/app/app.ts— Defines the root standalone component. -
src/styles.css— Contains global styles and Syncfusion® theme references. -
src/index.html— Contains the Angular root element (e.g.,<app-root>).
NOTE
In newer Angular CLI standalone projects, the root component may be generated as src/app/app.ts. In NgModule-based Angular projects, the equivalent file is typically src/app/app.component.ts.
NOTE
If your application uses an older NgModule-based structure, import
DiagramModulein the application module, such asapp.module.ts, instead of adding it to the standalone componentimportscollection.
Step 1: Set up the Angular environment
Use Angular CLI to create and manage Angular applications. Install Angular CLI globally using the following command:
npm install -g @angular/cliStep 2: Create an Angular application
Create a new Angular application using the following command.
ng new my-diagram-appDuring project creation, Angular CLI may prompt you to choose stylesheet, SSR/SSG, and AI tool configuration options. For this basic Diagram sample, you can use the following options:
-
Stylesheet system: Choose any option. This guide uses
CSSfor simplicity and applies the Syncfusion® Tailwind 3 theme through CSS imports. -
SSR and SSG/Pre-rendering: Select
No. -
AI tools configuration: Select
None.
Navigate to the project folder:
cd my-diagram-appStep 3: Install the Syncfusion® Angular Diagram package
All Syncfusion Essential® JS 2 packages are available in the npmjs.com registry.
Install the Angular Diagram package using the following command:
npm install @syncfusion/ej2-angular-diagramsNOTE
Installing
@syncfusion/ej2-angular-diagramsautomatically installs the required dependency packages.
Step 4: Add the required styles
The Diagram component needs Syncfusion® theme styles to display correctly. Add the styles using one of the following options.
NOTE
Styles can be added using one of two mutually exclusive approaches — choose either Option 1 or Option 2, not both:
-
Option 1 — Install a theme package (e.g.,
@syncfusion/ej2-tailwind3-theme) and import a single consolidated CSS file. -
Option 2 — Import individual component package style files directly from under
node_modules/@syncfusion.
Option 1: Add styles from a theme package
Syncfusion® theme packages include ready-to-use styles for supported components. Install the Tailwind 3 theme package using the following command:
npm install @syncfusion/ej2-tailwind3-theme --saveThen add the following CSS reference to the src/styles.css file:
@import "../node_modules/@syncfusion/ej2-tailwind3-theme/styles/diagram/index.css";For the list of available themes, refer to the Themes documentation.
Option 2: Add styles from component packages
After installing the Diagram package, the required style files are available under the node_modules/@syncfusion directory. Add the required Syncfusion® styles to the src/styles.css file.
@import '../node_modules/@syncfusion/ej2-base/styles/tailwind3.css';
@import '../node_modules/@syncfusion/ej2-popups/styles/tailwind3.css';
@import '../node_modules/@syncfusion/ej2-navigations/styles/tailwind3.css';
@import '../node_modules/@syncfusion/ej2-angular-diagrams/styles/tailwind3.css';
NOTE
Syncfusion® provides multiple built-in themes. If the application uses a different theme, replace the tailwind3.css references with the corresponding theme file, such as material3.css.
Step 5: Register the Diagram module and add the component
Import DiagramModule from @syncfusion/ej2-angular-diagrams and add it to the imports collection of the standalone component. Then, add the Angular Diagram component using the <ejs-diagram> selector in the component template.
Update the src/app/app.ts file as follows:
import { Component } from '@angular/core';
import { DiagramModule } from '@syncfusion/ej2-angular-diagrams';

@Component({
  selector: 'app-root',
  standalone: true,
  imports: [DiagramModule],
  template: `<ejs-diagram id="diagram" width="100%" height="580px"></ejs-diagram>`
})
export class App {}
This renders an empty diagram in the application.
NOTE
The component selector must match the root element used in the src/index.html file. Angular CLI commonly uses
<app-root></app-root>, so this example usesselector: 'app-root'.
NOTE
The Diagram component must have a valid height. If the height is not set, the Diagram canvas may not be visible.
Step 6: Create your first Diagram with nodes and connectors
This section explains how to create a simple flowchart by adding nodes, customizing their appearance, and connecting them using connectors.
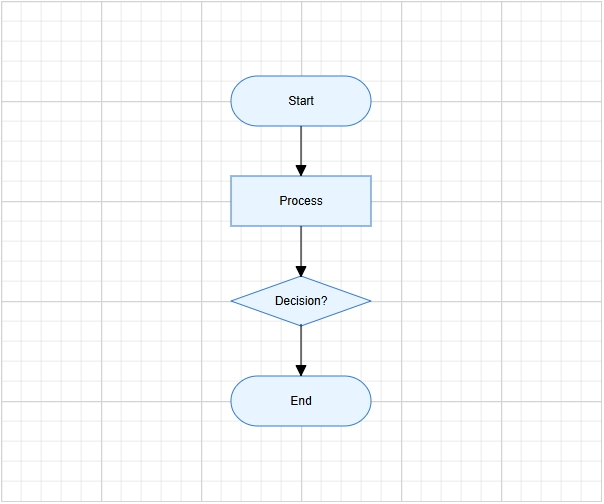
The following example creates a flowchart with four nodes: Start, Process, Decision, and End. It also applies common node and connector settings through the getNodeDefaults and getConnectorDefaults callback bindings.
Replace the entire contents of src/app/app.ts with the following code:
import { Component } from '@angular/core';
import {
  ConnectorModel,
  DiagramModule,
  FlowShapeModel,
  NodeModel
} from '@syncfusion/ej2-angular-diagrams';

@Component({
  selector: 'app-root',
  standalone: true,
  imports: [DiagramModule],
  template: `
    <ejs-diagram
      id="diagram"
      width="100%"
      height="580px"
      [getNodeDefaults]="nodeDefaults"
      [getConnectorDefaults]="connectorDefaults">

      <e-nodes>
        <e-node id="node1" [offsetX]="300" [offsetY]="100" [shape]="terminator">
          <e-node-annotations>
            <e-node-annotation content="Start"></e-node-annotation>
          </e-node-annotations>
        </e-node>

        <e-node id="node2" [offsetX]="300" [offsetY]="200" [shape]="process">
          <e-node-annotations>
            <e-node-annotation content="Process"></e-node-annotation>
          </e-node-annotations>
        </e-node>

        <e-node id="node3" [offsetX]="300" [offsetY]="300" [shape]="decision">
          <e-node-annotations>
            <e-node-annotation content="Decision?"></e-node-annotation>
          </e-node-annotations>
        </e-node>

        <e-node id="node4" [offsetX]="300" [offsetY]="400" [shape]="terminator">
          <e-node-annotations>
            <e-node-annotation content="End"></e-node-annotation>
          </e-node-annotations>
        </e-node>
      </e-nodes>

      <e-connectors>
        <e-connector id="connector1" sourceID="node1" targetID="node2"></e-connector>
        <e-connector id="connector2" sourceID="node2" targetID="node3"></e-connector>
        <e-connector id="connector3" sourceID="node3" targetID="node4"></e-connector>
      </e-connectors>
    </ejs-diagram>
  `
})
export class App {
  public terminator: FlowShapeModel = {
    type: 'Flow',
    shape: 'Terminator'
  };

  public process: FlowShapeModel = {
    type: 'Flow',
    shape: 'Process'
  };

  public decision: FlowShapeModel = {
    type: 'Flow',
    shape: 'Decision'
  };

  public nodeDefaults(node: NodeModel): NodeModel {
    node.width = 140;
    node.height = 50;
    node.style = {
      fill: '#E8F4FF',
      strokeColor: '#357BD2'
    };
    return node;
  }

  public connectorDefaults(connector: ConnectorModel): ConnectorModel {
    connector.type = 'Orthogonal';
    connector.targetDecorator = {
      shape: 'Arrow',
      width: 10,
      height: 10
    };
    return connector;
  }
}
In this example:
Template directives (used inside the <ejs-diagram> template):
-
e-nodes,e-connectors, ande-node-annotationsare Angular Diagram child directives used to define nodes, connectors, and node annotations. -
e-node-annotationadds text inside each node using thecontentproperty.
Node and connector configuration:
-
offsetXandoffsetYdefine the position of each node. -
shapedefines the node shape configuration, andFlowShapeModel.shapespecifies flowchart shapes such asTerminator,Process, orDecision. -
sourceIDandtargetIDconnect one node to another.
Common defaults applied via callbacks:
-
getNodeDefaultsapplies common width, height, fill color, and stroke color to all nodes. -
getConnectorDefaultsapplies common connector settings, such as orthogonal routing and target arrows.
Step 7: Run the application
Run the application using the following command:
npm startOpen the generated local URL (http://localhost:4200) in the browser. The application displays the diagram as shown below:
NOTE
If port 4200 is already in use, start the app on a different port with
ng serve --port 4201.