Step Area Chart in Angular Charts
28 Aug 202624 minutes to read
Step Area
A step area chart fills the area under a step line, forming block-like segments.
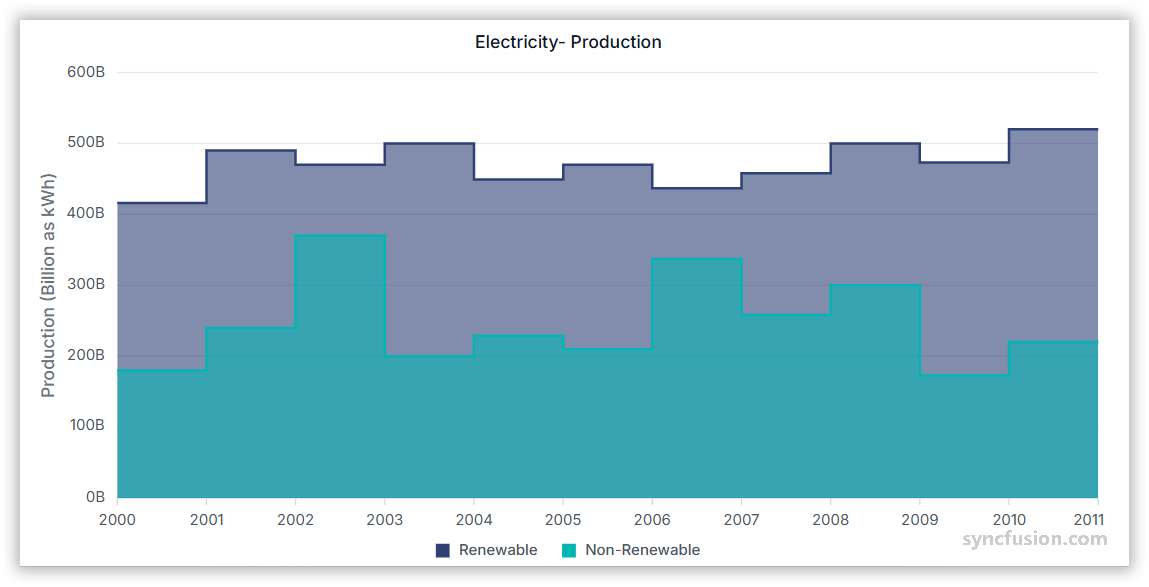
To render a step area series in your chart, you need to follow a few steps to configure it correctly.
Here’s a concise guide on how to do this:
-
Set the series type: Define the series
typeasStepAreain your chart configuration. This indicates that the data should be represented as a step area chart, which connects data points with vertical and horizontal lines, creating a step-like appearance. -
Register the StepAreaSeriesService provider: Register
StepAreaSeriesService(along with any other chart services you need) in the component’sprovidersarray.
import { ChartModule, ChartAllModule } from '@syncfusion/ej2-angular-charts'
import { StepAreaSeriesService } from '@syncfusion/ej2-angular-charts'


import { Component, OnInit } from '@angular/core';
import { chartData } from './datasource';
@Component({
imports: [
         ChartModule, ChartAllModule
    ],

providers: [StepAreaSeriesService],
standalone: true,
    selector: 'app-container',
    template: `<ejs-chart id="chart-container" [primaryXAxis]='primaryXAxis'[primaryYAxis]='primaryYAxis' [title]='title'>
        <e-series-collection>
            <e-series [dataSource]='chartData' type='StepArea' xName='x' yName='y' name='England'></e-series>
        </e-series-collection>
    </ejs-chart>`
})
export class AppComponent implements OnInit {
    public primaryXAxis?: Object;
    public chartData?: Object[];
    public title?: string;
    public primaryYAxis?: Object;
    ngOnInit(): void {
        this.chartData = chartData;
        this.primaryXAxis = {
            valueType: 'Double',
            title: 'Overs'
        };
        this.primaryYAxis = {
            title: 'Runs'
        };
        this.title = 'England - Run Rate';
    }

}
import { bootstrapApplication } from '@angular/platform-browser';
import { AppComponent } from './app.component';
bootstrapApplication(AppComponent).catch((err) => console.error(err));export let chartData: Object[] = [
{ x: 1, y: 7 }, { x: 2, y: 1 },
{ x: 3, y: 1 }, { x: 4, y: 14 },
{ x: 5, y: 1 }, { x: 6, y: 10 },
{ x: 7, y: 8 }, { x: 8, y: 6 },
{ x: 9, y: 10 }, { x: 10, y: 10 },
{ x: 11, y: 16 }, { x: 12, y: 6 },
{ x: 13, y: 14 }, { x: 14, y: 7 },
{ x: 15, y: 5 }, { x: 16, y: 2 },
{ x: 17, y: 14 }, { x: 18, y: 7 },
{ x: 19, y: 7 }, { x: 20, y: 10 }
];Binding data with series
Bind data via the dataSource property on the series. Map the fields from your records to xName and yName so the chart knows which value drives each point. The included basic sample renders a single StepArea series named England that maps x and y to the chart’s x and y axes.
import { ChartModule, ChartAllModule } from '@syncfusion/ej2-angular-charts'
import { StepAreaSeriesService } from '@syncfusion/ej2-angular-charts'


import { Component, OnInit } from '@angular/core';
import { chartData } from './datasource';
@Component({
imports: [
         ChartModule, ChartAllModule
    ],

providers: [StepAreaSeriesService],
standalone: true,
    selector: 'app-container',
    template: `<ejs-chart id="chart-container" [primaryXAxis]='primaryXAxis'[primaryYAxis]='primaryYAxis' [title]='title'>
        <e-series-collection>
            <e-series [dataSource]='chartData' type='StepArea' xName='x' yName='y' name='England'></e-series>
        </e-series-collection>
    </ejs-chart>`
})
export class AppComponent implements OnInit {
    public primaryXAxis?: Object;
    public chartData?: Object[];
    public title?: string;
    public primaryYAxis?: Object;
    ngOnInit(): void {
        this.chartData = chartData;
        this.primaryXAxis = {
            valueType: 'Double',
            title: 'Overs'
        };
        this.primaryYAxis = {
            title: 'Runs'
        };
        this.title = 'England - Run Rate';
    }

}
import { bootstrapApplication } from '@angular/platform-browser';
import { AppComponent } from './app.component';
bootstrapApplication(AppComponent).catch((err) => console.error(err));export let chartData: Object[] = [
{ x: 1, y: 7 }, { x: 2, y: 1 },
{ x: 3, y: 1 }, { x: 4, y: 14 },
{ x: 5, y: 1 }, { x: 6, y: 10 },
{ x: 7, y: 8 }, { x: 8, y: 6 },
{ x: 9, y: 10 }, { x: 10, y: 10 },
{ x: 11, y: 16 }, { x: 12, y: 6 },
{ x: 13, y: 14 }, { x: 14, y: 7 },
{ x: 15, y: 5 }, { x: 16, y: 2 },
{ x: 17, y: 14 }, { x: 18, y: 7 },
{ x: 19, y: 7 }, { x: 20, y: 10 }
];Series customization
The following properties customize the step area series.
Solid fill
The fill property determines the color applied to the series. Default value is null.
import { ChartModule, ChartAllModule } from '@syncfusion/ej2-angular-charts'
import { StepAreaSeriesService } from '@syncfusion/ej2-angular-charts'


import { Component, OnInit } from '@angular/core';
import { stepData } from './datasource';
@Component({
imports: [
         ChartModule, ChartAllModule
    ],

providers: [StepAreaSeriesService],
standalone: true,
    selector: 'app-container',
    template: `<ejs-chart id="chart-container" [primaryXAxis]='primaryXAxis'[primaryYAxis]='primaryYAxis' [title]='title'>
        <e-series-collection>
            <e-series [dataSource]='chartData' type='StepArea' xName='x' yName='y' name='England' fill='red'></e-series>
        </e-series-collection>
    </ejs-chart>`
})
export class AppComponent implements OnInit {
    public primaryXAxis?: Object;
    public chartData?: Object[];
    public title?: string;
    public primaryYAxis?: Object;
    ngOnInit(): void {
        this.chartData = stepData;
        this.primaryXAxis = {
            valueType: 'Double',
            title: 'Overs'
        };
        this.primaryYAxis = {
            title: 'Runs'
        };
        this.title = 'England - Run Rate';
    }

}
import { bootstrapApplication } from '@angular/platform-browser';
import { AppComponent } from './app.component';
bootstrapApplication(AppComponent).catch((err) => console.error(err));export let stepData: Object[] = [
{ x: 1, y: 7 }, { x: 2, y: 1 },
{ x: 3, y: 1 }, { x: 4, y: 14 },
{ x: 5, y: 1 }, { x: 6, y: 10 },
{ x: 7, y: 8 }, { x: 8, y: 6 },
{ x: 9, y: 10 }, { x: 10, y: 10 },
{ x: 11, y: 16 }, { x: 12, y: 6 },
{ x: 13, y: 14 }, { x: 14, y: 7 },
{ x: 15, y: 5 }, { x: 16, y: 2 },
{ x: 17, y: 14 }, { x: 18, y: 7 },
{ x: 19, y: 7 }, { x: 20, y: 10 }
];Gradient fill
The fill property can apply an SVG gradient to a step area series. Define the gradient within an SVG <defs> element using a unique ID, and assign it to the series in the url(#gradientId) format. Place the following SVG element in your application’s index.html file, inside the <body> element and outside the <app-container> element.
<svg>
    <defs>
        <linearGradient id="gradient">
            <stop offset="0%" style="stop-color: blue; stop-opacity: 1" />
            <stop offset="50%" style="stop-color: violet; stop-opacity: 1" />
        </linearGradient>
    </defs>
</svg>import { ChartModule, ChartAllModule } from '@syncfusion/ej2-angular-charts'
import { StepAreaSeriesService } from '@syncfusion/ej2-angular-charts'
import { Component, OnInit } from '@angular/core';
import { stepData } from './datasource';
@Component({
imports: [
ChartModule, ChartAllModule
],
providers: [StepAreaSeriesService],
standalone: true,
selector: 'app-container',
template: `<ejs-chart id="chart-container" [primaryXAxis]='primaryXAxis'[primaryYAxis]='primaryYAxis' [title]='title'>
<e-series-collection>
<e-series [dataSource]='chartData' type='StepArea' xName='x' yName='y' name='England' fill='url(#gradient)'></e-series>
</e-series-collection>
</ejs-chart>`
})
export class AppComponent implements OnInit {
public primaryXAxis?: Object;
public chartData?: Object[];
public title?: string;
public primaryYAxis?: Object;
ngOnInit(): void {
this.chartData = stepData;
this.primaryXAxis = {
valueType: 'Double',
title: 'Overs'
};
this.primaryYAxis = {
title: 'Runs'
};
this.title = 'England - Run Rate';
}
}import { bootstrapApplication } from '@angular/platform-browser';
import { AppComponent } from './app.component';
bootstrapApplication(AppComponent).catch((err) => console.error(err));export let stepData: Object[] = [
{ x: 1, y: 7 }, { x: 2, y: 1 },
{ x: 3, y: 1 }, { x: 4, y: 14 },
{ x: 5, y: 1 }, { x: 6, y: 10 },
{ x: 7, y: 8 }, { x: 8, y: 6 },
{ x: 9, y: 10 }, { x: 10, y: 10 },
{ x: 11, y: 16 }, { x: 12, y: 6 },
{ x: 13, y: 14 }, { x: 14, y: 7 },
{ x: 15, y: 5 }, { x: 16, y: 2 },
{ x: 17, y: 14 }, { x: 18, y: 7 },
{ x: 19, y: 7 }, { x: 20, y: 10 }
];Opacity
The opacity property specifies the transparency level of the fill. Valid range is 0 (completely transparent) to 1 (completely opaque). Default value is 1.
import { ChartModule, ChartAllModule } from '@syncfusion/ej2-angular-charts'
import { StepAreaSeriesService } from '@syncfusion/ej2-angular-charts'


import { Component, OnInit } from '@angular/core';
import { stepData } from './datasource';
@Component({
imports: [
         ChartModule, ChartAllModule
    ],

providers: [StepAreaSeriesService],
standalone: true,
    selector: 'app-container',
    template: `<ejs-chart id="chart-container" [primaryXAxis]='primaryXAxis'[primaryYAxis]='primaryYAxis' [title]='title'>
        <e-series-collection>
            <e-series [dataSource]='chartData' type='StepArea' xName='x' yName='y' name='England' opacity='0.5'></e-series>
        </e-series-collection>
    </ejs-chart>`
})
export class AppComponent implements OnInit {
    public primaryXAxis?: Object;
    public chartData?: Object[];
    public title?: string;
    public primaryYAxis?: Object;
    ngOnInit(): void {
        this.chartData = stepData;
        this.primaryXAxis = {
            valueType: 'Double',
            title: 'Overs'
        };
        this.primaryYAxis = {
            title: 'Runs'
        };
        this.title = 'England - Run Rate';
    }

}
import { bootstrapApplication } from '@angular/platform-browser';
import { AppComponent } from './app.component';
bootstrapApplication(AppComponent).catch((err) => console.error(err));export let stepData: Object[] = [
{ x: 1, y: 7 }, { x: 2, y: 1 },
{ x: 3, y: 1 }, { x: 4, y: 14 },
{ x: 5, y: 1 }, { x: 6, y: 10 },
{ x: 7, y: 8 }, { x: 8, y: 6 },
{ x: 9, y: 10 }, { x: 10, y: 10 },
{ x: 11, y: 16 }, { x: 12, y: 6 },
{ x: 13, y: 14 }, { x: 14, y: 7 },
{ x: 15, y: 5 }, { x: 16, y: 2 },
{ x: 17, y: 14 }, { x: 18, y: 7 },
{ x: 19, y: 7 }, { x: 20, y: 10 }
];Series Border
Use the border property to style the series border. The border object supports these fields:
-
width- Border thickness in pixels. -
color- Border stroke color. -
dashArray- Dash pattern for the border (for example'5','5,5', or'2,3,4').
Example: { width: 1.5, color: 'red', dashArray: '2,5' }.
import { ChartModule, ChartAllModule } from '@syncfusion/ej2-angular-charts'
import { StepAreaSeriesService } from '@syncfusion/ej2-angular-charts'


import { Component, OnInit } from '@angular/core';
import { stepData } from './datasource';
@Component({
imports: [
         ChartModule, ChartAllModule
    ],

providers: [StepAreaSeriesService],
standalone: true,
    selector: 'app-container',
    template: `<ejs-chart id="chart-container" [primaryXAxis]='primaryXAxis'[primaryYAxis]='primaryYAxis' [title]='title'>
        <e-series-collection>
            <e-series [dataSource]='chartData' type='StepArea' xName='x' yName='y' name='England' [border]='border'></e-series>
        </e-series-collection>
    </ejs-chart>`
})
export class AppComponent implements OnInit {
    public primaryXAxis?: Object;
    public chartData?: Object[];
    public title?: string;
    public primaryYAxis?: Object;
    public border?: Object;
    ngOnInit(): void {
        this.chartData = stepData;
        this.primaryXAxis = {
            valueType: 'Double',
            title: 'Overs'
        };
        this.primaryYAxis = {
            title: 'Runs'
        };
        this.border = { width: 1.5, color: 'red', dashArray: '2,5'};
        this.title = 'England - Run Rate';
    }

}
import { bootstrapApplication } from '@angular/platform-browser';
import { AppComponent } from './app.component';
bootstrapApplication(AppComponent).catch((err) => console.error(err));export let stepData: Object[] = [
{ x: 1, y: 7 }, { x: 2, y: 1 },
{ x: 3, y: 1 }, { x: 4, y: 14 },
{ x: 5, y: 1 }, { x: 6, y: 10 },
{ x: 7, y: 8 }, { x: 8, y: 6 },
{ x: 9, y: 10 }, { x: 10, y: 10 },
{ x: 11, y: 16 }, { x: 12, y: 6 },
{ x: 13, y: 14 }, { x: 14, y: 7 },
{ x: 15, y: 5 }, { x: 16, y: 2 },
{ x: 17, y: 14 }, { x: 18, y: 7 },
{ x: 19, y: 7 }, { x: 20, y: 10 }
];Step
Use the step property to change the position of the steps in a step area series. Available values are:
-
Left(default) - The step rises/joins on the left side of each x-interval. -
Center- The step is centered in each x-interval. -
Right- The step rises/joins on the right side of each x-interval.
import { ChartModule, ChartAllModule } from '@syncfusion/ej2-angular-charts'
import { StepAreaSeriesService } from '@syncfusion/ej2-angular-charts'


import { Component, OnInit } from '@angular/core';
import { stepData } from './datasource';
@Component({
imports: [
         ChartModule, ChartAllModule
    ],

providers: [StepAreaSeriesService],
standalone: true,
    selector: 'app-container',
    template: `<ejs-chart id="chart-container" [primaryXAxis]='primaryXAxis'[primaryYAxis]='primaryYAxis' [title]='title'>
        <e-series-collection>
            <e-series [dataSource]='chartData' type='StepArea' xName='x' yName='y' name='England' step='Right'></e-series>
        </e-series-collection>
    </ejs-chart>`
})
export class AppComponent implements OnInit {
    public primaryXAxis?: Object;
    public chartData?: Object[];
    public title?: string;
    public primaryYAxis?: Object;
    ngOnInit(): void {
        this.chartData = stepData;
        this.primaryXAxis = {
            valueType: 'Double',
            title: 'Overs'
        };
        this.primaryYAxis = {
            title: 'Runs'
        };
        this.title = 'England - Run Rate';
    }

}
import { bootstrapApplication } from '@angular/platform-browser';
import { AppComponent } from './app.component';
bootstrapApplication(AppComponent).catch((err) => console.error(err));export let stepData: Object[] = [
{ x: 1, y: 7 }, { x: 2, y: 1 },
{ x: 3, y: 1 }, { x: 4, y: 14 },
{ x: 5, y: 1 }, { x: 6, y: 10 },
{ x: 7, y: 8 }, { x: 8, y: 6 },
{ x: 9, y: 10 }, { x: 10, y: 10 },
{ x: 11, y: 16 }, { x: 12, y: 6 },
{ x: 13, y: 14 }, { x: 14, y: 7 },
{ x: 15, y: 5 }, { x: 16, y: 2 },
{ x: 17, y: 14 }, { x: 18, y: 7 },
{ x: 19, y: 7 }, { x: 20, y: 10 }
];No Risers
Eliminate the vertical lines between points by setting the noRisers property to true on the series. The included sample also drops the series opacity to 0.1 and applies a thin border to keep the band visible without the vertical connectors.
import { ChartModule, ChartAllModule } from '@syncfusion/ej2-angular-charts'
import { StepAreaSeriesService } from '@syncfusion/ej2-angular-charts'


import { Component, OnInit } from '@angular/core';
import { stepData } from './datasource';
@Component({
imports: [
         ChartModule, ChartAllModule
    ],

providers: [StepAreaSeriesService],
standalone: true,
    selector: 'app-container',
    template: `<ejs-chart id="chart-container" [primaryXAxis]='primaryXAxis'[primaryYAxis]='primaryYAxis' [title]='title'>
        <e-series-collection>
            <e-series [dataSource]='chartData' type='StepArea' xName='x' noRaiser='true' yName='y' name='England' [border]='border' opacity='0.1' noRisers='true'></e-series>
        </e-series-collection>
    </ejs-chart>`
})
export class AppComponent implements OnInit {
    public primaryXAxis?: Object;
    public chartData?: Object[];
    public title?: string;
    public primaryYAxis?: Object;
    public border?: object;
    ngOnInit(): void {
        this.chartData = stepData;
        this.primaryXAxis = {
            valueType: 'Double',
            title: 'Overs'
        };
        this.primaryYAxis = {
            title: 'Runs'
        };
        this.border = { width: 1.5 };
        this.title = 'England - Run Rate';
    }

}
import { bootstrapApplication } from '@angular/platform-browser';
import { AppComponent } from './app.component';
bootstrapApplication(AppComponent).catch((err) => console.error(err));export let stepData: Object[] = [
{ x: 1, y: 7 }, { x: 2, y: 1 },
{ x: 3, y: 1 }, { x: 4, y: 14 },
{ x: 5, y: 1 }, { x: 6, y: 10 },
{ x: 7, y: 8 }, { x: 8, y: 6 },
{ x: 9, y: 10 }, { x: 10, y: 10 },
{ x: 11, y: 16 }, { x: 12, y: 6 },
{ x: 13, y: 14 }, { x: 14, y: 7 },
{ x: 15, y: 5 }, { x: 16, y: 2 },
{ x: 17, y: 14 }, { x: 18, y: 7 },
{ x: 19, y: 7 }, { x: 20, y: 10 }
];Empty points
Data points with null or undefined values are considered empty. How an empty point is rendered on the chart depends on the mode you choose.
Mode
Use the mode property to define how empty or missing data points are handled. Available values are:
-
Gap(default) - Leaves a gap at the empty point. -
Drop- Drops the empty point and connects adjacent points. -
Zero(used in the includedMode,Fill, andBordersamples) - Replaces the empty point with the value0. -
Average- Replaces the empty point with the average of adjacent points.
import { ChartModule, ChartAllModule } from '@syncfusion/ej2-angular-charts'
import { StepAreaSeriesService } from '@syncfusion/ej2-angular-charts'


import { Component, OnInit } from '@angular/core';
import { stepData } from './datasource';
@Component({
imports: [
         ChartModule, ChartAllModule
    ],

providers: [StepAreaSeriesService],
standalone: true,
    selector: 'app-container',
    template: `<ejs-chart id="chart-container" [primaryXAxis]='primaryXAxis'[primaryYAxis]='primaryYAxis' [title]='title'>
        <e-series-collection>
            <e-series [dataSource]='chartData' type='StepArea' xName='x' yName='y' name='England' [emptyPointSettings]='emptyPointSettings'></e-series>
        </e-series-collection>
    </ejs-chart>`
})
export class AppComponent implements OnInit {
    public primaryXAxis?: Object;
    public chartData?: Object[];
    public title?: string;
    public primaryYAxis?: Object;
    public emptyPointSettings?: Object;
    ngOnInit(): void {
        this.chartData = stepData;
        this.primaryXAxis = {
            valueType: 'Double',
            title: 'Overs'
        };
        this.primaryYAxis = {
            title: 'Runs'
        };
        this.emptyPointSettings = {
            mode: 'Zero'
        }
        this.title = 'England - Run Rate';
    }

}
import { bootstrapApplication } from '@angular/platform-browser';
import { AppComponent } from './app.component';
bootstrapApplication(AppComponent).catch((err) => console.error(err));export let stepData: Object[] = [
{ x: 1, y: 7 }, { x: 2, y: 1 },
{ x: 3, y: 1 }, { x: 4, y: 14 },
{ x: 5, y: null }, { x: 6, y: 10 },
{ x: 7, y: 8 }, { x: 8, y: 6 },
{ x: 9, y: 10 }, { x: 10, y: 10 },
{ x: 11, y: 16 }, { x: 12, y: 6 },
{ x: 13, y: 14 }, { x: 14, y: undefined },
{ x: 15, y: 5 }, { x: 16, y: 2 },
{ x: 17, y: 14 }, { x: 18, y: 7 },
{ x: 19, y: 7 }, { x: 20, y: 10 }
];Empty Point Fill
Use the fill property to customize the fill color of empty points in the series. Applies only when mode is Zero or Average.
import { ChartModule, ChartAllModule } from '@syncfusion/ej2-angular-charts'
import { StepAreaSeriesService } from '@syncfusion/ej2-angular-charts'


import { Component, OnInit } from '@angular/core';
import { stepData } from './datasource';
@Component({
imports: [
         ChartModule, ChartAllModule
    ],

providers: [StepAreaSeriesService],
standalone: true,
    selector: 'app-container',
    template: `<ejs-chart id="chart-container" [primaryXAxis]='primaryXAxis' [primaryYAxis]='primaryYAxis' [title]='title'>
        <e-series-collection>
            <e-series [dataSource]='chartData' type='StepArea' xName='x' yName='y' name='England' [marker]='marker' [emptyPointSettings]='emptyPointSettings'></e-series>
        </e-series-collection>
    </ejs-chart>`
})
export class AppComponent implements OnInit {
    public primaryXAxis?: Object;
    public chartData?: Object[];
    public title?: string;
    public primaryYAxis?: Object;
    public emptyPointSettings?: Object;
    public marker?: Object;
    ngOnInit(): void {
        this.chartData = stepData;
        this.primaryXAxis = {
            valueType: 'Double',
            title: 'Overs'
        };
        this.primaryYAxis = {
            title: 'Runs'
        };
        this.emptyPointSettings = {
            mode: 'Zero', fill: 'red'
        };
        this.marker = { visible: true };
        this.title = 'England - Run Rate';
    }

}
import { bootstrapApplication } from '@angular/platform-browser';
import { AppComponent } from './app.component';
bootstrapApplication(AppComponent).catch((err) => console.error(err));export let stepData: Object[] = [
{ x: 1, y: 7 }, { x: 2, y: 1 },
{ x: 3, y: 1 }, { x: 4, y: 14 },
{ x: 5, y: null }, { x: 6, y: 10 },
{ x: 7, y: 8 }, { x: 8, y: 6 },
{ x: 9, y: 10 }, { x: 10, y: 10 },
{ x: 11, y: 16 }, { x: 12, y: 6 },
{ x: 13, y: 14 }, { x: 14, y: undefined },
{ x: 15, y: 5 }, { x: 16, y: 2 },
{ x: 17, y: 14 }, { x: 18, y: 7 },
{ x: 19, y: 7 }, { x: 20, y: 10 }
];Empty Point Border
Use the border property to customize the width and color of the border for empty points. Applies only when mode is Zero or Average.
import { ChartModule, ChartAllModule } from '@syncfusion/ej2-angular-charts'
import { StepAreaSeriesService } from '@syncfusion/ej2-angular-charts'


import { Component, OnInit } from '@angular/core';
import { stepData } from './datasource';
@Component({
imports: [
         ChartModule, ChartAllModule
    ],

providers: [StepAreaSeriesService],
standalone: true,
    selector: 'app-container',
    template: `<ejs-chart id="chart-container" [primaryXAxis]='primaryXAxis'[primaryYAxis]='primaryYAxis' [title]='title'>
        <e-series-collection>
            <e-series [dataSource]='chartData' type='StepArea' xName='x' yName='y' name='England' [marker]='marker' [emptyPointSettings]='emptyPointSettings'></e-series>
        </e-series-collection>
    </ejs-chart>`
})
export class AppComponent implements OnInit {
    public primaryXAxis?: Object;
    public chartData?: Object[];
    public title?: string;
    public primaryYAxis?: Object;
    public emptyPointSettings?: Object;
    public marker?: Object;
    ngOnInit(): void {
        this.chartData = stepData;
        this.primaryXAxis = {
            valueType: 'Double',
            title: 'Overs'
        };
        this.primaryYAxis = {
            title: 'Runs'
        };
        this.marker = { visible: true };
        this.emptyPointSettings = {
            mode: 'Zero', fill: 'red', border: {width: 2, color: 'green'}
        }
        this.title = 'England - Run Rate';
    }

}
import { bootstrapApplication } from '@angular/platform-browser';
import { AppComponent } from './app.component';
bootstrapApplication(AppComponent).catch((err) => console.error(err));export let stepData: Object[] = [
{ x: 1, y: 7 }, { x: 2, y: 1 },
{ x: 3, y: 1 }, { x: 4, y: 14 },
{ x: 5, y: null }, { x: 6, y: 10 },
{ x: 7, y: 8 }, { x: 8, y: 6 },
{ x: 9, y: 10 }, { x: 10, y: 10 },
{ x: 11, y: 16 }, { x: 12, y: 6 },
{ x: 13, y: 14 }, { x: 14, y: undefined },
{ x: 15, y: 5 }, { x: 16, y: 2 },
{ x: 17, y: 14 }, { x: 18, y: 7 },
{ x: 19, y: 7 }, { x: 20, y: 10 }
];Events
Series render
The seriesRender event allows you to customize series properties, such as data, fill, and name, before they are rendered on the chart. The handler in the included snippet assigns args.fill = '#ff6347', applying a tomato color to the series before render.
import { ChartModule, ChartAllModule } from '@syncfusion/ej2-angular-charts'
import { ISeriesRenderEventArgs } from '@syncfusion/ej2-charts'
import { StepAreaSeriesService } from '@syncfusion/ej2-angular-charts'


import { Component, OnInit } from '@angular/core';
import { stepData } from './datasource';
@Component({
imports: [
         ChartModule, ChartAllModule
    ],

providers: [StepAreaSeriesService],
standalone: true,
    selector: 'app-container',
    template: `<ejs-chart id="chart-container" (seriesRender)='seriesRender($event)' [primaryXAxis]='primaryXAxis'[primaryYAxis]='primaryYAxis' [title]='title'>
        <e-series-collection>
            <e-series [dataSource]='chartData' type='StepArea' xName='x' yName='y' name='England'></e-series>
        </e-series-collection>
    </ejs-chart>`
})
export class AppComponent implements OnInit {
    public primaryXAxis?: Object;
    public chartData?: Object[];
    public title?: string;
    public primaryYAxis?: Object;
    ngOnInit(): void {
        this.chartData = stepData;
        this.primaryXAxis = {
            valueType: 'Double',
            title: 'Overs'
        };
        this.primaryYAxis = {
            title: 'Runs'
        };
        this.title = 'England - Run Rate';
    }
    public seriesRender(args: ISeriesRenderEventArgs) {
        args.fill = '#ff6347';
    }
}
import { bootstrapApplication } from '@angular/platform-browser';
import { AppComponent } from './app.component';
bootstrapApplication(AppComponent).catch((err) => console.error(err));export let stepData: Object[] = [
{ x: 1, y: 7 }, { x: 2, y: 1 },
{ x: 3, y: 1 }, { x: 4, y: 14 },
{ x: 5, y: 1 }, { x: 6, y: 10 },
{ x: 7, y: 8 }, { x: 8, y: 6 },
{ x: 9, y: 10 }, { x: 10, y: 10 },
{ x: 11, y: 16 }, { x: 12, y: 6 },
{ x: 13, y: 14 }, { x: 14, y: 7 },
{ x: 15, y: 5 }, { x: 16, y: 2 },
{ x: 17, y: 14 }, { x: 18, y: 7 },
{ x: 19, y: 7 }, { x: 20, y: 10 }
];Point render
The pointRender event allows you to customize each data point before it is rendered on the chart. The handler in the included snippet assigns args.fill = 'red' on every point before render.
import { ChartModule, ChartAllModule } from '@syncfusion/ej2-angular-charts'
import { IPointRenderEventArgs } from '@syncfusion/ej2-charts'
import { StepAreaSeriesService } from '@syncfusion/ej2-angular-charts'


import { Component, OnInit } from '@angular/core';
import { stepData } from './datasource';
@Component({
imports: [
         ChartModule, ChartAllModule
    ],

providers: [StepAreaSeriesService],
standalone: true,
    selector: 'app-container',
    template: `<ejs-chart id="chart-container" (pointRender)='pointRender($event)' [primaryXAxis]='primaryXAxis'[primaryYAxis]='primaryYAxis' [title]='title'>
        <e-series-collection>
            <e-series [dataSource]='chartData' type='StepArea' xName='x' yName='y' [marker]='marker' name='England'></e-series>
        </e-series-collection>
    </ejs-chart>`
})
export class AppComponent implements OnInit {
    public primaryXAxis?: Object;
    public chartData?: Object[];
    public title?: string;
    public primaryYAxis?: Object;
    public marker?: Object;
    ngOnInit(): void {
        this.chartData = stepData;
        this.primaryXAxis = {
            valueType: 'Double',
            title: 'Overs'
        };
        this.primaryYAxis = {
            title: 'Runs'
        };
        this.marker = { visible: true };
        this.title = 'England - Run Rate';
    }
    public pointRender(args: IPointRenderEventArgs) {
            args.fill = 'red';
    }
}
import { bootstrapApplication } from '@angular/platform-browser';
import { AppComponent } from './app.component';
bootstrapApplication(AppComponent).catch((err) => console.error(err));export let stepData: Object[] = [
{ x: 1, y: 7 }, { x: 2, y: 1 },
{ x: 3, y: 1 }, { x: 4, y: 14 },
{ x: 5, y: 1 }, { x: 6, y: 10 },
{ x: 7, y: 8 }, { x: 8, y: 6 },
{ x: 9, y: 10 }, { x: 10, y: 10 },
{ x: 11, y: 16 }, { x: 12, y: 6 },
{ x: 13, y: 14 }, { x: 14, y: 7 },
{ x: 15, y: 5 }, { x: 16, y: 2 },
{ x: 17, y: 14 }, { x: 18, y: 7 },
{ x: 19, y: 7 }, { x: 20, y: 10 }
];Troubleshooting
- Ensure
StepAreaSeriesServiceis registered in the providers; otherwise the step area series will not render. -
Step position doesn’t change: confirm you used a value accepted by the
stepproperty —Left,Center, orRight. Any other string is treated as the default. -
No risers not working: make sure the attribute is spelled
noRisers(notnoRaiser). The included snippet accidentally contains both spellings; the correct one isnoRisers='true'. -
Empty-point customization has no visible effect: the
fillandbordersettings onemptyPointSettingsapply only whenmodeisZeroorAverage. WithGapandDropmodes no marker is drawn. -
Gradient fill renders as solid color: the SVG gradient referenced by
fill='url(#gradient)'is not defined. Add a matching<linearGradient>(or<radialGradient>) inside a<defs>block in the chart template, or in a global stylesheet.