Data labels in Angular Chart component
24 Apr 202624 minutes to read
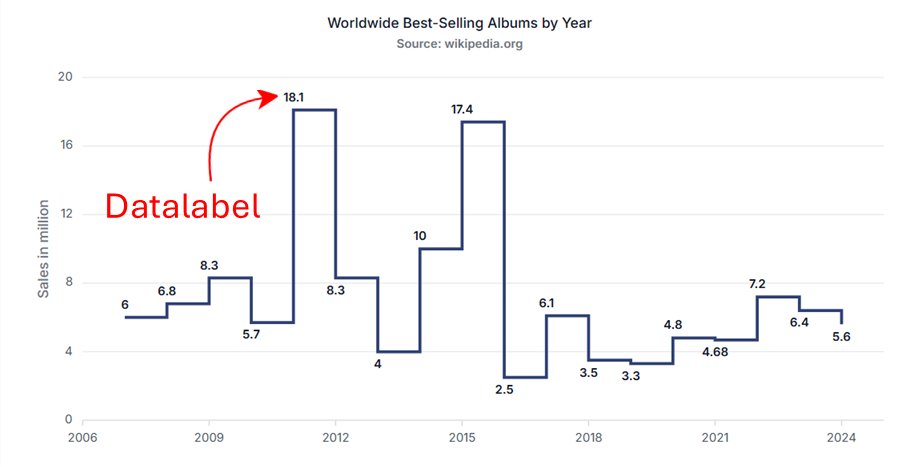
Data labels display the values of data points directly on the chart, reducing the need to reference axes for exact values. Enable data labels by setting the visible option to true in the dataLabel configuration. Labels automatically adjust to avoid overlapping and maintain readability.
Data labels can be added to a chart series by enabling the visible option in the dataLabel. By default, the labels will arrange smartly without overlapping.
import { ChartModule } from '@syncfusion/ej2-angular-charts'
import { DateTimeService, CategoryService, LineSeriesService, ColumnSeriesService } from '@syncfusion/ej2-angular-charts'
import { LegendService, DataLabelService } from '@syncfusion/ej2-angular-charts'
import { Component, OnInit } from '@angular/core';
import { columnData } from './datasource';
@Component({
imports: [
         ChartModule
    ],

providers: [ DateTimeService, LineSeriesService, LegendService, DataLabelService, ColumnSeriesService, CategoryService ],
standalone: true,
    selector: 'app-container',
    template: `<ejs-chart id="chart-container" [primaryXAxis]='primaryXAxis'[primaryYAxis]='primaryYAxis' [title]='title'>
        <e-series-collection>
            <e-series [dataSource]='chartData' type='Column' xName='x' yName='y' name='Warmest' width=2 [marker]='marker'></e-series>
        </e-series-collection>
    </ejs-chart>`
})
export class AppComponent implements OnInit {
    public primaryXAxis?: Object;
    public chartData?: Object[];
    public title?: string;
    public primaryYAxis?: Object;
    public marker?: Object;
    ngOnInit(): void {
        this.chartData = columnData;
        this.primaryXAxis = {
            valueType: 'Category'
        };
        this.marker = { dataLabel: { visible: true }
        };
        this.title = 'Alaska Weather Statistics - 2016';
    }

}
import { bootstrapApplication } from '@angular/platform-browser';
import { AppComponent } from './app.component';
import 'zone.js';
bootstrapApplication(AppComponent).catch((err) => console.error(err));Note: To use datalabel feature, inject
DataLabelServiceinto the@NgModule.providers.
Position
Use the position property to place data labels at Top, Middle, Bottom, or Outer (applicable only to column and bar series). Appropriate label positioning enhances clarity and preserves chart readability.
import { ChartModule } from '@syncfusion/ej2-angular-charts'
import { DateTimeService, CategoryService, LineSeriesService, ColumnSeriesService } from '@syncfusion/ej2-angular-charts'
import { LegendService, DataLabelService } from '@syncfusion/ej2-angular-charts'
import { Component, OnInit } from '@angular/core';
import { columnData } from './datasource';
@Component({
imports: [
         ChartModule
    ],

providers: [ DateTimeService, LineSeriesService, LegendService, DataLabelService, ColumnSeriesService, CategoryService ],
standalone: true,
    selector: 'app-container',
    template: `<ejs-chart id="chart-container" [primaryXAxis]='primaryXAxis'[primaryYAxis]='primaryYAxis' [title]='title'>
        <e-series-collection>
            <e-series [dataSource]='chartData' type='Column' xName='x' yName='y' name='Warmest' width=2 [marker]='marker'></e-series>
        </e-series-collection>
    </ejs-chart>`
})
export class AppComponent implements OnInit {
    public primaryXAxis?: Object;
    public chartData?: Object[];
    public title?: string;
    public primaryYAxis?: Object;
    public marker?: Object;
    ngOnInit(): void {
        this.chartData = columnData;
        this.primaryXAxis = {
            valueType: 'Category'
        };
        this.marker = { dataLabel: { visible: true, position: 'Middle' }
        };
        this.title = 'Alaska Weather Statistics - 2016';
    }

}
import { bootstrapApplication } from '@angular/platform-browser';
import { AppComponent } from './app.component';
import 'zone.js';
bootstrapApplication(AppComponent).catch((err) => console.error(err));Note: The
Outerposition applies only to column and bar series types.
Data Label Template
Customize label content using templates. Use placeholders such as ${point.x} and ${point.y} to display data point values. The template property enables fully customizable and visually rich labels.
Change color for the background in the datalabel template
Initialize the datalabel template div as shown in the following html page,
    <script id="index" type="text/x-template">
    <div id='templateWrap' style="background-color: ${point.text}; border-radius: 3px;"><span>${point.y}</span></div>
    </script>
import { ChartModule } from '@syncfusion/ej2-angular-charts'
import { DateTimeService, CategoryService, LineSeriesService, ColumnSeriesService } from '@syncfusion/ej2-angular-charts'
import { LegendService, DataLabelService } from '@syncfusion/ej2-angular-charts'
import { Component, OnInit } from '@angular/core';
import { columnData } from './datasource';
@Component({
imports: [
         ChartModule
    ],

providers: [ DateTimeService, LineSeriesService, LegendService, DataLabelService, ColumnSeriesService, CategoryService ],
standalone: true,
    selector: 'app-container',
    template: `<ejs-chart id="chart-container" [primaryXAxis]='primaryXAxis'[primaryYAxis]='primaryYAxis' [title]='title'>
        <e-series-collection>
            <e-series [dataSource]='chartData' type='Column' xName='x' yName='y' name='Warmest' width=2 [marker]='marker'></e-series>
        </e-series-collection>
    </ejs-chart>`
})
export class AppComponent implements OnInit {
    public primaryXAxis?: Object;
    public chartData?: Object[];
    public title?: string;
    public marker?: Object;
    primaryYAxis: any;
    ngOnInit(): void {
        this.chartData = columnData;
        this.primaryXAxis = {
            title: 'Months',
            valueType: 'Category', labelFormat: 'yMMM',
            edgeLabelPlacement: 'Shift'
        };
        this.marker = { dataLabel: { visible: true, position: 'Middle',
                        template: '<div>${point.x}</div><div>${point.y}</div>' }
        };
        this.title = 'Alaska Weather Statistics - 2016';
    }

}
import { bootstrapApplication } from '@angular/platform-browser';
import { AppComponent } from './app.component';
import 'zone.js';
bootstrapApplication(AppComponent).catch((err) => console.error(err));To show that datalabel template, set the element id to the template property in datalabel.
import { ChartModule } from '@syncfusion/ej2-angular-charts'
import { LineSeriesService, DateTimeService, DataLabelService, StackingColumnSeriesService, CategoryService,
       StepAreaSeriesService,ChartAnnotationService, LegendService, TooltipService} from '@syncfusion/ej2-angular-charts'


import { Component, OnInit } from '@angular/core';

@Component({
imports: [
         ChartModule
    ],

providers: [ LineSeriesService, DateTimeService, DataLabelService, StackingColumnSeriesService,CategoryService,
               StepAreaSeriesService,ChartAnnotationService, LegendService, TooltipService],
standalone: true,
    selector: 'app-container',
    template: `<ejs-chart id="chart-container" [title]='title'>
        <e-series-collection>
            <e-series [dataSource]='chartData' type='Line' xName='x' yName='y' name='Female' width=2 [marker]='marker'></e-series>
        </e-series-collection>
    </ejs-chart>`
})
export class AppComponent implements OnInit {
    public chartData?: Object[];
    public title?: string;
    public marker?: Object;
    ngOnInit(): void {
        this.chartData =[
                   { x: 10, y: 7000, color: 'red' },
                   { x: 20, y: 1000, color: 'yellow' },
                   { x: 30, y: 12000, color: 'orange' },
                   { x: 40, y: 14000, color: 'skyblue' },
                   { x: 50, y: 11000, color: 'blue' },
                   { x: 60, y: 5000, color: 'green' },
                   { x: 70, y: 7300, color: 'pink' },
                   { x: 80, y: 9000, color: 'white' },
                   { x: 90, y: 12000, color: 'magenta' },
                   { x: 100, y: 14000, color: 'purple' },
                   { x: 110, y: 11000, color: 'teal' },
                   { x: 120, y: 5000, color: 'gray' },
                ];
        this.marker = { visible: true, dataLabel: { visible: true, name: 'color', template: '#index' }};
        this.title = 'Sales Rate in USA';
    }
}
import { bootstrapApplication } from '@angular/platform-browser';
import { AppComponent } from './app.component';
import 'zone.js';
bootstrapApplication(AppComponent).catch((err) => console.error(err));Format
Apply number or date formatting using the format property. Global formatting symbols include:
-
n– number format -
p– percentage format -
c– currency format
import { ChartModule } from '@syncfusion/ej2-angular-charts'
import { DateTimeService, CategoryService, LineSeriesService, ColumnSeriesService } from '@syncfusion/ej2-angular-charts'
import { LegendService, DataLabelService } from '@syncfusion/ej2-angular-charts'
import { Component, OnInit } from '@angular/core';
import { columnData } from './datasource';
@Component({
imports: [
         ChartModule
    ],

providers: [ DateTimeService, LineSeriesService, LegendService, DataLabelService, ColumnSeriesService, CategoryService ],
standalone: true,
    selector: 'app-container',
    template: `<ejs-chart id="chart-container" [primaryXAxis]='primaryXAxis'[primaryYAxis]='primaryYAxis' [title]='title'>
        <e-series-collection>
            <e-series [dataSource]='chartData' type='Column' xName='x' yName='y' name='Warmest' width=2 [marker]='marker'></e-series>
        </e-series-collection>
    </ejs-chart>`
})
export class AppComponent implements OnInit {
    public primaryXAxis?: Object;
    public chartData?: Object[];
    public title?: string;
    public marker?: Object;
    primaryYAxis: any;
    ngOnInit(): void {
        this.chartData = columnData;
        this.primaryXAxis = {
            title: 'Months',
            valueType: 'Category', labelFormat: 'yMMM',
            edgeLabelPlacement: 'Shift'
        };
        this.marker = { dataLabel: { visible: true, format: 'p1'}
        };
        this.title = 'Alaska Weather Statistics - 2016';
    }

}
import { bootstrapApplication } from '@angular/platform-browser';
import { AppComponent } from './app.component';
import 'zone.js';
bootstrapApplication(AppComponent).catch((err) => console.error(err));| Value | Format | Resultant Value | Description |
|---|---|---|---|
| 1000 | n1 | 1000.0 | The number is rounded to 1 decimal place. |
| 1000 | n2 | 1000.00 | The number is rounded to 2 decimal places. |
| 1000 | n3 | 1000.000 | The number is rounded to 3 decimal place. |
| 0.01 | p1 | 1.0% | The number is converted to percentage with 1 decimal place. |
| 0.01 | p2 | 1.00% | The number is converted to percentage with 2 decimal place. |
| 0.01 | p3 | 1.000% | The number is converted to percentage with 3 decimal place. |
| 1000 | c1 | $1000.0 | The currency symbol is appended to number and number is rounded to 1 decimal place. |
| 1000 | c2 | $1000.00 | The currency symbol is appended to number and number is rounded to 2 decimal place. |
Text Mapping
Display custom text using the name property, which maps label text from a specific field in the data source. This feature is useful for descriptive or category‑based labels.
import { ChartModule } from '@syncfusion/ej2-angular-charts'
import { DateTimeService, CategoryService, LineSeriesService, ColumnSeriesService } from '@syncfusion/ej2-angular-charts'
import { LegendService, DataLabelService } from '@syncfusion/ej2-angular-charts'
import { Component, OnInit } from '@angular/core';
import { mapData } from './datasource';
@Component({
imports: [
         ChartModule
    ],

providers: [ DateTimeService, LineSeriesService, LegendService, DataLabelService, ColumnSeriesService, CategoryService ],
standalone: true,
    selector: 'app-container',
    template: `<ejs-chart id="chart-container" [primaryXAxis]='primaryXAxis'[primaryYAxis]='primaryYAxis' [title]='title'>
        <e-series-collection>
            <e-series [dataSource]='chartData' type='Column' xName='x' yName='y' name='Warmest' width=2 [marker]='marker'></e-series>
        </e-series-collection>
    </ejs-chart>`
})
export class AppComponent implements OnInit {
    public primaryXAxis?: Object;
    public chartData?: Object[];
    public title?: string;
    public primaryYAxis?: Object;
    public marker?: Object;
    ngOnInit(): void {
        this.chartData = mapData;
        this.primaryXAxis = {
            valueType: 'Category'
        };
        this.marker = { dataLabel: { visible: true, name: 'text'}
        };
        this.title = 'Alaska Weather Statistics - 2016';
    }

}
import { bootstrapApplication } from '@angular/platform-browser';
import { AppComponent } from './app.component';
import 'zone.js';
bootstrapApplication(AppComponent).catch((err) => console.error(err));Margin
Adjust spacing around labels using the margin property, which includes left, right, bottom, and top values. Margins help prevent labels from overlapping chart elements.
import { ChartModule } from '@syncfusion/ej2-angular-charts'
import { DateTimeService, CategoryService, LineSeriesService, ColumnSeriesService } from '@syncfusion/ej2-angular-charts'
import { LegendService, DataLabelService } from '@syncfusion/ej2-angular-charts'
import { Component, OnInit } from '@angular/core';
import { columnData } from './datasource';
@Component({
imports: [
         ChartModule
    ],

providers: [ DateTimeService, LineSeriesService, LegendService, DataLabelService, ColumnSeriesService, CategoryService ],
standalone: true,
    selector: 'app-container',
    template: `<ejs-chart id="chart-container" [primaryXAxis]='primaryXAxis'[primaryYAxis]='primaryYAxis' [title]='title'>
        <e-series-collection>
            <e-series [dataSource]='chartData' type='Column' xName='x' yName='y' name='Warmest' width=2 [marker]='marker'></e-series>
        </e-series-collection>
    </ejs-chart>`
})
export class AppComponent implements OnInit {
    public primaryXAxis?: Object;
    public chartData?: Object[];
    public title?: string;
    public primaryYAxis?: Object;
    public marker?: Object;
    ngOnInit(): void {
        this.chartData = columnData;
        this.primaryXAxis = {
            valueType: 'Category'
        };
        this.marker = { dataLabel: { visible: true,border:{width: 1, color : 'red'},
                        margin:{
                            left:5,
                            right:5,
                            top:5,
                            bottom:5
                        } }
        };
        this.title = 'Alaska Weather Statistics - 2016';
    }

}
import { bootstrapApplication } from '@angular/platform-browser';
import { AppComponent } from './app.component';
import 'zone.js';
bootstrapApplication(AppComponent).catch((err) => console.error(err));Data label rotation
Rotate data labels using the angle property. Rotation improves readability when labels are long or when space is limited.
import { ChartModule } from '@syncfusion/ej2-angular-charts'
import { DateTimeService, CategoryService, LineSeriesService, ColumnSeriesService } from '@syncfusion/ej2-angular-charts'
import { LegendService, DataLabelService } from '@syncfusion/ej2-angular-charts'
import { Component, OnInit } from '@angular/core';
import { columnData } from './datasource';
@Component({
imports: [
         ChartModule
    ],

providers: [ DateTimeService, LineSeriesService, LegendService, DataLabelService, ColumnSeriesService, CategoryService ],
standalone: true,
    selector: 'app-container',
    template: `<ejs-chart id="chart-container" [primaryXAxis]='primaryXAxis'[primaryYAxis]='primaryYAxis' [title]='title'>
        <e-series-collection>
            <e-series [dataSource]='chartData' type='Column' xName='x' yName='y' name='Warmest' width=2 [marker]='marker'></e-series>
        </e-series-collection>
    </ejs-chart>`
})
export class AppComponent implements OnInit {
    public primaryXAxis?: Object;
    public chartData?: Object[];
    public title?: string;
    public primaryYAxis?: Object;
    public marker?: Object;
    ngOnInit(): void {
        this.chartData = columnData;
        this.primaryXAxis = {
            valueType: 'Category'
        };
        this.marker = { dataLabel: { visible: true, border:{width: 1, color : 'red'},
                        margin:{
                            left:5,
                            right:5,
                            top:5,
                            bottom:5
                        }, angle : 45, enableRotation: true }
        };
        this.title = 'Alaska Weather Statistics - 2016';
    }
}
import { bootstrapApplication } from '@angular/platform-browser';
import { AppComponent } from './app.component';
import 'zone.js';
bootstrapApplication(AppComponent).catch((err) => console.error(err));Customization
Enhance label appearance using properties such as fill (background), border, and corner radius (rx, ry). Refine text appearance using the font settings, which support color, fontFamily, fontWeight, and size.
import { ChartModule } from '@syncfusion/ej2-angular-charts'
import { DateTimeService, CategoryService, LineSeriesService, ColumnSeriesService } from '@syncfusion/ej2-angular-charts'
import { LegendService, DataLabelService } from '@syncfusion/ej2-angular-charts'
import { Component, OnInit } from '@angular/core';
import { columnData } from './datasource';
@Component({
imports: [
         ChartModule
    ],

providers: [ DateTimeService, LineSeriesService, LegendService, DataLabelService, ColumnSeriesService, CategoryService ],
standalone: true,
    selector: 'app-container',
    template: `<ejs-chart id="chart-container" [primaryXAxis]='primaryXAxis'[primaryYAxis]='primaryYAxis' [title]='title'>
        <e-series-collection>
            <e-series [dataSource]='chartData' type='Column' xName='x' yName='y' name='Warmest' width=2 [marker]='marker'></e-series>
        </e-series-collection>
    </ejs-chart>`
})
export class AppComponent implements OnInit {
    public primaryXAxis?: Object;
    public chartData?: Object[];
    public title?: string;
    public primaryYAxis?: Object;
    public marker?: Object;
    ngOnInit(): void {
        this.chartData = columnData;
        this.primaryXAxis = {
            valueType: 'Category'
        };
        this.marker = { dataLabel: { visible: true,
                        border:{width: 2, color : 'red'},
                        rx:10, ry: 10
                    }
        };
        this.title = 'Alaska Weather Statistics - 2016';
    }

}
import { bootstrapApplication } from '@angular/platform-browser';
import { AppComponent } from './app.component';
import 'zone.js';
bootstrapApplication(AppComponent).catch((err) => console.error(err));Note: The
rxandryproperties require non‑nullbordervalues.
Customizing specific point
Customize individual markers or labels using the pointRenderand textRender events.
-
pointRendermodifies shape, color, or border of a point. -
textRendercustomizes the label text for specific points.
import { ChartModule } from '@syncfusion/ej2-angular-charts'
import { DateTimeService, CategoryService, LineSeriesService, ColumnSeriesService } from '@syncfusion/ej2-angular-charts'
import { LegendService, DataLabelService } from '@syncfusion/ej2-angular-charts'
import { Component, OnInit } from '@angular/core';
import { IPointRenderEventArgs, ITextRenderEventArgs } from '@syncfusion/ej2-angular-charts';
import { columnData } from './datasource';
@Component({
imports: [
         ChartModule
    ],

providers: [ DateTimeService, LineSeriesService, LegendService, DataLabelService, ColumnSeriesService, CategoryService ],
standalone: true,
    selector: 'app-container',
    template: `<ejs-chart id="chart-container" [primaryXAxis]='primaryXAxis'[primaryYAxis]='primaryYAxis' (pointRender)='pointRender($event)' (textRender)='textRender($event)'[title]='title'>
        <e-series-collection>
            <e-series [dataSource]='chartData' type='Column' xName='x' yName='y' name='Warmest' width=2 [marker]='marker'></e-series>
        </e-series-collection>
    </ejs-chart>`
})
export class AppComponent implements OnInit {
    public primaryXAxis?: Object;
    public chartData?: Object[];
    public title?: string;
    public marker?: Object;
    primaryYAxis: any;
    public pointRender(args: IPointRenderEventArgs): void {
        if(args.point.index === 6) {
                args.fill = 'red'
        }
    };
    public textRender(args: ITextRenderEventArgs): void {
            if(args.point.index === 6){
                args.text = 'Maximum Temperature';
                args.color = 'red';
            }
    };
    ngOnInit(): void {
        this.chartData = columnData;
        this.primaryXAxis = {
            title: 'Months',
            valueType: 'Category', labelFormat: 'yMMM',
            edgeLabelPlacement: 'Shift'
        };
        this.marker = { dataLabel: { visible: true }
        };
        this.title = 'Alaska Weather Statistics - 2016';
    }

}
import { bootstrapApplication } from '@angular/platform-browser';
import { AppComponent } from './app.component';
import 'zone.js';
bootstrapApplication(AppComponent).catch((err) => console.error(err));Show percentage based on each series points
Calculate and display percentage values based on each series’ total using the seriesRender and textRender events.
- In
seriesRender, compute the total ofyvalues. - In
textRender, calculate the percentage for each point and update the label text.
import { ChartModule } from '@syncfusion/ej2-angular-charts'
import { DateTimeService, CategoryService, LineSeriesService, ColumnSeriesService } from '@syncfusion/ej2-angular-charts'
import { LegendService, DataLabelService } from '@syncfusion/ej2-angular-charts'
import { Component, ViewEncapsulation } from '@angular/core';
import {
    ISeriesRenderEventArgs,
    ITextRenderEventArgs,
} from '@syncfusion/ej2-angular-charts';
import { Browser } from '@syncfusion/ej2-base';

let total: any = [];

/**
 * Sample for Column Series
 */
@Component({
imports: [
         ChartModule
    ],

providers: [ DateTimeService, LineSeriesService, LegendService, DataLabelService, ColumnSeriesService, CategoryService ],
standalone: true,
    selector: 'app-container',
    template: `<div class="control-section">
    <div align='center'>
        <ejs-chart style='display:block;' [chartArea]='chartArea' [width]='width' align='center' id='chartcontainer' [primaryXAxis]='primaryXAxis'
            [primaryYAxis]='primaryYAxis' [title]='title' [tooltip]='tooltip' (seriesRender)='seriesRender($event)' (textRender)='textRender($event)'>
            <e-series-collection>
                <e-series [dataSource]='data' type='Column' xName='x' yName='y' name='Gold' width=2 [marker]='marker'> </e-series>
                <e-series [dataSource]='data1' type='Column' xName='x' yName='y' name='Silver' width=2 [marker]='marker'> </e-series>
                <e-series [dataSource]='data2' type='Column' xName='x' yName='y' name='Bronze' width=2 [marker]='marker'> </e-series>
            </e-series-collection>
        </ejs-chart>
    </div>
    <div style="float: right; margin-right: 10px; margin-top: -5px">Source:
        <a href="https://www.gov.uk/" target='_blank'>www.gov.uk</a>
    </div>
</div>`,
    encapsulation: ViewEncapsulation.None,
})
export class AppComponent {
    public data: Object[] = [
        { x: 'USA', y: 46 },
        { x: 'GBR', y: 27 },
        { x: 'CHN', y: 26 },
    ];
    public data1: Object[] = [
        { x: 'USA', y: 37 },
        { x: 'GBR', y: 23 },
        { x: 'CHN', y: 18 },
    ];
    public data2: Object[] = [
        { x: 'USA', y: 38 },
        { x: 'GBR', y: 17 },
        { x: 'CHN', y: 26 },
    ];
    //Initializing Primary X Axis
    public primaryXAxis: Object = {
        valueType: 'Category',
        interval: 1,
        majorGridLines: { width: 0 },
    };
    //Initializing Primary Y Axis
    public primaryYAxis: Object = {
        majorGridLines: { width: 0 },
        majorTickLines: { width: 0 },
        lineStyle: { width: 0 },
        labelStyle: { color: 'transparent' },
    };
    public marker: Object = {
        dataLabel: {
            visible: true,
            position: 'Top',
            font: { fontWeight: '600', color: '#ffffff' },
        },
    };
    public title: string = 'Olympic Medal Counts - RIO';
    public tooltip: Object = {
        enable: true,
    };
    // custom code start
    public seriesRender(args: ISeriesRenderEventArgs | any): void {
        for (let i = 0; i < args.data.length; i++) {
            if (!total[args.data[i].x]) total[args.data[i].x] = 0;
            total[args.data[i].x] += parseInt(args.data[i].y);
        }
    }
    public textRender(args: ITextRenderEventArgs | any): void {
        let percentage: number | string = (parseInt(args.text) / total[args.point.x]) * 100;
        percentage = percentage % 1 === 0 ? percentage : percentage.toFixed(2);
        args.text = percentage + '%';
    }
    // custom code end
    public chartArea: Object = {
        border: {
            width: 0,
        },
    };
    public width: string = Browser.isDevice ? '100%' : '60%';

    constructor() {
        //code
    }
}
import { bootstrapApplication } from '@angular/platform-browser';
import { AppComponent } from './app.component';
import 'zone.js';
bootstrapApplication(AppComponent).catch((err) => console.error(err));Last value label
The lastValueLabel in a chart allows you to easily display the value of the last data point in a series. This feature provides an intuitive way to highlight the most recent or last data value in a series on your chart.
Enable last value label
To show the last value label, make sure the enable property inside the lastValueLabel settings is set to true within the series configuration.
import { ChartModule } from '@syncfusion/ej2-angular-charts'
import {
    ColumnSeriesService, DataLabelService, CategoryService, LegendService, TooltipService, LastValueLabelService
} from '@syncfusion/ej2-angular-charts'


import { Component, OnInit } from '@angular/core';

@Component({
    imports: [
        ChartModule
    ],

    providers: [ColumnSeriesService, DataLabelService, CategoryService, LegendService, TooltipService, LastValueLabelService],
    standalone: true,
    selector: 'app-container',
    template: `<ejs-chart id="chart-container"  [primaryXAxis]='primaryXAxis' [primaryYAxis]='primaryYAxis' [title]='title' [tooltip]='tooltip' [width]='width'>
        <e-series-collection>
            <e-series [dataSource]='chartData' type='Column' xName='x' yName='y' name='series1' [marker]='marker' [lastValueLabel]='lastValueLabel'></e-series>
        </e-series-collection>
    </ejs-chart>`
})
export class AppComponent implements OnInit {
    public title?: string;
    public width?: string;
    public tooltip?: Object;
    public lastValueLabel?: Object;
    public chartData?: Object[];
    public primaryXAxis?: Object;
    public primaryYAxis?: Object;
    public marker?: Object;
    ngOnInit(): void {
        this.chartData = [
            { x: 2005, y: 28 }, { x: 2006, y: 25 }, { x: 2007, y: 26 }, { x: 2008, y: 27 },
            { x: 2009, y: 32 }, { x: 2010, y: 35 }, { x: 2011, y: 40 }
        ];
        this.lastValueLabel = { enable: true };
        this.width = '90%';
        this.primaryXAxis = {
            title: 'Year',
            interval: 1
        };
        this.primaryYAxis = {
            title: 'Efficiency',
            labelFormat: '{value}%'
        };
        this.tooltip = { enable: true };
        this.marker = { visible: false, dataLabel: { visible: true } };
        this.title = 'Efficiency of oil-fired power production';
    }
}
import { bootstrapApplication } from '@angular/platform-browser';
import { AppComponent } from './app.component';
import 'zone.js';
bootstrapApplication(AppComponent).catch((err) => console.error(err));Note: To use last value label feature, we need to inject
LastValueLabelServiceinto the@NgModule.providers.
Customization in last label
The appearance of the last value label can be customized using style properties such as font, background, border, dashArray, lineWidth, lineColor, rx, and ry in the lastValueLabel property of the chart series. These settings allow you to tailor the label’s look to align with your desired visual presentation.
import { ChartModule } from '@syncfusion/ej2-angular-charts'
import {
    ColumnSeriesService, DataLabelService, CategoryService, LegendService, TooltipService, LastValueLabelService
} from '@syncfusion/ej2-angular-charts'


import { Component, OnInit } from '@angular/core';

@Component({
    imports: [
        ChartModule
    ],

    providers: [ColumnSeriesService, DataLabelService, CategoryService, LegendService, TooltipService, LastValueLabelService],
    standalone: true,
    selector: 'app-container',
    template: `<ejs-chart id="chart-container"  [primaryXAxis]='primaryXAxis' [primaryYAxis]='primaryYAxis' [title]='title' [tooltip]='tooltip' [width]='width'>
        <e-series-collection>
            <e-series [dataSource]='chartData' type='Column' xName='x' yName='y' name='series1' [marker]='marker' [lastValueLabel]='lastValueLabel'></e-series>
        </e-series-collection>
    </ejs-chart>`
})
export class AppComponent implements OnInit {
    public title?: string;
    public width?: string;
    public tooltip?: Object;
    public lastValueLabel?: Object;
    public chartData?: Object[];
    public primaryXAxis?: Object;
    public primaryYAxis?: Object;
    public marker?: Object;
    ngOnInit(): void {
        this.chartData = [
            { x: 2005, y: 28 }, { x: 2006, y: 25 }, { x: 2007, y: 26 }, { x: 2008, y: 27 },
            { x: 2009, y: 32 }, { x: 2010, y: 35 }, { x: 2011, y: 40 }
        ];
        this.lastValueLabel = { enable: true, background: "blue", lineColor: "red", lineWidth: 2, dashArray: "5,5", rx: 10, ry: 10, border: { width: 2, color: "red" }, font: { color: "white", size: "12px", fontWeight: "bold" } };
        this.width = '90%';
        this.primaryXAxis = {
            title: 'Year',
            interval: 1
        };
        this.primaryYAxis = {
            title: 'Efficiency',
            labelFormat: '{value}%'
        };
        this.tooltip = { enable: true };
        this.marker = { visible: false, dataLabel: { visible: true } };
        this.title = 'Efficiency of oil-fired power production';
    }
}
import { bootstrapApplication } from '@angular/platform-browser';
import { AppComponent } from './app.component';
import 'zone.js';
bootstrapApplication(AppComponent).catch((err) => console.error(err));Prevent data label
Hide data labels for points whose value is 0 using the textRender event. In the handler, check args.point.y and set args.cancel to true when it equals 0.
import { ChartModule, ChartAllModule, AccumulationChartAllModule } from '@syncfusion/ej2-angular-charts'
import { AccumulationChartModule } from '@syncfusion/ej2-angular-charts'
import { PieSeriesService, AccumulationTooltipService, AccumulationDataLabelService } from '@syncfusion/ej2-angular-charts'
import {
    LineSeriesService, DateTimeService, DataLabelService, StackingColumnSeriesService, CategoryService,
    StepAreaSeriesService, SplineSeriesService, ScrollBarService, ChartAnnotationService, LegendService, TooltipService, StripLineService,
    SelectionService, ScatterSeriesService, ZoomService, ColumnSeriesService, AreaSeriesService, RangeAreaSeriesService
} from '@syncfusion/ej2-angular-charts'


import { Component, OnInit } from '@angular/core';
import { ITextRenderEventArgs } from '@syncfusion/ej2-angular-charts';

@Component({
imports: [
         ChartModule, ChartAllModule, AccumulationChartAllModule, AccumulationChartModule
    ],

providers: [LineSeriesService, DateTimeService, ColumnSeriesService, DataLabelService, ZoomService, StackingColumnSeriesService, CategoryService,
        StepAreaSeriesService, SplineSeriesService, ChartAnnotationService, LegendService, TooltipService, StripLineService,
        PieSeriesService, AccumulationTooltipService, ScrollBarService, AccumulationDataLabelService, SelectionService, ScatterSeriesService,
        AreaSeriesService, RangeAreaSeriesService ],
standalone: true,
    selector: 'app-container',
    template: `<ejs-chart id="chart-container" [primaryXAxis]='primaryXAxis'[primaryYAxis]='primaryYAxis' [title]='title' (textRender)='textRender($event)'>
        <e-series-collection>
            <e-series [dataSource]='chartData' type='Line' xName='x' yName='y' name='India' width=2 [marker]='marker'></e-series>
        </e-series-collection>
    </ejs-chart>`
})
export class AppComponent implements OnInit {
    public primaryXAxis?: Object;
    public chartData?: Object[];
    public title?: string;
    public marker?: Object;
    public primaryYAxis?: Object;
    public textRender(args: ITextRenderEventArgs): void {
        if (args.text === '0') {
          args.cancel = args.point.y === 0;
        }
    };
    ngOnInit(): void {
        this.chartData = [
             { x: new Date(2005, 0, 1), y: 21 }, { x: new Date(2006, 0, 1), y: 24 },
             { x: new Date(2007, 0, 1), y: 0 }, { x: new Date(2008, 0, 1), y: 38 },
             { x: new Date(2009, 0, 1), y: 54 }, { x: new Date(2010, 0, 1), y: 57 },
        ];
        this.primaryXAxis = {
           title: 'Year',
           valueType: 'DateTime'
        };
        this.primaryYAxis = {
           title: 'Efficiency',
        };
        this.marker = { visible: true, width: 10, height: 10, dataLabel: { visible: true}};
        this.title = 'Inflation - Consumer Price';
    }

}
import { bootstrapApplication } from '@angular/platform-browser';
import { AppComponent } from './app.component';
import 'zone.js';
bootstrapApplication(AppComponent).catch((err) => console.error(err));