How can I help you?
Getting Started with the Vue Bullet Chart Component in Vue 2
19 Mar 202611 minutes to read
This article provides a step-by-step guide for setting up a Vue 2 project using Vue-CLI and integrating the Syncfusion® Vue Bullet Chart component.
Prerequisites
System requirements for Syncfusion® Vue UI components
Dependencies
Below is the list of minimum dependencies required to use the Bullet Chart component.
|-- @syncfusion/ej2-vue-charts
    |-- @syncfusion/ej2-base
    |-- @syncfusion/ej2-data
    |-- @syncfusion/ej2-pdf-export
    |-- @syncfusion/ej2-file-utils
    |-- @syncfusion/ej2-compression
    |-- @syncfusion/ej2-charts
    |-- @syncfusion/ej2-vue-base
    |-- @syncfusion/ej2-svg-base
Setup the Vue 2 project
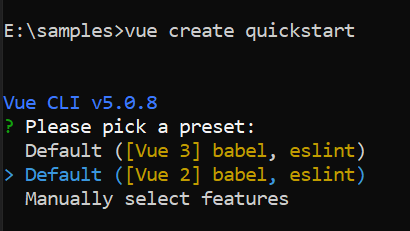
To generate a Vue 2 project using Vue-CLI, use the vue create command. Follow these steps to install Vue CLI and create a new project:
npm install -g @vue/cli
vue create quickstart
cd quickstart
npm run serve
or
yarn global add @vue/cli
vue create quickstart
cd quickstart
yarn run serve
When creating a new project, choose the option Default ([Vue 2] babel, eslint) from the menu.
Once the quickstart project is set up with default settings, proceed to add Syncfusion® components to the project.
Add Syncfusion® Vue packages
Syncfusion® packages are available at npmjs.com. To use Vue components, install the required npm package.
This article uses the Vue Bullet Chart component as an example. Install the @syncfusion/ej2-vue-charts package by running the following command:
npm install @syncfusion/ej2-vue-charts --saveor
yarn add @syncfusion/ej2-vue-chartsThe –save will instruct NPM to include the Bullet Chart package inside of the
dependenciessection of thepackage.json.
Add Syncfusion® Vue component
Follow the steps below to add the Vue Bullet Chart component:
- First, import and register the Bullet Chart component in the
scriptsection of the src/App.vue file.
<script>
import { BulletChartComponent } from '@syncfusion/ej2-vue-charts';

export default {
  components: {
    'ejs-bulletchart': BulletChartComponent
  }
}
</script>- In the
templatesection, define the Bullet Chart component.
<template>
  <div>
      <ejs-bulletchart id="bulletChart"> </ejs-bulletchart>
  </div>
</template>
Here is the summarized code for the above steps in the src/App.vue file:
<template>
  <div>
    <ejs-bulletchart id="bulletChart"> </ejs-bulletchart>
  </div>
</template>
<script>
import { BulletChartComponent } from '@syncfusion/ej2-vue-charts';

export default {
  name: "App",
  components: {
    'ejs-bulletchart': BulletChartComponent
  },
  data() {
    return {
    }
  }
}
</script>
Run the project
To run the project, use the following command:
npm run serveor
yarn run serveModule Injection
Bullet Chart component are segregated into individual feature-wise modules. In order to use a particular feature, you need to inject its feature module using provide method. In the current application, we are going to use tooltip feature of the Bullet Chart.
• BulletTooltip - Inject this provider to use tooltip feature.
These modules should be injected to the provide method as follows,
import { BulletChartComponent, BulletTooltip } from "@syncfusion/ej2-vue-charts";

export default {
  components: {
    'ejs-bulletchart': BulletChartComponent
  },
  provide: {
    bulletChart: [BulletTooltip]
  }
};
BulletChart With Data
This section explains how to plot local data to the Bullet Chart.
let data: any[] = [
       { value: 100, target: 80 },
       { value: 200, target: 180 },
       { value: 300, target: 280 },
       { value: 400, target: 380 },
       { value: 500, target: 480 },
];
Now assign the local data to the dataSource property. Map the value and target fields to valueField and targetField respectively.
<template>
  <div>
    <ejs-bulletchart id="bulletChart" :dataSource="data" valueField="value" targetField="target" height="300"
      :minimum="minimum" :maximum="maximum" :interval="interval"> </ejs-bulletchart>
  </div>
</template>
<script>
import { BulletChartComponent } from '@syncfusion/ej2-vue-charts';

export default {
  name: "App",
  components: {
    'ejs-bulletchart': BulletChartComponent
  },
  data() {
    return {
      data: [
        { value: 100, target: 80 },
        { value: 200, target: 180 },
        { value: 300, target: 280 },
        { value: 400, target: 380 },
        { value: 500, target: 480 },
      ],
      minimum: 0, maximum: 500, interval: 50
    }
  }
}
</script>Add Bullet Chart Title
You can add a title using title property to the Bullet Chart to provide quick information to the user about the data plotted in the Bullet Chart.
<template>
  <div>
      <ejs-bulletchart id="bulletChart"
        :dataSource="data"
        valueField="value"
        targetField="target"
        :minimum="minimum"
        :maximum="maximum"
        :interval="interval"
        title="Revenue"
      > </ejs-bulletchart>
  </div>
</template>
<script>
import { BulletChartComponent } from '@syncfusion/ej2-vue-charts';

export default {
name: "App",
  components: {
    'ejs-bulletchart': BulletChartComponent
  },
  data () {
    return {
      data: [{ value: 270, target: 250 }],
      minimum: 0, maximum: 300, interval: 50
    }
  }
}
</script>Ranges
You can add a range using e-bullet-range of the e-bullet-range-collection.
<template>
  <div>
    <ejs-bulletchart id="bulletChart" :dataSource="data" valueField="value" targetField="target" :minimum="minimum"
      :maximum="maximum" :interval="interval" title="Revenue">
      <e-bullet-range-collection>
        <e-bullet-range end="100" color="red"></e-bullet-range>
        <e-bullet-range end="200" color="blue"></e-bullet-range>
        <e-bullet-range end="300" color="green"></e-bullet-range>
      </e-bullet-range-collection>
    </ejs-bulletchart>
  </div>
</template>
<script>
import { BulletChartComponent, BulletRangeCollectionDirective, BulletRangeDirective } from '@syncfusion/ej2-vue-charts';

export default {
  name: "App",
  components: {
    'ejs-bulletchart': BulletChartComponent,
    'e-bullet-range-collection': BulletRangeCollectionDirective,
    'e-bullet-range': BulletRangeDirective
  },
  data() {
    return {
      data: [{ value: 270, target: 250 }],
      minimum: 0, maximum: 300, interval: 50
    }
  }
}
</script>Tooltip
Enable tooltip for the Bullet Chart by setting the enable property to true in the tooltip object and registering the BulletTooltip module in provide.
Verify the chart
After starting the dev server, confirm the bullet chart renders correctly:
- Start the dev server with
npm run serveoryarn run serve. - Open the project URL shown in the terminal and verify the chart displays.
- If the chart does not render, inspect the browser console for errors related to missing modules, incorrect imports, or incompatible Vue versions.
Troubleshooting (common issues)
- Chart not rendering: ensure the
BulletTooltipand other required modules are registered inprovideand thatdataSourcecontains valid data. - Incorrect mappings: verify
valueFieldandtargetFieldpoint to the correct keys in the data objects. - Version mismatch: confirm
@syncfusion/ej2-vue-chartsis compatible with Vue 2 in the project.
<template>
  <div>
    <ejs-bulletchart id="bulletChart" :dataSource="data" valueField="value" targetField="target" :minimum="minimum"
      :maximum="maximum" :interval="interval" title="Revenue" :tooltip="tooltip"> </ejs-bulletchart>
  </div>
</template>
<script>
import { BulletChartComponent, BulletTooltip } from '@syncfusion/ej2-vue-charts';

export default {
  name: "App",
  components: {
    'ejs-bulletchart': BulletChartComponent
  },
  data() {
    return {
      data: [{ value: 270, target: 250 }],
      minimum: 0, maximum: 300, interval: 50,
      tooltip: { enable: true }
    }
  },
  provide: {
    bulletChart: [BulletTooltip]
  }
}
</script>