Getting Started with Vue Bullet Chart
11 Aug 20268 minutes to read
This article provides a step-by-step guide to setting up a Vite JavaScript project and integrating the Syncfusion® Vue Bullet Chart component using either the Composition API or the Options API.
The Composition API groups related logic into reusable functions. The Options API organizes component logic with options such as data, methods, and life cycle hooks. Choose the API that best fits the application’s structure.
Prerequisites
Ensure that the development environment meets the system requirements for Syncfusion Vue UI components.
Set Up the Vite Project
Create a Vite project using either npm or yarn.
npm
npm create vite@latest my-app -- --template vueyarn
yarn create vite my-app --template vueIf Vite prompts you to install dependencies and start the project immediately, select No. The Syncfusion package is installed in a later step.
Navigate to the project directory:
cd my-appInstall the project dependencies using either npm or yarn.
npm
npm installyarn
yarn installNote: To create a TypeScript project, use
npm create vite@latest my-app -- --template vue-tsoryarn create vite my-app --template vue-ts.
Add the Syncfusion® Vue Package
Syncfusion Vue packages are available on npm.
Install the @syncfusion/ej2-vue-charts package. Use a package release compatible with Vue 3 and the Node.js version used by the project.
npm
npm install @syncfusion/ej2-vue-chartsyarn
yarn add @syncfusion/ej2-vue-chartsNote: For TypeScript projects, refer to Vue 3 with the Composition API and TypeScript or Vue 3 with the Options API and TypeScript.
Add the Syncfusion® Vue Bullet Chart Component
Follow these steps to add the Vue Bullet Chart component using the Composition API or Options API.
Step 1: Import and Register the Component
Import the Bullet Chart component used by the example in src/App.vue.
In the Composition API example, alias the imports to names that match the custom elements used in the template. Components imported in <script setup> are available directly in the template.
<script setup>
import {
  BulletChartComponent as EjsBulletchart
} from '@syncfusion/ej2-vue-charts';

</script><script>
import {
BulletChartComponent
} from '@syncfusion/ej2-vue-charts';
export default {
name: 'App',
components: {
'ejs-bulletchart': BulletChartComponent
}
};
</script>Step 2: Declare the Data and Configuration
Define the chart data, scale, title and dimensions configuration in the script section.
<script setup>
const data = [
  { value: 75, target: 85 }
];

const valueField = 'value';
const targetField = 'target';
const minimum = 0;
const maximum = 100;
const interval = 20;
const title = 'Revenue Performance';
</script><script>
export default {
data() {
return {
data: [
{ value: 75, target: 85 }
],
valueField: 'value',
targetField: 'target',
minimum: 0,
maximum: 100,
interval: 20,
title: 'Revenue Performance'
};
}
};
</script>Step 3: Define the Bullet Chart in the Template
Add the Bullet Chart to the template section of src/App.vue.
The example uses the following properties:
-
dataSourcespecifies the array of data objects. -
valueFieldmaps the feature-measure field. -
targetFieldmaps the comparative-target field. -
minimumspecifies the minimum value of the quantitative scale. -
maximumspecifies the maximum value of the quantitative scale. -
intervalspecifies the interval between scale labels. -
titlespecifies the chart title.
<template>
  <div id="app">
    <ejs-bulletchart
      id="bulletChart"
      :dataSource="data"
      :valueField="valueField"
      :targetField="targetField"
      :minimum="minimum"
      :maximum="maximum"
      :interval="interval"
      :title="title"
    >
    </ejs-bulletchart>
  </div>
</template>
Each data object must contain the fields assigned to valueField and targetField. Both mapped fields must contain numeric values within the configured scale.
Here is the summarized code for the above steps in the src/App.vue file.
Replace the contents of src/App.vue with either the Composition API or Options API example.
<template>
  <div id="app">
    <ejs-bulletchart
      id="bulletChart"
      :dataSource="data"
      :valueField="valueField"
      :targetField="targetField"
      :minimum="minimum"
      :maximum="maximum"
      :interval="interval"
      :title="title"
      :height="height"
    >
    </ejs-bulletchart>
  </div>
</template>

<script setup>
import {
  BulletChartComponent as EjsBulletchart
} from '@syncfusion/ej2-vue-charts';

const data = [
  { value: 75, target: 85 }
];

const valueField = 'value';
const targetField = 'target';
const minimum = 0;
const maximum = 100;
const interval = 20;
const title = 'Revenue Performance';
const height = '300px';

</script><template>
<div id="app">
<ejs-bulletchart
id="bulletChart"
:dataSource="data"
:valueField="valueField"
:targetField="targetField"
:minimum="minimum"
:maximum="maximum"
:interval="interval"
:title="title"
:height="height"
>
</ejs-bulletchart>
</div>
</template>
<script>
import {
BulletChartComponent
} from '@syncfusion/ej2-vue-charts';
export default {
name: 'App',
components: {
'ejs-bulletchart': BulletChartComponent
},
data() {
return {
data: [
{ value: 75, target: 85 }
],
valueField: 'value',
targetField: 'target',
minimum: 0,
maximum: 100,
interval: 20,
title: 'Revenue Performance',
height: '300px'
};
}
};
</script>Run the Project
Save src/App.vue, and then start the development server using either npm or yarn.
npm
npm run devyarn
yarn devOpen the local URL displayed in the terminal, commonly http://localhost:5173, and verify that the Bullet Chart displays.
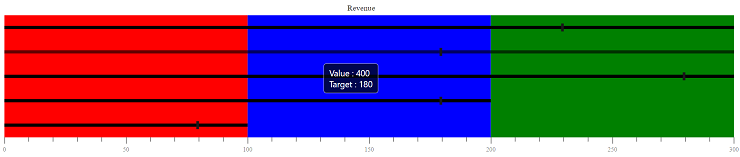
Sample: Explore the Vue 3 Bullet Chart getting-started sample.
Troubleshooting
-
The Bullet Chart is not rendered. Verify that the component import is aliased correctly in the Composition API or registered in
componentsin the Options API. Check the browser console for component, data, module, or licensing errors. -
No feature measure or target is displayed. Verify that
dataSourcecontains records,valueFieldandtargetFieldmatch fields in every data object, and the mapped fields contain numeric values. -
The scale does not contain the measure or target. Set
minimumandmaximumso that both mapped values fall within the quantitative scale. -
An import or runtime error is displayed. Verify that
@syncfusion/ej2-vue-chartsis installed and that its version supports the project’s Vue and Node.js versions.
For additional assistance, refer to the Vue Bullet Chart API documentation.