Getting started with React 3D Chart component
22 Jul 202614 minutes to read
This section describes the steps to create a simple 3D Chart component and demonstrates its basic usage.
A quick video overview of the React 3D Charts setup is available:
Prerequisites
Before getting started, ensure that your development environment meets the system requirements for Syncfusion® React UI components. That page documents the supported React, Node.js, and npm versions, and includes the React-version compatibility table for Syncfusion React components.
Dependencies
When you install @syncfusion/ej2-react-charts, the following peer dependencies are installed automatically:
|-- @syncfusion/ej2-react-charts
    |-- @syncfusion/ej2-data — utilities for working with data sources.
    |-- @syncfusion/ej2-react-base — base classes shared by all Syncfusion React components.
    |-- @syncfusion/ej2-pdf-export — PDF export support.
    |-- @syncfusion/ej2-file-utils — file handling for export features.
    |-- @syncfusion/ej2-compression — compression utilities used by exports.
    |-- @syncfusion/ej2-svg-base — SVG rendering base used by chart visuals.
Installation and configuration
Step 1: Create a React application with Vite
Use the Vite CLI to create a new React application. Vite provides a faster development environment, smaller bundle sizes, and optimized builds compared to traditional tools like create-react-app. For detailed steps, refer to the Vite installation instructions.
Note: To create a React application using
create-react-appinstead, refer to this documentation.
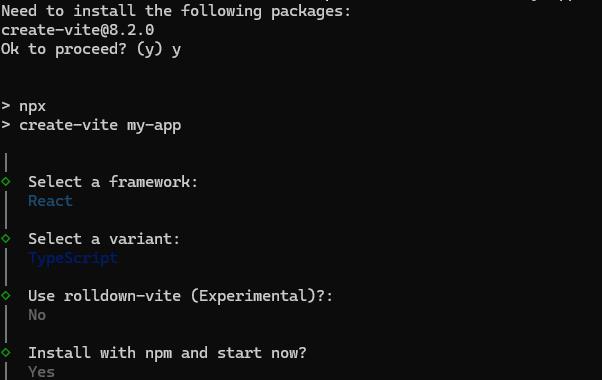
Run the following command to scaffold a new project. When prompted, pick the framework and variant that match your preferred language:
- For TypeScript: select
ReactthenTypeScript. - For JavaScript: select
ReactthenJavaScript.
npm create vite@latest my-appYou can also skip the interactive prompts by passing the template flag directly:
npm create vite@latest my-app -- --template react-ts
cd my-app
npm install
npm create vite@latest my-app -- --template react
cd my-app
npm installFor reference, the interactive prompt looks like this:
Step 2: Install the Syncfusion® React 3D Chart package
All Syncfusion® Essential JS 2 packages are published to the npm registry. Install the React 3D Chart package from the project folder:
npm install @syncfusion/ej2-react-chartsInstalling
@syncfusion/ej2-react-chartsautomatically pulls in the peer dependencies listed in the Dependencies section above. The chart component does not require any theme stylesheet import to render.
Step 3: Add the 3D Chart component
Chart3DComponent is the root component for the 3D Chart. Open src/App.tsx (or src/App.jsx for the JavaScript template) and replace its contents with the following code.
import { Chart3DComponent } from '@syncfusion/ej2-react-charts';
import * as React from 'react';
function App() {
  return (<Chart3DComponent />);
}
export default App;
import { Chart3DComponent } from '@syncfusion/ej2-react-charts';
import * as React from 'react';
function App() {
return (<Chart3DComponent />);
}
export default App;Now run the npm run dev command in the console to start the development server. This command compiles your code and serves the application locally, opening it in the browser.
npm run devThe below example shows a basic 3D Chart.
import { Chart3DComponent } from '@syncfusion/ej2-react-charts';
import * as React from "react";
import * as ReactDOM from "react-dom";
function App() {
    return <Chart3DComponent id='charts' />;
}
;
export default App;

const root = ReactDOM.createRoot(document.getElementById('charts'));
root.render(<App />);
import { Chart3DComponent } from '@syncfusion/ej2-react-charts';
import * as React from "react";
import * as ReactDOM from "react-dom";
function App() {
return <Chart3DComponent id='charts' />
};
export default App;
const root = ReactDOM.createRoot(document.getElementById('charts'));
root.render(<App />);Module injection
3D Chart components are segregated into individual feature-wise modules. In order to use a particular feature, you need to inject its feature service in the 3D Chart component. In the current application, we are going to modify the above basic 3D Chart to visualize sales data for a particular year. For this application we are going to use column series, tooltip, data label, category axis and legend feature of the 3D Chart. Please find relevant feature service name and description as follows.
-
ColumnSeries3D- Inject this module in toservicesto use column series. -
Legend3D- Inject this module in toservicesto use legend feature. -
Tooltip3D- Inject this module in toservicesto use tooltip feature. -
DataLabel3D- Inject this module in toservicesto use datalabel feature. -
Category3D- Inject this module in toservicesto use category feature.
Import the above-mentioned modules from the chart package and inject them into the services section of the 3D Chart component as follows.
import { Chart3DComponent, ColumnSeries3D, Legend3D, Tooltip3D, DataLabel3D, Category3D, Inject } from '@syncfusion/ej2-react-charts';
import * as React from "react";

function App() {
  return <Chart3DComponent id='charts'>
    <Inject services={[ColumnSeries3D, Legend3D, Tooltip3D, DataLabel3D, Category3D]}/>
  </Chart3DComponent>;
}
export default App;
import { Chart3DComponent, ColumnSeries3D, Legend3D, Tooltip3D, DataLabel3D, Category3D, Inject } from '@syncfusion/ej2-react-charts';
import * as React from "react";
function App() {
return <Chart3DComponent id='charts'>
<Inject services={[ColumnSeries3D, Legend3D, Tooltip3D, DataLabel3D, Category3D]}/>
</Chart3DComponent>;
}
export default App;Populate 3D Chart with data
This section explains how to plot the following JSON data to the 3D Chart.
export let data = [
    { x: 'Tesla', y: 137429 },
    { x: 'Aion', y: 80308 },
    { x: 'Wuling', y: 76418 },
    { x: 'Changan', y: 52849 },
    { x: 'Geely', y: 47234 },
    { x: 'Nio', y: 31041 },
    { x: 'Neta', y: 22449 },
    { x: 'BMW', y: 18733 }
];
export let data: Object[] = [
{ x: 'Tesla', y: 137429 },
{ x: 'Aion', y: 80308 },
{ x: 'Wuling', y: 76418 },
{ x: 'Changan', y: 52849 },
{ x: 'Geely', y: 47234 },
{ x: 'Nio', y: 31041 },
{ x: 'Neta', y: 22449 },
{ x: 'BMW', y: 18733 }
];Add series to the 3D Chart using the <Chart3DSeriesCollectionDirective> and <Chart3DSeriesDirective> components. Map the JSON fields x and y to the series xName and yName properties, and set the JSON array as the dataSource property.
Since the JSON contains category data, set the valueType for the horizontal axis (primaryXAxis) to Category. By default, the axis valueType is Numeric.
import { Chart3DComponent, Chart3DSeriesCollectionDirective, Chart3DSeriesDirective, Inject, Category3D, ColumnSeries3D } from '@syncfusion/ej2-react-charts';
import * as React from "react";
import * as ReactDOM from "react-dom";
export let data = [
{ x: 'Tesla', y: 137429 },
{ x: 'Aion', y: 80308 },
{ x: 'Wuling', y: 76418 },
{ x: 'Changan', y: 52849 },
{ x: 'Geely', y: 47234 },
{ x: 'Nio', y: 31041 },
{ x: 'Neta', y: 22449 },
{ x: 'BMW', y: 18733 }
];
function App() {
return (<Chart3DComponent id='charts' style= primaryXAxis=
wallColor='transparent'
primaryYAxis= enableRotation={true} rotation={7} tilt={10} depth={100}>
<Inject services={[ColumnSeries3D, Category3D]} />
<Chart3DSeriesCollectionDirective >
<Chart3DSeriesDirective dataSource={data} xName='x' yName='y' type='Column'>
</Chart3DSeriesDirective>
</Chart3DSeriesCollectionDirective>
</Chart3DComponent>)
}
;
export default App;
const root = ReactDOM.createRoot(document.getElementById('charts'));
root.render(<App />);import { Category3D, Chart3DComponent, Chart3DSeriesCollectionDirective, Chart3DSeriesDirective, ColumnSeries3D, Inject } from '@syncfusion/ej2-react-charts';
import * as React from "react";
import * as ReactDOM from "react-dom";
export let data: Object[] = [
    { x: 'Tesla', y: 137429 },
    { x: 'Aion', y: 80308 },
    { x: 'Wuling', y: 76418 },
    { x: 'Changan', y: 52849 },
    { x: 'Geely', y: 47234 },
    { x: 'Nio', y: 31041 },
    { x: 'Neta', y: 22449 },
    { x: 'BMW', y: 18733 }
];
function App() {
return (<Chart3DComponent id='charts' style= primaryXAxis=
wallColor='transparent'
primaryYAxis= enableRotation={true} rotation={7} tilt={10} depth={100}>
<Inject services={[ColumnSeries3D, Category3D]} />
<Chart3DSeriesCollectionDirective >
<Chart3DSeriesDirective dataSource={data} xName='x' yName='y' type='Column'>
</Chart3DSeriesDirective>
</Chart3DSeriesCollectionDirective>
</Chart3DComponent>)
};
export default App;
const root = ReactDOM.createRoot(document.getElementById('charts'));
root.render(<App />);Troubleshooting
Use the following guidance to resolve common issues when getting started with the 3D Chart component.
-
Chart does not render (blank page)
- Verify that
index.htmlcontains a container withid="root", and thatmain.tsx/main.jsxcallsReactDOM.createRoot(document.getElementById("root"))followed byroot.render(<App />). - Run
npm installagain to ensure all peer dependencies listed in the Dependencies section are installed.
- Verify that
-
Tooltip, legend, or data labels are not visible after enabling them
- The corresponding modules must be injected into the
servicesarray of theInjectcomponent as shown in the Module injection section. For example, tooltip will not appear withoutTooltip3D, and data labels will not render withoutDataLabel3D.
- The corresponding modules must be injected into the
-
Series data is not plotted or appears empty
- Confirm that the
dataSourcearray contains objects with the property names set inxNameandyName(case sensitive). - If the
xfield contains string categories, set thevalueTypeofprimaryXAxistoCategory; otherwise points will not be mapped correctly.
- Confirm that the
-
Build or dev server fails to start
- Confirm that you are using a supported Node.js version (Node 18 or later for the latest Vite templates).
- Delete
node_modulesandpackage-lock.json, then runnpm installagain.
See also
Explore the following related topics: