Stacked Column Chart in Angular Charts
28 Aug 202624 minutes to read
Stacked Column
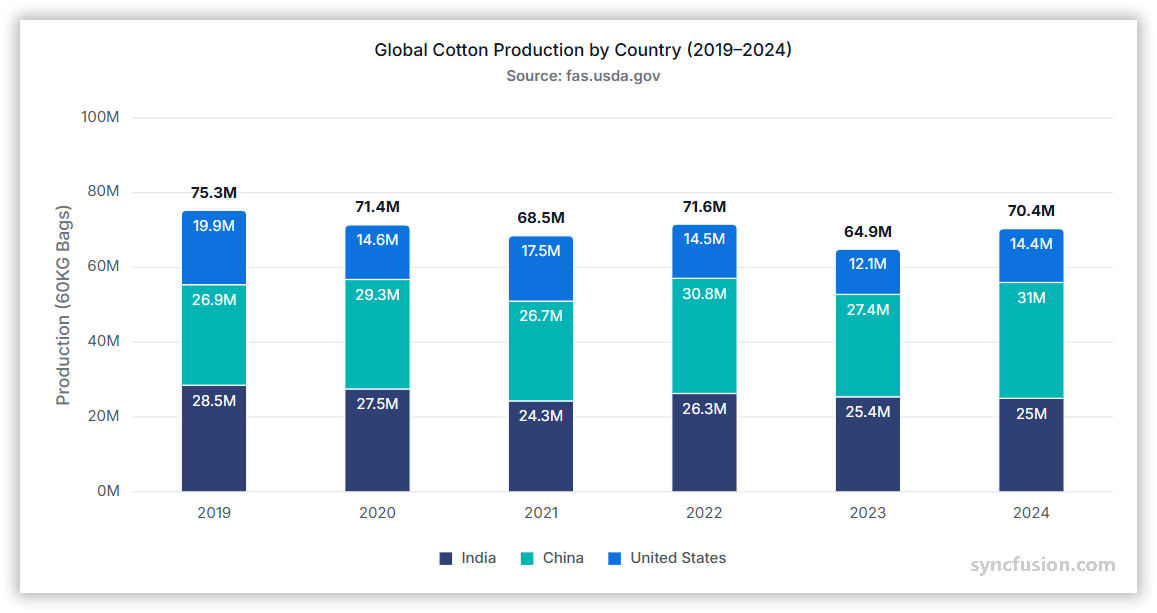
A stacked column chart displays vertical columns divided into segments that represent different series. It helps compare totals while showing the contribution of each series.
Configure a stacked column chart as follows:
-
Set the series type: Set the series
typetoStackingColumn. -
Register the required services: Import
ChartModule, and addStackingColumnSeriesServiceand the required axis services, such asCategoryService, to the component or NgModuleprovidersarray.
import { ChartModule } from '@syncfusion/ej2-angular-charts';
import { CategoryService, StackingColumnSeriesService } from '@syncfusion/ej2-angular-charts';


import { Component, OnInit } from '@angular/core';
import { stackedData } from './datasource';
@Component({
imports: [
         ChartModule
    ],

providers: [CategoryService, StackingColumnSeriesService],
standalone: true,
    selector: 'app-container',
    template: `<ejs-chart id="chart-container" [primaryXAxis]='primaryXAxis' [title]='title'>
        <e-series-collection>
            <e-series [dataSource]='chartData' type='StackingColumn' xName='x' yName='y' name='UK'></e-series>
            <e-series [dataSource]='chartData' type='StackingColumn' xName='x' yName='y1' name='Germany'></e-series>
            <e-series [dataSource]='chartData' type='StackingColumn' xName='x' yName='y2' name='France'></e-series>
            <e-series [dataSource]='chartData' type='StackingColumn' xName='x' yName='y3' name='Italy'></e-series>
        </e-series-collection>
    </ejs-chart>`
})
export class AppComponent implements OnInit {
    public primaryXAxis?: Object;
    public chartData?: Object[];
    public title?: string;
    ngOnInit(): void {
        this.chartData = stackedData;
        this.primaryXAxis = {
            title: 'Years',
            interval: 1,
            valueType: 'Category'
        };
        this.title = 'Mobile Game Market by Country';
    }

}
import { bootstrapApplication } from '@angular/platform-browser';
import { AppComponent } from './app.component';
bootstrapApplication(AppComponent).catch((err) => console.error(err));export let stackedData: Object[] = [
{ x: '2014', y: 111.1, y1: 76.9, y2: 66.1, y3: 34.1 },
{ x: '2015', y: 127.3, y1: 99.5, y2: 79.3, y3: 38.2 },
{ x: '2016', y: 143.4, y1: 121.7, y2: 91.3, y3: 44.0 },
{ x: '2017', y: 159.9, y1: 142.5, y2: 102.4, y3: 51.6 },
{ x: '2018', y: 175.4, y1: 166.7, y2: 112.9, y3: 61.9 },
{ x: '2019', y: 189.0, y1: 182.9, y2: 122.4, y3: 71.5 },
{ x: '2020', y: 202.7, y1: 197.3, y2: 120.9, y3: 82.0 }
];Binding data to a series
Bind an array of JSON objects or a DataManager instance to the series with the dataSource property. Map the category field with xName and map a value field for each series with yName.
import { ChartModule } from '@syncfusion/ej2-angular-charts';
import { CategoryService, StackingColumnSeriesService } from '@syncfusion/ej2-angular-charts';


import { Component, OnInit } from '@angular/core';
import { stackedData } from './datasource';
@Component({
imports: [
         ChartModule
    ],

providers: [CategoryService, StackingColumnSeriesService],
standalone: true,
    selector: 'app-container',
    template: `<ejs-chart id="chart-container" [primaryXAxis]='primaryXAxis' [title]='title'>
        <e-series-collection>
            <e-series [dataSource]='chartData' type='StackingColumn' xName='x' yName='y' name='UK'></e-series>
            <e-series [dataSource]='chartData' type='StackingColumn' xName='x' yName='y1' name='Germany'></e-series>
            <e-series [dataSource]='chartData' type='StackingColumn' xName='x' yName='y2' name='France'></e-series>
            <e-series [dataSource]='chartData' type='StackingColumn' xName='x' yName='y3' name='Italy'></e-series>
        </e-series-collection>
    </ejs-chart>`
})
export class AppComponent implements OnInit {
    public primaryXAxis?: Object;
    public chartData?: Object[];
    public title?: string;
    ngOnInit(): void {
        this.chartData = stackedData;
        this.primaryXAxis = {
            title: 'Years',
            interval: 1,
            valueType: 'Category'
        };
        this.title = 'Mobile Game Market by Country';
    }

}
import { bootstrapApplication } from '@angular/platform-browser';
import { AppComponent } from './app.component';
bootstrapApplication(AppComponent).catch((err) => console.error(err));export let stackedData: Object[] = [
{ x: '2014', y: 111.1, y1: 76.9, y2: 66.1, y3: 34.1 },
{ x: '2015', y: 127.3, y1: 99.5, y2: 79.3, y3: 38.2 },
{ x: '2016', y: 143.4, y1: 121.7, y2: 91.3, y3: 44.0 },
{ x: '2017', y: 159.9, y1: 142.5, y2: 102.4, y3: 51.6 },
{ x: '2018', y: 175.4, y1: 166.7, y2: 112.9, y3: 61.9 },
{ x: '2019', y: 189.0, y1: 182.9, y2: 122.4, y3: 71.5 },
{ x: '2020', y: 202.7, y1: 197.3, y2: 120.9, y3: 82.0 }
];Series customization
Use the following properties to customize a stacked column series.
Solid fill
Use the fill property to set a solid CSS color for a series.
import { ChartModule } from '@syncfusion/ej2-angular-charts';
import { CategoryService, StackingColumnSeriesService } from '@syncfusion/ej2-angular-charts';


import { Component, OnInit } from '@angular/core';
import { stackedData } from './datasource';
@Component({
imports: [
         ChartModule
    ],

providers: [CategoryService, StackingColumnSeriesService],
standalone: true,
    selector: 'app-container',
    template: `<ejs-chart id="chart-container" [primaryXAxis]='primaryXAxis' [title]='title'>
        <e-series-collection>
            <e-series [dataSource]='chartData' type='StackingColumn' xName='x' yName='y' name='UK' fill='#2F4F4F'></e-series>
            <e-series [dataSource]='chartData' type='StackingColumn' xName='x' yName='y1' name='Germany' fill='#556B2F'></e-series>
            <e-series [dataSource]='chartData' type='StackingColumn' xName='x' yName='y2' name='France' fill='#8B0000'></e-series>
            <e-series [dataSource]='chartData' type='StackingColumn' xName='x' yName='y3' name='Italy' fill='#8B0000'></e-series>
        </e-series-collection>
    </ejs-chart>`
})
export class AppComponent implements OnInit {
    public primaryXAxis?: Object;
    public border?: Object;
    public chartData?: Object[];
    public title?: string;
    ngOnInit(): void {
        this.chartData = stackedData;
        this.primaryXAxis = {
            title: 'Years',
            interval: 1,
            valueType: 'Category'
        };
        this.title = 'Mobile Game Market by Country';
    }

}
import { bootstrapApplication } from '@angular/platform-browser';
import { AppComponent } from './app.component';
bootstrapApplication(AppComponent).catch((err) => console.error(err));export let stackedData: Object[] = [
{ x: '2014', y: 111.1, y1: 76.9, y2: 66.1, y3: 34.1 },
{ x: '2015', y: 127.3, y1: 99.5, y2: 79.3, y3: 38.2 },
{ x: '2016', y: 143.4, y1: 121.7, y2: 91.3, y3: 44.0 },
{ x: '2017', y: 159.9, y1: 142.5, y2: 102.4, y3: 51.6 },
{ x: '2018', y: 175.4, y1: 166.7, y2: 112.9, y3: 61.9 },
{ x: '2019', y: 189.0, y1: 182.9, y2: 122.4, y3: 71.5 },
{ x: '2020', y: 202.7, y1: 197.3, y2: 120.9, y3: 82.0 }
];Gradient fill
The fill property can apply an SVG gradient to a stacked column series. Define each gradient in an SVG <defs> element with a unique ID, and assign it to the series in the url(#gradientId) format.
Place the SVG gradient definitions in the application’s index.html file, inside the <body> element and outside the <app-container> element.
<svg>
    <defs>
        <linearGradient id="gradient1">
            <stop offset="0%" style="stop-color:darkblue;stop-opacity:5" />
            <stop offset="50%" style="stop-color:dimgrey;stop-opacity:5" />
        </linearGradient>
    </defs>
</svg>
<svg>
    <defs>
        <linearGradient id="gradient2">
            <stop offset="0%" style="stop-color:darkred;stop-opacity:5" />
            <stop offset="50%" style="stop-color:darkorange;stop-opacity:5" />
        </linearGradient>
    </defs>
</svg>
<svg>
    <defs>
        <linearGradient id="gradient3">
            <stop offset="0%" style="stop-color:darkmagenta;stop-opacity:5" />
            <stop offset="50%" style="stop-color:darkcyan;stop-opacity:5" />
        </linearGradient>
    </defs>
</svg>
<svg>
    <defs>
        <linearGradient id="gradient4">
            <stop offset="0%" style="stop-color:darkviolet;stop-opacity:5" />
            <stop offset="50%" style="stop-color:darkgoldenrod;stop-opacity:5" />
        </linearGradient>
    </defs>
</svg>
Set the series fill values to url(#gradient1), url(#gradient2), url(#gradient3), and url(#gradient4), respectively.
import { ChartModule } from '@syncfusion/ej2-angular-charts';
import { CategoryService, StackingColumnSeriesService } from '@syncfusion/ej2-angular-charts';


import { Component, OnInit } from '@angular/core';
import { stackedData } from './datasource';
@Component({
imports: [
         ChartModule
    ],

providers: [CategoryService, StackingColumnSeriesService],
standalone: true,
    selector: 'app-container',
    template: `<ejs-chart id="chart-container" [primaryXAxis]='primaryXAxis' [title]='title'>
        <e-series-collection>
            <e-series [dataSource]='chartData' type='StackingColumn' xName='x' yName='y' name='UK' fill='url(#gradient1)'></e-series>
            <e-series [dataSource]='chartData' type='StackingColumn' xName='x' yName='y1' name='Germany' fill='url(#gradient2)'></e-series>
            <e-series [dataSource]='chartData' type='StackingColumn' xName='x' yName='y2' name='France' fill='url(#gradient3)'></e-series>
            <e-series [dataSource]='chartData' type='StackingColumn' xName='x' yName='y3' name='Italy' fill='url(#gradient4)'></e-series>
        </e-series-collection>
    </ejs-chart>`
})
export class AppComponent implements OnInit {
    public primaryXAxis?: Object;
    public border?: Object;
    public chartData?: Object[];
    public title?: string;
    ngOnInit(): void {
        this.chartData = stackedData;
        this.primaryXAxis = {
            title: 'Years',
            interval: 1,
            valueType: 'Category'
        };
        this.title = 'Mobile Game Market by Country';
    }

}
import { bootstrapApplication } from '@angular/platform-browser';
import { AppComponent } from './app.component';
bootstrapApplication(AppComponent).catch((err) => console.error(err));export let stackedData: Object[] = [
{ x: '2014', y: 111.1, y1: 76.9, y2: 66.1, y3: 34.1 },
{ x: '2015', y: 127.3, y1: 99.5, y2: 79.3, y3: 38.2 },
{ x: '2016', y: 143.4, y1: 121.7, y2: 91.3, y3: 44.0 },
{ x: '2017', y: 159.9, y1: 142.5, y2: 102.4, y3: 51.6 },
{ x: '2018', y: 175.4, y1: 166.7, y2: 112.9, y3: 61.9 },
{ x: '2019', y: 189.0, y1: 182.9, y2: 122.4, y3: 71.5 },
{ x: '2020', y: 202.7, y1: 197.3, y2: 120.9, y3: 82.0 }
];Opacity
Use the opacity property to control series transparency. Set a value from 0 for fully transparent to 1 for fully opaque.
import { ChartModule } from '@syncfusion/ej2-angular-charts';
import { CategoryService, StackingColumnSeriesService } from '@syncfusion/ej2-angular-charts';


import { Component, OnInit } from '@angular/core';
import { stackedData } from './datasource';
@Component({
imports: [
         ChartModule
    ],

providers: [CategoryService, StackingColumnSeriesService],
standalone: true,
    selector: 'app-container',
    template: `<ejs-chart id="chart-container" [primaryXAxis]='primaryXAxis' [title]='title'>
        <e-series-collection>
            <e-series [dataSource]='chartData' type='StackingColumn' xName='x' yName='y' name='UK' opacity='0.7'></e-series>
            <e-series [dataSource]='chartData' type='StackingColumn' xName='x' yName='y1' name='Germany' opacity='0.7'></e-series>
            <e-series [dataSource]='chartData' type='StackingColumn' xName='x' yName='y2' name='France' opacity='0.7'></e-series>
            <e-series [dataSource]='chartData' type='StackingColumn' xName='x' yName='y3' name='Italy' opacity='0.7'></e-series>
        </e-series-collection>
    </ejs-chart>`
})
export class AppComponent implements OnInit {
    public primaryXAxis?: Object;
    public chartData?: Object[];
    public title?: string;
    ngOnInit(): void {
        this.chartData = stackedData;
        this.primaryXAxis = {
            title: 'Years',
            interval: 1,
            valueType: 'Category'
        };
        this.title = 'Mobile Game Market by Country';
    }

}
import { bootstrapApplication } from '@angular/platform-browser';
import { AppComponent } from './app.component';
bootstrapApplication(AppComponent).catch((err) => console.error(err));export let stackedData: Object[] = [
{ x: '2014', y: 111.1, y1: 76.9, y2: 66.1, y3: 34.1 },
{ x: '2015', y: 127.3, y1: 99.5, y2: 79.3, y3: 38.2 },
{ x: '2016', y: 143.4, y1: 121.7, y2: 91.3, y3: 44.0 },
{ x: '2017', y: 159.9, y1: 142.5, y2: 102.4, y3: 51.6 },
{ x: '2018', y: 175.4, y1: 166.7, y2: 112.9, y3: 61.9 },
{ x: '2019', y: 189.0, y1: 182.9, y2: 122.4, y3: 71.5 },
{ x: '2020', y: 202.7, y1: 197.3, y2: 120.9, y3: 82.0 }
];Border
Use the border property to customize the color and width of the series border.
import { ChartModule } from '@syncfusion/ej2-angular-charts';
import { CategoryService, StackingColumnSeriesService } from '@syncfusion/ej2-angular-charts';


import { Component, OnInit } from '@angular/core';
import { stackedData } from './datasource';
@Component({
imports: [
         ChartModule
    ],

providers: [CategoryService, StackingColumnSeriesService],
standalone: true,
    selector: 'app-container',
    template: `<ejs-chart id="chart-container" [primaryXAxis]='primaryXAxis' [title]='title'>
        <e-series-collection>
            <e-series [dataSource]='chartData' type='StackingColumn' xName='x' yName='y' name='UK' [border]='border'></e-series>
            <e-series [dataSource]='chartData' type='StackingColumn' xName='x' yName='y1' name='Germany' [border]='border1'></e-series>
            <e-series [dataSource]='chartData' type='StackingColumn' xName='x' yName='y2' name='France' [border]='border2'></e-series>
            <e-series [dataSource]='chartData' type='StackingColumn' xName='x' yName='y3' name='Italy' [border]='border3'></e-series>
        </e-series-collection>
    </ejs-chart>`
})
export class AppComponent implements OnInit {
    public primaryXAxis?: Object;
    public chartData?: Object[];
    public title?: string;
    public border?: Object;
    public border1?: Object;
    public border2?: Object;
    public border3?: Object;
    ngOnInit(): void {
        this.chartData = stackedData;
        this.primaryXAxis = {
            title: 'Years',
            interval: 1,
            valueType: 'Category'
        };
        this.title = 'Mobile Game Market by Country';
        this.border = { width: 2, color: '#ff4251', dashArray: '2,5'};
        this.border1 = { width: 2, color: '#4C4C4C', dashArray: '2,5'};
        this.border2 = { width: 2, color: '#794F1B', dashArray: '2,5'};
        this.border3 = { width: 2, color: '#1a9a6f', dashArray: '2,5'};
    }

}
import { bootstrapApplication } from '@angular/platform-browser';
import { AppComponent } from './app.component';
bootstrapApplication(AppComponent).catch((err) => console.error(err));export let stackedData: Object[] = [
{ x: '2014', y: 111.1, y1: 76.9, y2: 66.1, y3: 34.1 },
{ x: '2015', y: 127.3, y1: 99.5, y2: 79.3, y3: 38.2 },
{ x: '2016', y: 143.4, y1: 121.7, y2: 91.3, y3: 44.0 },
{ x: '2017', y: 159.9, y1: 142.5, y2: 102.4, y3: 51.6 },
{ x: '2018', y: 175.4, y1: 166.7, y2: 112.9, y3: 61.9 },
{ x: '2019', y: 189.0, y1: 182.9, y2: 122.4, y3: 71.5 },
{ x: '2020', y: 202.7, y1: 197.3, y2: 120.9, y3: 82.0 }
];Stacking group
Use stackingGroup to organize stacked column and 100% stacked column series into separate stacks. Series with the same nonempty group name are stacked together; series with different group names form separate stacks.
import { ChartModule } from '@syncfusion/ej2-angular-charts';
import { CategoryService, StackingColumnSeriesService } from '@syncfusion/ej2-angular-charts';


import { Component, OnInit } from '@angular/core';
@Component({
imports: [
         ChartModule
    ],

providers: [CategoryService, StackingColumnSeriesService],
standalone: true,
    selector: 'app-container',
    template: `<ejs-chart style='display:block;' [primaryXAxis]='primaryXAxis' [primaryYAxis]='primaryYAxis'>
	    <e-series-collection>
	        <e-series stackingGroup="UKAndGermany" [dataSource]='data' type='StackingColumn' xName='x' yName='y' name='UK' width='2'> </e-series>
		    <e-series stackingGroup="UKAndGermany" [dataSource]='data1' type='StackingColumn' xName='x' yName='y' name='Germany' width='2'> </e-series>
		    <e-series stackingGroup="FranceAndItaly" [dataSource]='data2' type='StackingColumn' xName='x' yName='y' name='France' width='2'> </e-series>
		    <e-series stackingGroup="FranceAndItaly" [dataSource]='data3' type='StackingColumn' xName='x' yName='y' name='Italy' width='2'> </e-series>
	    </e-series-collection>
	</ejs-chart>`
})
export class AppComponent implements OnInit {
  public data?: Object[];
  public data1?: Object[];
  public data2?: Object[];
  public data3?: Object[];
  public primaryXAxis?: Object;
  public primaryYAxis?: Object;
    ngOnInit(): void {
        this.primaryXAxis = {
            majorGridLines: { width: 0 },
            minorGridLines: { width: 0 },
            majorTickLines: { width: 0 },
            minorTickLines: { width: 0 },
            interval: 1,
            lineStyle: { width: 0 },
            valueType: "Category"
        };
        this.primaryYAxis = {
            title: "Sales",
            lineStyle: { width: 0 },
            majorTickLines: { width: 0 },
            majorGridLines: { width: 1 },
            minorGridLines: { width: 1 },
            minorTickLines: { width: 0 },
            labelFormat: "{value}B"
        };
    this.data = [
    { x: "2014", y: 111.1 },
    { x: "2015", y: 127.3 },
    { x: "2016", y: 143.4 },
    { x: "2017", y: 159.9 }
  ];
  this.data1 = [
    { x: "2014", y: 76.9 },
    { x: "2015", y: 99.5 },
    { x: "2016", y: 121.7 },
    { x: "2017", y: 142.5 }
  ];
  this.data2 = [
    { x: "2014", y: 66.1 },
    { x: "2015", y: 79.3 },
    { x: "2016", y: 91.3 },
    { x: "2017", y: 102.4 }
  ];
  this.data3 = [
    { x: "2014", y: 34.1 },
    { x: "2015", y: 38.2 },
    { x: "2016", y: 44.0 },
    { x: "2017", y: 51.6 }
  ];
}

}
import { bootstrapApplication } from '@angular/platform-browser';
import { AppComponent } from './app.component';
bootstrapApplication(AppComponent).catch((err) => console.error(err));export let stackedData: Object[] = [
{ x: '2014', y: 111.1, y1: 76.9, y2: 66.1, y3: 34.1 },
{ x: '2015', y: 127.3, y1: 99.5, y2: 79.3, y3: 38.2 },
{ x: '2016', y: 143.4, y1: 121.7, y2: 91.3, y3: 44.0 },
{ x: '2017', y: 159.9, y1: 142.5, y2: 102.4, y3: 51.6 },
{ x: '2018', y: 175.4, y1: 166.7, y2: 112.9, y3: 61.9 },
{ x: '2019', y: 189.0, y1: 182.9, y2: 122.4, y3: 71.5 },
{ x: '2020', y: 202.7, y1: 197.3, y2: 120.9, y3: 82.0 }
];Cylindrical stacked column chart
Set the columnFacet property to Cylinder to render a stacked column series with a cylindrical shape. The default value is Rectangle.
import { ChartModule } from '@syncfusion/ej2-angular-charts';
import { CategoryService, StackingColumnSeriesService } from '@syncfusion/ej2-angular-charts';


import { Component, OnInit } from '@angular/core';
import { cylindricalData } from './datasource';
@Component({
imports: [
         ChartModule
    ],

providers: [CategoryService, StackingColumnSeriesService],
standalone: true,
    selector: 'app-container',
    template: `<ejs-chart id="chart-container" [primaryXAxis]='primaryXAxis' [primaryYAxis]='primaryYAxis' [title]='title'>
        <e-series-collection>
            <e-series [dataSource]='chartData' type='StackingColumn' columnFacet= 'Cylinder' xName='x' yName='y' name='UK'></e-series>
            <e-series [dataSource]='chartData' type='StackingColumn' columnFacet= 'Cylinder' xName='x' yName='y1' name='Germany'></e-series>
            <e-series [dataSource]='chartData' type='StackingColumn' columnFacet= 'Cylinder' xName='x' yName='y2' name='France'></e-series>
            <e-series [dataSource]='chartData' type='StackingColumn' columnFacet= 'Cylinder' xName='x' yName='y3' name='Italy'></e-series>
        </e-series-collection>
    </ejs-chart>`
})
export class AppComponent implements OnInit {
    public primaryXAxis?: Object;
    public primaryYAxis?: Object;
    public chartData?: Object[];
    public title?: string;
    ngOnInit(): void {
        this.chartData = cylindricalData;
        this.primaryXAxis = {
            title: 'Years',
            interval: 1,
            valueType: 'Category'
        };
        this.primaryYAxis = {
            title: 'Sales in Billions',
            minimum: 0,
            maximum: 700,
            interval: 100,
            labelFormat: '{value}B',
        };
        this.title = 'Mobile Game Market by Country';
    }

}
import { bootstrapApplication } from '@angular/platform-browser';
import { AppComponent } from './app.component';
bootstrapApplication(AppComponent).catch((err) => console.error(err));export let cylindricalData: Object[] = [
{ x: '2014', y: 111.1, y1: 76.9, y2: 66.1, y3: 34.1 },
{ x: '2015', y: 127.3, y1: 99.5, y2: 79.3, y3: 38.2 },
{ x: '2016', y: 143.4, y1: 121.7, y2: 91.3, y3: 44.0 },
{ x: '2017', y: 159.9, y1: 142.5, y2: 102.4, y3: 51.6 },
{ x: '2018', y: 175.4, y1: 166.7, y2: 112.9, y3: 61.9 },
{ x: '2019', y: 189.0, y1: 182.9, y2: 122.4, y3: 71.5 },
{ x: '2020', y: 202.7, y1: 197.3, y2: 120.9, y3: 82.0 }
];Empty points
A data point whose mapped value is null or undefined is considered empty. Configure empty-point behavior with emptyPointSettings.mode. The default mode is Gap; use another supported mode when the chart must display a replacement value instead of a gap.
Mode
Use mode to control how the series handles an empty point. The supported modes are:
-
Gap: Leaves a gap at the empty point. This is the default mode. -
Zero: Replaces the missing value with zero. -
Average: Replaces the missing value with an average derived from neighboring points. -
Drop: Omits the empty point from rendering.
import { ChartModule } from '@syncfusion/ej2-angular-charts';
import { CategoryService, StackingColumnSeriesService } from '@syncfusion/ej2-angular-charts';


import { Component, OnInit } from '@angular/core';
import { stackedData } from './datasource';
@Component({
imports: [
         ChartModule
    ],

providers: [CategoryService, StackingColumnSeriesService],
standalone: true,
    selector: 'app-container',
    template: `<ejs-chart id="chart-container" [primaryXAxis]='primaryXAxis' [title]='title'>
        <e-series-collection>
            <e-series [dataSource]='chartData' type='StackingColumn' xName='x' yName='y' name='UK' [emptyPointSettings]='emptyPointSettings'></e-series>
            <e-series [dataSource]='chartData' type='StackingColumn' xName='x' yName='y1' name='Germany'></e-series>
            <e-series [dataSource]='chartData' type='StackingColumn' xName='x' yName='y2' name='France' [emptyPointSettings]='emptyPointSettings1'></e-series>
            <e-series [dataSource]='chartData' type='StackingColumn' xName='x' yName='y3' name='Italy'></e-series>
        </e-series-collection>
    </ejs-chart>`
})
export class AppComponent implements OnInit {
    public primaryXAxis?: Object;
    public chartData?: Object[];
    public title?: string;
    public emptyPointSettings?: Object;
    public emptyPointSettings1?: Object;
    ngOnInit(): void {
        this.chartData = stackedData;
        this.primaryXAxis = {
            title: 'Years',
            interval: 1,
            valueType: 'Category'
        };
        this.title = 'Mobile Game Market by Country';
        this.emptyPointSettings = { mode: 'Zero' };
        this.emptyPointSettings1 = { mode: 'Average' };
    }

}
import { bootstrapApplication } from '@angular/platform-browser';
import { AppComponent } from './app.component';
bootstrapApplication(AppComponent).catch((err) => console.error(err));export let stackedData: Object[] = [
{ x: new Date(2006, 0, 1), y: 900, y1: 190, y2: 250, y3: 150 },
{ x: new Date(2007, 0, 1), y: 544, y1: 226, y2: 145, y3: 120 },
{ x: new Date(2008, 0, 1), y: null, y1: 194, y2: 190, y3: 115 },
{ x: new Date(2009, 0, 1), y: 675, y1: 250, y2: 220, y3: 125 },
{ x: new Date(2010, 0, 1), y: 765, y1: 222, y2: 225, y3: 132 },
{ x: new Date(2011, 0, 1), y: 679, y1: 181, y2: null, y3: 137 },
{ x: new Date(2012, 0, 1), y: 770, y1: 128, y2: 152, y3: 110 }
];Empty-point fill
Use emptyPointSettings.fill to set the fill color of an empty point when the selected mode renders a replacement point. It has no visible effect when the empty point is rendered as a gap.
import { ChartModule } from '@syncfusion/ej2-angular-charts';
import { CategoryService, StackingColumnSeriesService } from '@syncfusion/ej2-angular-charts';


import { Component, OnInit } from '@angular/core';
import { stackedData } from './datasource';
@Component({
imports: [
         ChartModule
    ],

providers: [CategoryService, StackingColumnSeriesService],
standalone: true,
    selector: 'app-container',
    template: `<ejs-chart id="chart-container" [primaryXAxis]='primaryXAxis' [title]='title'>
        <e-series-collection>
            <e-series [dataSource]='chartData' type='StackingColumn' xName='x' yName='y' name='UK' [emptyPointSettings]='emptyPointSettings'></e-series>
            <e-series [dataSource]='chartData' type='StackingColumn' xName='x' yName='y1' name='Germany'></e-series>
            <e-series [dataSource]='chartData' type='StackingColumn' xName='x' yName='y2' name='France' [emptyPointSettings]='emptyPointSettings1'></e-series>
            <e-series [dataSource]='chartData' type='StackingColumn' xName='x' yName='y3' name='Italy'></e-series>
        </e-series-collection>
    </ejs-chart>`
})
export class AppComponent implements OnInit {
    public primaryXAxis?: Object;
    public chartData?: Object[];
    public title?: string;
    public emptyPointSettings?: Object;
    public emptyPointSettings1?: Object;
    ngOnInit(): void {
        this.chartData = stackedData;
        this.primaryXAxis = {
            title: 'Years',
            interval: 1,
            valueType: 'Category'
        };
        this.title = 'Mobile Game Market by Country';
        this.emptyPointSettings = { mode: 'Zero' };
        this.emptyPointSettings1 = { mode: 'Average', fill: 'red' };
    }

}
import { bootstrapApplication } from '@angular/platform-browser';
import { AppComponent } from './app.component';
bootstrapApplication(AppComponent).catch((err) => console.error(err));export let stackedData: Object[] = [
{ x: new Date(2006, 0, 1), y: 900, y1: 190, y2: 250, y3: 150 },
{ x: new Date(2007, 0, 1), y: 544, y1: 226, y2: 145, y3: 120 },
{ x: new Date(2008, 0, 1), y: null, y1: 194, y2: 190, y3: 115 },
{ x: new Date(2009, 0, 1), y: 675, y1: 250, y2: 220, y3: 125 },
{ x: new Date(2010, 0, 1), y: 765, y1: 222, y2: 225, y3: 132 },
{ x: new Date(2011, 0, 1), y: 679, y1: 181, y2: null, y3: 137 },
{ x: new Date(2012, 0, 1), y: 770, y1: 128, y2: 152, y3: 110 }
];Empty-point border
Use emptyPointSettings.border to set the width and color of an empty point’s border when the selected mode renders a replacement point.
import { ChartModule } from '@syncfusion/ej2-angular-charts';
import { CategoryService, StackingColumnSeriesService } from '@syncfusion/ej2-angular-charts';


import { Component, OnInit } from '@angular/core';
import { stackedData } from './datasource';
@Component({
imports: [
         ChartModule
    ],

providers: [CategoryService, StackingColumnSeriesService],
standalone: true,
    selector: 'app-container',
    template: `<ejs-chart id="chart-container" [primaryXAxis]='primaryXAxis' [title]='title'>
        <e-series-collection>
            <e-series [dataSource]='chartData' type='StackingColumn' xName='x' yName='y' name='UK' [emptyPointSettings]='emptyPointSettings'></e-series>
            <e-series [dataSource]='chartData' type='StackingColumn' xName='x' yName='y1' name='Germany'></e-series>
            <e-series [dataSource]='chartData' type='StackingColumn' xName='x' yName='y2' name='France' [emptyPointSettings]='emptyPointSettings1'></e-series>
            <e-series [dataSource]='chartData' type='StackingColumn' xName='x' yName='y3' name='Italy'></e-series>
        </e-series-collection>
    </ejs-chart>`
})
export class AppComponent implements OnInit {
    public primaryXAxis?: Object;
    public chartData?: Object[];
    public title?: string;
    public emptyPointSettings?: Object;
    public emptyPointSettings1?: Object;
    ngOnInit(): void {
        this.chartData = stackedData;
        this.primaryXAxis = {
            title: 'Years',
            interval: 1,
            valueType: 'Category'
        };
        this.title = 'Mobile Game Market by Country';
        this.emptyPointSettings = { mode: 'Zero' };
        this.emptyPointSettings1 = { mode: 'Average', fill: 'red', border: { width: 2, color: 'green' } };
    }

}
import { bootstrapApplication } from '@angular/platform-browser';
import { AppComponent } from './app.component';
bootstrapApplication(AppComponent).catch((err) => console.error(err));export let stackedData: Object[] = [
{ x: new Date(2006, 0, 1), y: 900, y1: 190, y2: 250, y3: 150 },
{ x: new Date(2007, 0, 1), y: 544, y1: 226, y2: 145, y3: 120 },
{ x: new Date(2008, 0, 1), y: null, y1: 194, y2: 190, y3: 115 },
{ x: new Date(2009, 0, 1), y: 675, y1: 250, y2: 220, y3: 125 },
{ x: new Date(2010, 0, 1), y: 765, y1: 222, y2: 225, y3: 132 },
{ x: new Date(2011, 0, 1), y: 679, y1: 181, y2: null, y3: 137 },
{ x: new Date(2012, 0, 1), y: 770, y1: 128, y2: 152, y3: 110 }
];Stack labels
Stack labels display the total value for each stack. Enable them by setting stackLabelSettings.visible to true in the chart configuration. For negative stacks, the label is positioned relative to the negative stack.
import { ChartModule } from '@syncfusion/ej2-angular-charts';
import { CategoryService, StackingColumnSeriesService, DataLabelService } from '@syncfusion/ej2-angular-charts';


import { Component, OnInit } from '@angular/core';
import { stackedData } from './datasource';
@Component({
imports: [
         ChartModule
    ],

providers: [CategoryService, StackingColumnSeriesService, DataLabelService],
standalone: true,
    selector: 'app-container',
    template: `<ejs-chart id="chart-container" [primaryXAxis]='primaryXAxis' [title]='title' [stackLabels]='stackLabels'>
        <e-series-collection>
            <e-series [dataSource]='chartData' type='StackingColumn' xName='x' yName='y' name='UK' [marker]='marker'></e-series>
            <e-series [dataSource]='chartData' type='StackingColumn' xName='x' yName='y1' name='Germany' [marker]='marker'></e-series>
            <e-series [dataSource]='chartData' type='StackingColumn' xName='x' yName='y2' name='France' [marker]='marker'></e-series>
            <e-series [dataSource]='chartData' type='StackingColumn' xName='x' yName='y3' name='Italy' [marker]='marker'></e-series>
        </e-series-collection>
    </ejs-chart>`
})
export class AppComponent implements OnInit {
    public primaryXAxis?: Object;
    public chartData?: Object[];
    public title?: string;
    public marker?: Object;
    public stackLabels?:Object;
    ngOnInit(): void {
        this.chartData = stackedData;
        this.primaryXAxis = {
            title: 'Years',
            interval: 1,
            valueType: 'Category'
        };
        this.marker = { dataLabel: { visible: true } };
        this.stackLabels = { visible: true };
        this.title = 'Mobile Game Market by Country';
    }

}
import { bootstrapApplication } from '@angular/platform-browser';
import { AppComponent } from './app.component';
bootstrapApplication(AppComponent).catch((err) => console.error(err));export let stackedData: Object[] = [
{ x: '2014', y: 111.1, y1: 76.9, y2: 66.1, y3: 34.1 },
{ x: '2015', y: 127.3, y1: 99.5, y2: 79.3, y3: 38.2 },
{ x: '2016', y: 143.4, y1: 121.7, y2: 91.3, y3: 44.0 },
{ x: '2017', y: 159.9, y1: 142.5, y2: 102.4, y3: 51.6 },
{ x: '2018', y: 175.4, y1: 166.7, y2: 112.9, y3: 61.9 },
{ x: '2019', y: 189.0, y1: 182.9, y2: 122.4, y3: 71.5 },
{ x: '2020', y: 202.7, y1: 197.3, y2: 120.9, y3: 82.0 }
];Stack label customization
Use the following stackLabelSettings properties to customize stack labels:
-
visible: Displays stack labels when set totrue. The default isfalse. -
fill: Sets the label background using a valid CSS color. The default istransparent. -
format: Formats label text and supports placeholders such as{value}for the total stack value. The default isnull. -
angle: Sets the rotation angle in degrees. The default is0. -
rx: Sets the horizontal corner radius of the label background. The default is5. -
ry: Sets the vertical corner radius of the label background. The default is5. -
margin: Sets the spacing around the label. -
border: Sets the label border. Configure its width and color for rounded corners to be visible. -
font: Customizes the label text size, color, style, weight, and family.
import { ChartModule } from '@syncfusion/ej2-angular-charts';
import { CategoryService, StackingColumnSeriesService, DataLabelService } from '@syncfusion/ej2-angular-charts';


import { Component, OnInit } from '@angular/core';
import { stackedData } from './datasource';
@Component({
imports: [
         ChartModule
    ],

providers: [CategoryService, StackingColumnSeriesService, DataLabelService],
standalone: true,
    selector: 'app-container',
    template: `<ejs-chart id="chart-container" [primaryXAxis]='primaryXAxis' [title]='title' [stackLabels]='stackLabels'>
        <e-series-collection>
            <e-series [dataSource]='chartData' type='StackingColumn' xName='x' yName='y' name='UK' [marker]='marker'></e-series>
            <e-series [dataSource]='chartData' type='StackingColumn' xName='x' yName='y1' name='Germany' [marker]='marker'></e-series>
            <e-series [dataSource]='chartData' type='StackingColumn' xName='x' yName='y2' name='France' [marker]='marker'></e-series>
            <e-series [dataSource]='chartData' type='StackingColumn' xName='x' yName='y3' name='Italy' [marker]='marker'></e-series>
        </e-series-collection>
    </ejs-chart>`
})
export class AppComponent implements OnInit {
    public primaryXAxis?: Object;
    public chartData?: Object[];
    public title?: string;
    public marker?: Object;
    public stackLabels?:Object;
    ngOnInit(): void {
        this.chartData = stackedData;
        this.primaryXAxis = {
            title: 'Years',
            interval: 1,
            valueType: 'Category'
        };
        this.marker = { dataLabel: { visible: true } };
        this.stackLabels = { visible: true, fill: 'rgba(0, 123, 255, 0.5)', format: '{value}', angle: 45, rx: 10, ry: 10, margin: { left: 10, right: 10, top: 10, bottom: 10 }, border: { width: 2, color: '#000' }, font: { size: '14px', color: '#fff', weight: 'bold', family: 'Arial', textAlignment: 'Left' } };
        this.title = 'Mobile Game Market by Country';
    }

}
import { bootstrapApplication } from '@angular/platform-browser';
import { AppComponent } from './app.component';
bootstrapApplication(AppComponent).catch((err) => console.error(err));export let stackedData: Object[] = [
{ x: '2014', y: 111.1, y1: 76.9, y2: 66.1, y3: 34.1 },
{ x: '2015', y: 127.3, y1: 99.5, y2: 79.3, y3: 38.2 },
{ x: '2016', y: 143.4, y1: 121.7, y2: 91.3, y3: 44.0 },
{ x: '2017', y: 159.9, y1: 142.5, y2: 102.4, y3: 51.6 },
{ x: '2018', y: 175.4, y1: 166.7, y2: 112.9, y3: 61.9 },
{ x: '2019', y: 189.0, y1: 182.9, y2: 122.4, y3: 71.5 },
{ x: '2020', y: 202.7, y1: 197.3, y2: 120.9, y3: 82.0 }
];Corner radius
Series corner radius
Use cornerRadius to round the corners of all points in the stacked column series. Configure individual corners with topLeft, topRight, bottomLeft, and bottomRight.
import { ChartModule } from '@syncfusion/ej2-angular-charts';
import { IPointRenderEventArgs } from '@syncfusion/ej2-charts';
import { CategoryService, StackingColumnSeriesService } from '@syncfusion/ej2-angular-charts';


import { Component, OnInit } from '@angular/core';
import { stackedData } from './datasource';
@Component({
imports: [
         ChartModule
    ],

providers: [CategoryService, StackingColumnSeriesService],
standalone: true,
    selector: 'app-container',
    template: `<ejs-chart id="chart-container" (pointRender)='pointRender($event)' [primaryXAxis]='primaryXAxis' [title]='title'>
        <e-series-collection>
            <e-series [dataSource]='chartData' type='StackingColumn' xName='x' yName='y' name='UK' [cornerRadius]='cornerRadius'></e-series>
            <e-series [dataSource]='chartData' type='StackingColumn' xName='x' yName='y1' name='Germany'></e-series>
            <e-series [dataSource]='chartData' type='StackingColumn' xName='x' yName='y2' name='France'></e-series>
            <e-series [dataSource]='chartData' type='StackingColumn' xName='x' yName='y3' name='Italy' [cornerRadius]='cornerRadius'></e-series>
        </e-series-collection>
    </ejs-chart>`
})
export class AppComponent implements OnInit {
    public primaryXAxis?: Object;
    public chartData?: Object[];
    public title?: string;
    public cornerRadius?: Object;
    ngOnInit(): void {
        this.chartData = stackedData;
        this.primaryXAxis = {
            title: 'Years',
            interval: 1,
            valueType: 'Category'
        };
        this.cornerRadius = {topRight: 10 , topLeft: 10};
        this.title = 'Mobile Game Market by Country';
    }
    public pointRender(args: IPointRenderEventArgs) {
            args.fill = '#009cb8';
    }
}
import { bootstrapApplication } from '@angular/platform-browser';
import { AppComponent } from './app.component';
bootstrapApplication(AppComponent).catch((err) => console.error(err));export let stackedData: Object[] = [
{ x: '2014', y: -111.1, y1: 76.9, y2: 66.1, y3: 34.1 },
{ x: '2015', y: -127.3, y1: 99.5, y2: 79.3, y3: 38.2 },
{ x: '2016', y: -143.4, y1: 121.7, y2: 91.3, y3: 44.0 },
{ x: '2017', y: -159.9, y1: 142.5, y2: 102.4, y3: 51.6 },
{ x: '2018', y: -175.4, y1: 166.7, y2: 112.9, y3: 61.9 },
{ x: '2019', y: -189.0, y1: 182.9, y2: 122.4, y3: 71.5 },
{ x: '2020', y: -202.7, y1: 197.3, y2: 120.9, y3: 82.0 }
];Point corner radius
Handle the pointRender event and set the event argument’s cornerRadius property to customize an individual point before it is rendered.
import { ChartModule } from '@syncfusion/ej2-angular-charts';
import { IPointRenderEventArgs } from '@syncfusion/ej2-charts';
import { CategoryService, StackingColumnSeriesService } from '@syncfusion/ej2-angular-charts';


import { Component, OnInit } from '@angular/core';
import { stackedData } from './datasource';
@Component({
imports: [
         ChartModule
    ],

providers: [CategoryService, StackingColumnSeriesService],
standalone: true,
    selector: 'app-container',
    template: `<ejs-chart id="chart-container" (pointRender)='pointRender($event)' [primaryXAxis]='primaryXAxis' [title]='title'>
        <e-series-collection>
            <e-series [dataSource]='chartData' type='StackingColumn' xName='x' yName='y' name='UK'></e-series>
            <e-series [dataSource]='chartData' type='StackingColumn' xName='x' yName='y1' name='Germany'></e-series>
            <e-series [dataSource]='chartData' type='StackingColumn' xName='x' yName='y2' name='France'></e-series>
            <e-series [dataSource]='chartData' type='StackingColumn' xName='x' yName='y3' name='Italy'></e-series>
        </e-series-collection>
    </ejs-chart>`
})
export class AppComponent implements OnInit {
    public primaryXAxis?: Object;
    public chartData?: Object[];
    public title?: string;
    ngOnInit(): void {
        this.chartData = stackedData;
        this.primaryXAxis = {
            title: 'Years',
            interval: 1,
            valueType: 'Category'
        };
        this.title = 'Mobile Game Market by Country';
    }
    public pointRender(args: IPointRenderEventArgs) {
        if (args.point.index === 0 && args.point.series.index === 3) {
            args.cornerRadius = { topLeft: 10, bottomLeft: 0, topRight: 10, bottomRight: 0 };
        }
        if (args.point.index === 3 && args.point.series.index === 3) {
            args.cornerRadius = { topLeft: 10, bottomLeft: 0, topRight: 10, bottomRight: 0 };
        }
        if (args.point.index === 4 && args.point.series.index === 3) {
            args.cornerRadius = { topLeft: 10, bottomLeft: 0, topRight: 10, bottomRight: 0 };
        }
        if (args.point.index === 6 && args.point.series.index === 3) {
            args.cornerRadius = { topLeft: 10, bottomLeft: 0, topRight: 10, bottomRight: 0 };
        }
    }
}
import { bootstrapApplication } from '@angular/platform-browser';
import { AppComponent } from './app.component';
bootstrapApplication(AppComponent).catch((err) => console.error(err));export let stackedData: Object[] = [
{ x: '2014', y: 111.1, y1: 76.9, y2: 66.1, y3: 34.1 },
{ x: '2015', y: 127.3, y1: 99.5, y2: 79.3, y3: 38.2 },
{ x: '2016', y: 143.4, y1: 121.7, y2: 91.3, y3: 44.0 },
{ x: '2017', y: 159.9, y1: 142.5, y2: 102.4, y3: 51.6 },
{ x: '2018', y: 175.4, y1: 166.7, y2: 112.9, y3: 61.9 },
{ x: '2019', y: 189.0, y1: 182.9, y2: 122.4, y3: 71.5 },
{ x: '2020', y: 202.7, y1: 197.3, y2: 120.9, y3: 82.0 }
];Events
Series render
The seriesRender event runs before a series is rendered. Use its event arguments to customize supported series properties such as data, fill, and name.
import { ChartModule } from '@syncfusion/ej2-angular-charts';
import { ISeriesRenderEventArgs } from '@syncfusion/ej2-charts';
import { CategoryService, StackingColumnSeriesService } from '@syncfusion/ej2-angular-charts';


import { Component, OnInit } from '@angular/core';
import { stackedData } from './datasource';
@Component({
imports: [
         ChartModule
    ],

providers: [CategoryService, StackingColumnSeriesService],
standalone: true,
    selector: 'app-container',
    template: `<ejs-chart id="chart-container" (seriesRender)='seriesRender($event)' [primaryXAxis]='primaryXAxis' [title]='title'>
        <e-series-collection>
            <e-series [dataSource]='chartData' type='StackingColumn' xName='x' yName='y' name='UK'></e-series>
            <e-series [dataSource]='chartData' type='StackingColumn' xName='x' yName='y1' name='Germany'></e-series>
            <e-series [dataSource]='chartData' type='StackingColumn' xName='x' yName='y2' name='France'></e-series>
            <e-series [dataSource]='chartData' type='StackingColumn' xName='x' yName='y3' name='Italy'></e-series>
        </e-series-collection>
    </ejs-chart>`
})
export class AppComponent implements OnInit {
    public primaryXAxis?: Object;
    public chartData?: Object[];
    public title?: string;
    ngOnInit(): void {
        this.chartData = stackedData;
        this.primaryXAxis = {
            title: 'Years',
            interval: 1,
            valueType: 'Category'
        };
        this.title = 'Mobile Game Market by Country';
    }
    public seriesRender(args: ISeriesRenderEventArgs) {
        if (args.series.index === 0) {
            args.fill = '#ff4251';
        }
        else if (args.series.index === 1) {
            args.fill = '#4C4C4C';
        }
        else if (args.series.index === 2) {
            args.fill = '#794F1B';
        }
        else if (args.series.index === 3) {
            args.fill = '#1a9a6f';
        }
    }
}
import { bootstrapApplication } from '@angular/platform-browser';
import { AppComponent } from './app.component';
bootstrapApplication(AppComponent).catch((err) => console.error(err));export let stackedData: Object[] = [
{ x: '2014', y: 111.1, y1: 76.9, y2: 66.1, y3: 34.1 },
{ x: '2015', y: 127.3, y1: 99.5, y2: 79.3, y3: 38.2 },
{ x: '2016', y: 143.4, y1: 121.7, y2: 91.3, y3: 44.0 },
{ x: '2017', y: 159.9, y1: 142.5, y2: 102.4, y3: 51.6 },
{ x: '2018', y: 175.4, y1: 166.7, y2: 112.9, y3: 61.9 },
{ x: '2019', y: 189.0, y1: 182.9, y2: 122.4, y3: 71.5 },
{ x: '2020', y: 202.7, y1: 197.3, y2: 120.9, y3: 82.0 }
];Point render
The pointRender event runs before each point is rendered. Use its event arguments to customize supported point properties. See Point corner radius for a per-point styling example.
import { ChartModule } from '@syncfusion/ej2-angular-charts';
import { IPointRenderEventArgs } from '@syncfusion/ej2-charts';
import { CategoryService, StackingColumnSeriesService } from '@syncfusion/ej2-angular-charts';


import { Component, OnInit } from '@angular/core';
import { stackedData } from './datasource';
@Component({
imports: [
         ChartModule
    ],

providers: [CategoryService, StackingColumnSeriesService],
standalone: true,
    selector: 'app-container',
    template: `<ejs-chart id="chart-container" (pointRender)='pointRender($event)' [primaryXAxis]='primaryXAxis' [title]='title'>
        <e-series-collection>
            <e-series [dataSource]='chartData' type='StackingColumn' xName='x' yName='y' name='UK'></e-series>
            <e-series [dataSource]='chartData' type='StackingColumn' xName='x' yName='y1' name='Germany'></e-series>
            <e-series [dataSource]='chartData' type='StackingColumn' xName='x' yName='y2' name='France'></e-series>
            <e-series [dataSource]='chartData' type='StackingColumn' xName='x' yName='y3' name='Italy'></e-series>
        </e-series-collection>
    </ejs-chart>`
})
export class AppComponent implements OnInit {
    public primaryXAxis?: Object;
    public chartData?: Object[];
    public title?: string;
    ngOnInit(): void {
        this.chartData = stackedData;
        this.primaryXAxis = {
            title: 'Years',
            interval: 1,
            valueType: 'Category'
        };
        this.title = 'Mobile Game Market by Country';
    }
    public pointRender(args: IPointRenderEventArgs) {
            args.fill = '#009cb8';
    }
}
import { bootstrapApplication } from '@angular/platform-browser';
import { AppComponent } from './app.component';
bootstrapApplication(AppComponent).catch((err) => console.error(err));export let stackedData: Object[] = [
{ x: '2014', y: 111.1, y1: 76.9, y2: 66.1, y3: 34.1 },
{ x: '2015', y: 127.3, y1: 99.5, y2: 79.3, y3: 38.2 },
{ x: '2016', y: 143.4, y1: 121.7, y2: 91.3, y3: 44.0 },
{ x: '2017', y: 159.9, y1: 142.5, y2: 102.4, y3: 51.6 },
{ x: '2018', y: 175.4, y1: 166.7, y2: 112.9, y3: 61.9 },
{ x: '2019', y: 189.0, y1: 182.9, y2: 122.4, y3: 71.5 },
{ x: '2020', y: 202.7, y1: 197.3, y2: 120.9, y3: 82.0 }
];Troubleshooting
-
No columns are displayed: Confirm that
StackingColumnSeriesServiceand the required axis services are registered, the series type isStackingColumn, and thexNameandyNamefields exist in the data source. -
Series do not stack together: Confirm that the series use the same chart type, compatible category values, and the same
stackingGroupwhen grouping is configured. -
A point is missing: Check whether its mapped value is
nullorundefined, and reviewemptyPointSettings.mode. -
A gradient is not displayed: Confirm that the SVG gradient ID exists in
index.htmland exactly matches the ID referenced by the seriesfillvalue.