Getting Started with the Vue Maps Component in Vue 2
21 May 20269 minutes to read
This article provides a step-by-step guide for setting up a Vue 2 project using Vue-CLI and integrating the Syncfusion® Vue Maps component. By the end of this guide, you’ll have a working Maps component displaying geographic data with features like legends, tooltips, and data labels.
Note: If you’re using Vue 3, refer to the Vue 3 Getting Started guide.
You can explore the Maps component’s capabilities using the following video:
Prerequisites
Ensure that the development environment meets the required criteria listed in System requirements for Syncfusion® Vue UI components.
Dependencies
Below is the list of minimum dependencies required to use the Maps.
|-- @syncfusion/ej2-vue-maps
    |-- @syncfusion/ej2-base
    |-- @syncfusion/ej2-data
    |-- @syncfusion/ej2-buttons
    |-- @syncfusion/ej2-splitbuttons
    |-- @syncfusion/ej2-vue-base
    |-- @syncfusion/ej2-svg-base
    |-- @syncfusion/ej2-maps
Setting Up the Vue 2 Project
To generate a Vue 2 project using Vue-CLI, use the vue create command. You can install Vue CLI using either npm or Yarn:
npm
npm install -g @vue/cli
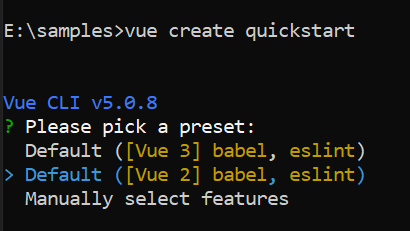
vue create quickstart
cd quickstart
npm run serveyarn
yarn global add @vue/cli
vue create quickstart
cd quickstart
yarn run serve
When creating a new project, choose the option Default ([Vue 2] babel, eslint) from the menu.
Once the quickstart project is set up with default settings, proceed to add Syncfusion® components to the project.
Add Syncfusion® Vue Packages
Syncfusion® packages are available at npmjs.com. To use Vue components, install the required npm package.
This article uses the Vue Maps component as an example. Install the @syncfusion/ej2-vue-maps package by using either npm or Yarn:
npm
npm install @syncfusion/ej2-vue-mapsyarn
yarn add @syncfusion/ej2-vue-mapsNote: npm v5+ saves packages to
dependenciesby default;--saveis not required.
Adding Syncfusion® Vue Maps Component
Note: Before adding the Maps component, make sure the map shape data is available in your project.
- In this example, the shape data is imported from a local
world-map.jsfile placed in thesrcfolder. - You can either use local GeoJSON data or load shape data from an external source.
Step 1: Import and register the Maps component in the script section of the src/App.vue file.
<script>
import { MapsComponent, LayerDirective, LayersDirective } from '@syncfusion/ej2-vue-maps';
import { world_map } from './world-map.js';

export default {
    components: {
        'ejs-maps' : MapsComponent,
        'e-layers' : LayersDirective,
        'e-layer' : LayerDirective
    },
    data () {
        return {
            shapeData: world_map
        }
    }
}
</script>
Step 2: In the template section, define the Maps component.
<template>
    <div class="wrapper">
        <ejs-maps id='maps'>
            <e-layers>
                <e-layer :shapeData='shapeData'></e-layer>
            </e-layers>
        </ejs-maps>
    </div>
</template>
Here is the summarized code for the above steps in the src/App.vue file:
<template>
    <div id="app">
        <div class='wrapper'>
            <ejs-maps id='maps'>
               <e-layers>
                    <e-layer :shapeData='shapeData'></e-layer>
                </e-layers>
            </ejs-maps>
        </div>
    </div>
</template>

<script>
import { MapsComponent, LayersDirective, LayerDirective } from '@syncfusion/ej2-vue-maps';
import { world_map } from './world-map.js';

export default {
name: "App",
components: {
"ejs-maps":MapsComponent,
"e-layers":LayersDirective,
"e-layer":LayerDirective
  },
  data () {
    return {
        shapeData: world_map
    }
  }
}
</script>
<style>
  .wrapper {
    max-width: 400px;
    margin: 0 auto;
  }
</style>
Run the Project
To run the project, use either npm or Yarn:
npm
npm run serveyarn
yarn run serveModule Injection
The Vue Maps component uses a modular architecture where features are segregated into individual modules. To use advanced features, you must explicitly inject the corresponding modules using the Vue provide option. This approach optimizes performance by loading only the features you need.
The following modules are available:
-
Annotations- Inject this provider to use annotations feature. -
Bubble- Inject this provider to use bubble feature. -
DataLabel- Inject this provider to use data label feature. -
Highlight- Inject this provider to use highlight feature. -
Legend- Inject this provider to use legend feature. -
Marker- Inject this provider to use marker feature. -
MapsTooltip- Inject this provider to use tooltip feature. -
NavigationLine- Inject this provider to use navigation lines feature. -
Selection- Inject this provider to use selection feature. -
Zoom- Inject this provider to use zooming and panning feature. -
Polygon- Inject this provider to use polygon feature.
In the following example, the basic Maps component is extended with MapsTooltip, DataLabel, and Legend modules to display tooltips, data labels, and a legend using sample geographic data.
<template>
   <div class="wrapper">
        <ejs-maps id='maps'></ejs-maps>
    </div>
</template>
<script>
import { MapsComponent, Legend, DataLabel, MapsTooltip } from '@syncfusion/ej2-vue-maps';

export default {
    components: {
        'ejs-maps': MapsComponent
    },
    data:function(){
        return{ };
    },
    provide: {
       maps: [Legend, DataLabel, MapsTooltip]
    }
}
</script>
Render Shapes from GeoJSON Data
This section explains how to bind GeoJSON data to the map.
let usMap: Object =
{
    "type": "FeatureCollection",
    "crs": { "type": "name", "properties": { "name": "urn:ogc:def:crs:OGC:1.3:CRS84" } },
    "features": [
        { "type": "Feature", "properties": { "iso_3166_2": "MA", "name": "Massachusetts", "admin": "United States of America" }, "geometry": { "type": "MultiPolygon", "coordinates": [ [ [ [ -70.801756294617277, 41.248076234530558 ]] ] ] }
        }
    ]
};
Map shapes are rendered within layers. So add a layer collection to the Maps by using layers property. Now bind the GeoJSON data to the shapeData property.
<template>
    <div id="map">
        <div class='wrapper'>
            <ejs-maps >
                <e-layers>
                    <e-layer :shapeData='shapeData' ></e-layer>
                </e-layers>
            </ejs-maps>
        </div>
    </div>
</template>
<script>
import { MapsComponent, LayerDirective, LayersDirective } from '@syncfusion/ej2-vue-maps';
import { world_map } from './world-map.js';
export default {
name: "App",
components: {
"ejs-maps":MapsComponent,
"e-layers":LayersDirective,
"e-layer":LayerDirective
},
data (){
    return{
        shapeData: world_map
    }
}
}
</script>
<style>
  .wrapper {
    max-width: 400px;
    margin: 0 auto;
  }
</style>Note: Refer to the data values for
world_map.