Getting started with React 3D Circular Chart component
22 Jul 202611 minutes to read
This section describes the steps to create a simple 3D Circular Chart and demonstrates the basic usage of the 3D Circular Chart component.
Prerequisites
Before getting started, ensure that your development environment meets the system requirements for Syncfusion® React UI components. That page documents the supported React, Node.js, and npm versions, and includes the React-version compatibility table for Syncfusion React components.
- Node.js 18 or later.
- A modern code editor such as Visual Studio Code.
Dependencies
When you install @syncfusion/ej2-react-charts, the following peer dependencies are installed automatically:
|-- @syncfusion/ej2-react-charts
    |-- @syncfusion/ej2-data — utilities for working with data sources.
    |-- @syncfusion/ej2-react-base — base classes shared by all Syncfusion React components.
    |-- @syncfusion/ej2-pdf-export — PDF export support.
    |-- @syncfusion/ej2-file-utils — file handling used by export features.
    |-- @syncfusion/ej2-compression — compression utilities used by exports.
    |-- @syncfusion/ej2-svg-base — SVG rendering base used by chart visuals
Installation and configuration
Step 1: Create a React application with Vite
To easily set up a React application, use the Vite CLI (npm create vite), which provides a faster development environment, smaller bundle sizes, and optimized builds compared to traditional tools like create-react-app. For detailed steps, refer to the Vite installation instructions. Vite sets up your environment using JavaScript and optimizes your application for production.
Note: To create a React application using
create-react-appinstead, refer to this documentation for more details.
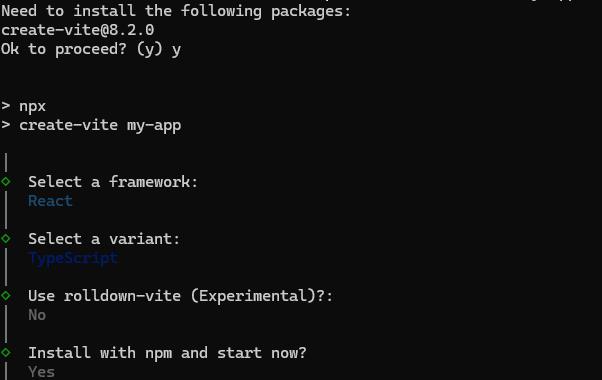
To create a new React application, run the following command. The command will prompt you for a few settings, such as selecting a framework and a variant.
npm create vite@latest my-appFor reference, the interactive prompt looks like this:
You can also skip the interactive prompts by passing the template flag directly. Pick the template that matches your preferred language and run the matching block:
npm create vite@latest my-app -- --template react-ts
cd my-app
npm install
npm create vite@latest my-app -- --template react
cd my-app
npm installStep 2: Install the Syncfusion® React 3D Circular Chart package
All Syncfusion® Essential JS 2 packages are published to the npm registry. Install the React 3D Circular Chart package from the project folder:
npm install @syncfusion/ej2-react-chartsInstalling
@syncfusion/ej2-react-chartsautomatically pulls in the peer dependencies listed in the Dependencies section above. The 3D Circular Chart does not require any theme stylesheet import to render.
Step 3: Add the 3D Circular Chart to the project
CircularChart3DComponent is the root component for the 3D Circular Chart. Open src/App.tsx (or src/App.jsx for the JavaScript template) and replace its contents with the following code.
import { CircularChart3DComponent } from "@syncfusion/ej2-react-charts";
import * as React from "react";

function App() {
  return (<CircularChart3DComponent />);
}
export default App;
import { CircularChart3DComponent } from "@syncfusion/ej2-react-charts";
import * as React from "react";
function App() {
return (<CircularChart3DComponent />);
}
export default App;Then, update src/main.tsx (or src/main.jsx) to mount the App component using React 18’s createRoot API.
import React from "react";
import { createRoot } from "react-dom/client";
import App from "./App";
import "./index.css";

const root = createRoot(document.getElementById("root")!);
root.render(
  <React.StrictMode>
    <App />
  </React.StrictMode>
);
Now run the npm run dev command in the console to start the development server. This command compiles your code and serves the application locally, opening it in the browser.
npm run devModule injection
3D Circular Chart components are segregated into individual feature-wise modules. To use a particular feature, you need to inject its feature service in the services of the Inject component. The following services are commonly used to extend the 3D Circular Chart’s basic functionality.
-
PieSeries3D- Inject this module in toservicesto use the pie series. -
Legend3D- Inject this module in toservicesto use the legend feature. -
Tooltip3D- Inject this module in toservicesto use the tooltip feature. -
DataLabel3D- Inject this module in toservicesto use the data label feature.
Import the modules from the chart package and inject them into the services section of the 3D Circular Chart component as follows.
import { CircularChart3DComponent, PieSeries3D, Legend3D, Tooltip3D, DataLabel3D, Inject } from "@syncfusion/ej2-react-charts";
import * as React from "react";

function App() {
  return (
    <CircularChart3DComponent id="charts">
      <Inject services={[PieSeries3D, Legend3D, Tooltip3D, DataLabel3D]} />
    </CircularChart3DComponent>
  );
}

export default App;
Add data (pie series)
By default, the pie series will be rendered when assigning the JSON data to the series using the dataSource property. Map the field names in the JSON data to the xName and yName properties of the series.
import { CircularChart3DComponent, CircularChart3DSeriesCollectionDirective, CircularChart3DSeriesDirective, PieSeries3D, CircularChartDataLabel3D, CircularChartLegend3D, Inject } from '@syncfusion/ej2-react-charts';
import * as React from "react";
import * as ReactDOM from "react-dom";
function App() {
    const circularData = [
        { x: 'Chrome', y: 62.92 },
        { x: 'Internet Explorer', y: 6.12 },
        { x: 'Opera', y: 3.15 },
        { x: 'Edge', y: 5.5 },
        { x: 'Safari', y: 19.97 },
        { x: 'Others', y: 2.34 }
    ];
    return <CircularChart3DComponent id='charts' title='Browser Market Shares in November 2023' tilt={-45} legendSettings={{ visible: true, position: 'Right' }}>
        <Inject services={[PieSeries3D, CircularChartDataLabel3D, CircularChartLegend3D]} />
        <CircularChart3DSeriesCollectionDirective>
            <CircularChart3DSeriesDirective dataSource={circularData} xName='x' yName='y' dataLabel={{ visible: true, position: 'Outside', name: 'x', font: { fontWeight: '600' }, connectorStyle: { length: '40px' } }}>
            </CircularChart3DSeriesDirective>
        </CircularChart3DSeriesCollectionDirective>
    </CircularChart3DComponent>;
}
export default App;
const root = ReactDOM.createRoot(document.getElementById('charts'));
root.render(<App />);
import { CircularChart3DComponent, CircularChart3DSeriesCollectionDirective, CircularChart3DSeriesDirective, PieSeries3D, CircularChartDataLabel3D, CircularChartLegend3D, Inject } from '@syncfusion/ej2-react-charts';
import * as React from "react";
import * as ReactDOM from "react-dom";
function App() {
const circularData: Object[] = [
{ x: 'Chrome', y: 62.92 },
{ x: 'Internet Explorer', y: 6.12 },
{ x: 'Opera', y: 3.15 },
{ x: 'Edge', y: 5.5 },
{ x: 'Safari', y: 19.97 },
{ x: 'Others', y: 2.34 }
];
return <CircularChart3DComponent id='charts' title='Browser Market Shares in November 2023' tilt={-45} legendSettings={{ visible: true, position: 'Right' }}>
<Inject services={[PieSeries3D, CircularChartDataLabel3D, CircularChartLegend3D]} />
<CircularChart3DSeriesCollectionDirective>
<CircularChart3DSeriesDirective dataSource={circularData} xName='x' yName='y' dataLabel={{ visible: true, position: 'Outside', name: 'x', font: { fontWeight: '600' }, connectorStyle: { length: '40px' } }}>
</CircularChart3DSeriesDirective>
</CircularChart3DSeriesCollectionDirective>
</CircularChart3DComponent>
}
export default App;
const root = ReactDOM.createRoot(document.getElementById('charts'));
root.render(<App />);Troubleshooting
Use the following guidance to resolve common issues when getting started with the 3D Circular Chart component.
-
3D Circular Chart does not render (blank page)
- Verify that
index.htmlcontains a container withid="root", and thatmain.tsx/main.jsxcallsReactDOM.createRoot(document.getElementById("root"))followed byroot.render(<App />). - Run
npm installagain to ensure all peer dependencies listed in the Dependencies section are installed.
- Verify that
-
Series is not rendered or appears empty
- Confirm that the
dataSourcearray contains objects with property names matchingxNameandyName(case sensitive). - Confirm that the
PieSeries3Dmodule is included in theservicesarray of theInjectcomponent as shown in the Module injection section.
- Confirm that the
-
Tooltip, legend, or data labels are not visible after enabling them
- The corresponding modules must be injected into the
servicesarray of theInjectcomponent. For example, tooltip will not appear withoutTooltip3D, and data labels will not render withoutDataLabel3D.
- The corresponding modules must be injected into the
-
TypeScript errors on import
- Ensure
@types/reactand@types/react-domare installed. The Syncfusion package ships with its own types, so no additional type packages are required.
- Ensure
-
Module not found: Can't resolve '@syncfusion/ej2-react-charts'- The package was not installed in the current project. Run
npm install @syncfusion/ej2-react-chartsfrom the project root.
- The package was not installed in the current project. Run
-
ERESOLVEpeer-dependency errors during installation- A React or Node.js version mismatch is the most common cause. Install a supported React version (18 or 19) and Node.js 18 or later, then delete
node_modulesandpackage-lock.jsonand runnpm installagain.
- A React or Node.js version mismatch is the most common cause. Install a supported React version (18 or 19) and Node.js 18 or later, then delete
-
Build or dev server fails to start
- Confirm that you are using a supported Node.js version (Node 18 or later for the latest Vite templates).
- Delete
node_modulesandpackage-lock.json, then runnpm installagain.
- 3D effect looks flat or rotation is disabled
See also
Explore the following related topics: