Getting Started with Syncfusion® JavaScript (ES5) Stock Chart Control
22 Jul 20268 minutes to read
Build your first Syncfusion JavaScript (ES5) application with a simple Stock Chart control in just a few minutes. This quickstart guides you through creating a minimal, runnable HTML page that loads the Syncfusion EJ2 (ES5) Stock Chart from the CDN, initializes it with sample data, and renders an interactive chart.
Ready to streamline your Syncfusion® JavaScript development? Discover the full potential of Syncfusion® JavaScript controls with Syncfusion® AI Coding Assistant. Effortlessly integrate, configure, and enhance your projects with intelligent, context-aware code suggestions, streamlined setups, and real-time insights—all seamlessly integrated into your preferred AI-powered IDEs like VS Code, Cursor, Syncfusion® CodeStudio and more. Explore Syncfusion® AI Coding Assistant
Prerequisites
- Visual Studio Code (or any text editor)
- A modern web browser (Chrome, Edge, Firefox, or Safari) to view the result
Quick Setup
Step 1: Create Folder and HTML File
- Create a folder named
quickstartin your desired directory - Inside the
quickstartfolder, create a new file namedindex.html
Step 2: Add Syncfusion® CDN Resources
Syncfusion® JavaScript (Essential® JS 2) packages are available on npmjs.com. You can include all Syncfusion® controls in a single bundled CDN package or use individual package CDN links.
Option 1: Using Common CDN Bundle (Recommended)
Include a single CDN link that contains all Syncfusion JavaScript controls in the <head> section of your HTML file:
https://cdn.syncfusion.com/ej2/33.2.3/dist/ej2.min.js
Option 2: Using Individual CDN Packages
Include only the styles and scripts required for the Stock Chart control. Add the following CSS and JavaScript links in the <head> section:
Styles (CSS):
https://cdn.syncfusion.com/ej2/33.2.3/tailwind3.css
https://maxcdn.bootstrapcdn.com/bootstrap/3.3.7/css/bootstrap.min.css
Scripts (JavaScript):
https://cdn.syncfusion.com/ej2/33.2.3/ej2-base/dist/global/ej2-base.min.js
https://cdn.syncfusion.com/ej2/33.2.3/ej2-data/dist/global/ej2-data.min.js
https://cdn.syncfusion.com/ej2/33.2.3/ej2-pdf-export/dist/global/ej2-pdf-export.min.js
https://cdn.syncfusion.com/ej2/33.2.3/ej2-file-utils/dist/global/ej2-file-utils.min.js
https://cdn.syncfusion.com/ej2/33.2.3/ej2-compression/dist/global/ej2-compression.min.js
https://cdn.syncfusion.com/ej2/33.2.3/ej2-svg-base/dist/global/ej2-svg-base.min.js
https://cdn.syncfusion.com/ej2/33.2.3/ej2-navigations/dist/global/ej2-navigations.min.js
https://cdn.syncfusion.com/ej2/33.2.3/ej2-calendars/dist/global/ej2-calendars.min.js
https://cdn.syncfusion.com/ej2/33.2.3/ej2-popups/dist/global/ej2-popups.min.js
https://cdn.syncfusion.com/ej2/33.2.3/ej2-lists/dist/global/ej2-lists.min.js
https://cdn.syncfusion.com/ej2/33.2.3/ej2-inputs/dist/global/ej2-inputs.min.js
https://cdn.syncfusion.com/ej2/33.2.3/ej2-buttons/dist/global/ej2-buttons.min.js
https://cdn.syncfusion.com/ej2/33.2.3/ej2-splitbuttons/dist/global/ej2-splitbuttons.min.js
https://cdn.syncfusion.com/ej2/33.2.3/ej2-charts/dist/global/ej2-charts.min.js
Step 3: Add Syncfusion® Stock Chart Control to the Application
Copy and paste the following complete code into your index.html file:
<!DOCTYPE html>
<html lang="en">

<head>
    <title>Syncfusion Stock Chart - Quick Start</title>

    <!-- Styles -->
    <link href="https://cdn.syncfusion.com/ej2/33.2.3/tailwind3.css" rel="stylesheet">
    <link href="https://maxcdn.bootstrapcdn.com/bootstrap/3.3.7/css/bootstrap.min.css" rel="stylesheet">

    <!-- Scripts -->
    <script src="https://cdn.syncfusion.com/ej2/33.2.3/dist/ej2.min.js" type="text/javascript"></script>
</head>

<body>
    <h1>Syncfusion Stock Chart</h1>
    <div id="element"></div>

    <script>
        // Sample data
        var chartData = [
            { x: new Date('2012-04-02'), open: 320.71, high: 324.07, low: 317.74, close: 323.78, volume: 45638000 },
            { x: new Date('2012-04-03'), open: 323.03, high: 324.30, low: 319.64, close: 321.63, volume: 40857000 },
            { x: new Date('2012-04-04'), open: 319.54, high: 319.82, low: 315.87, close: 317.89, volume: 32519000 },
            { x: new Date('2012-04-05'), open: 316.44, high: 318.53, low: 314.60, close: 316.48, volume: 46327000 },
            { x: new Date('2012-04-06'), open: 317.20, high: 320.50, low: 315.30, close: 319.80, volume: 38200000 },
            { x: new Date('2012-04-07'), open: 320.00, high: 322.90, low: 318.50, close: 321.10, volume: 35500000 },
            { x: new Date('2012-04-08'), open: 321.50, high: 325.20, low: 320.80, close: 324.70, volume: 41200000 },
            { x: new Date('2012-04-09'), open: 325.00, high: 326.80, low: 322.40, close: 323.90, volume: 39800000 },
            { x: new Date('2012-04-10'), open: 324.20, high: 327.00, low: 323.10, close: 326.10, volume: 42100000 },
            { x: new Date('2012-04-11'), open: 326.30, high: 329.20, low: 325.50, close: 328.70, volume: 44500000 },
            { x: new Date('2012-04-12'), open: 328.90, high: 330.50, low: 326.70, close: 327.80, volume: 36700000 }
        ];

        // Create Stock Chart
        var chart = new ej.charts.StockChart({
            series: [{
                dataSource: chartData,
                type: 'Candle',   // Series type: renders OHLC as candlesticks
                xName: 'x',       // Field mapped to the x-axis (date)
                open: 'open',     // Field mapped to the open price
                high: 'high',     // Field mapped to the high price
                low: 'low',       // Field mapped to the low price
                close: 'close'    // Field mapped to the close price
            }]
        });
        // Render Chart
        chart.appendTo('#element');
    </script>
</body>

</html>
Series Property Reference
| Property | Description |
|---|---|
dataSource |
The data array used to render the chart |
type |
The series type. For Stock Chart, use 'Candle', 'OHLC', 'Line', 'Area', or 'Column'
|
xName |
The field in the data source that maps to the x-axis (typically a date) |
open |
The field in the data source that maps to the open price |
high |
The field in the data source that maps to the high price |
low |
The field in the data source that maps to the low price |
close |
The field in the data source that maps to the close price |
Step 4: Open in Browser
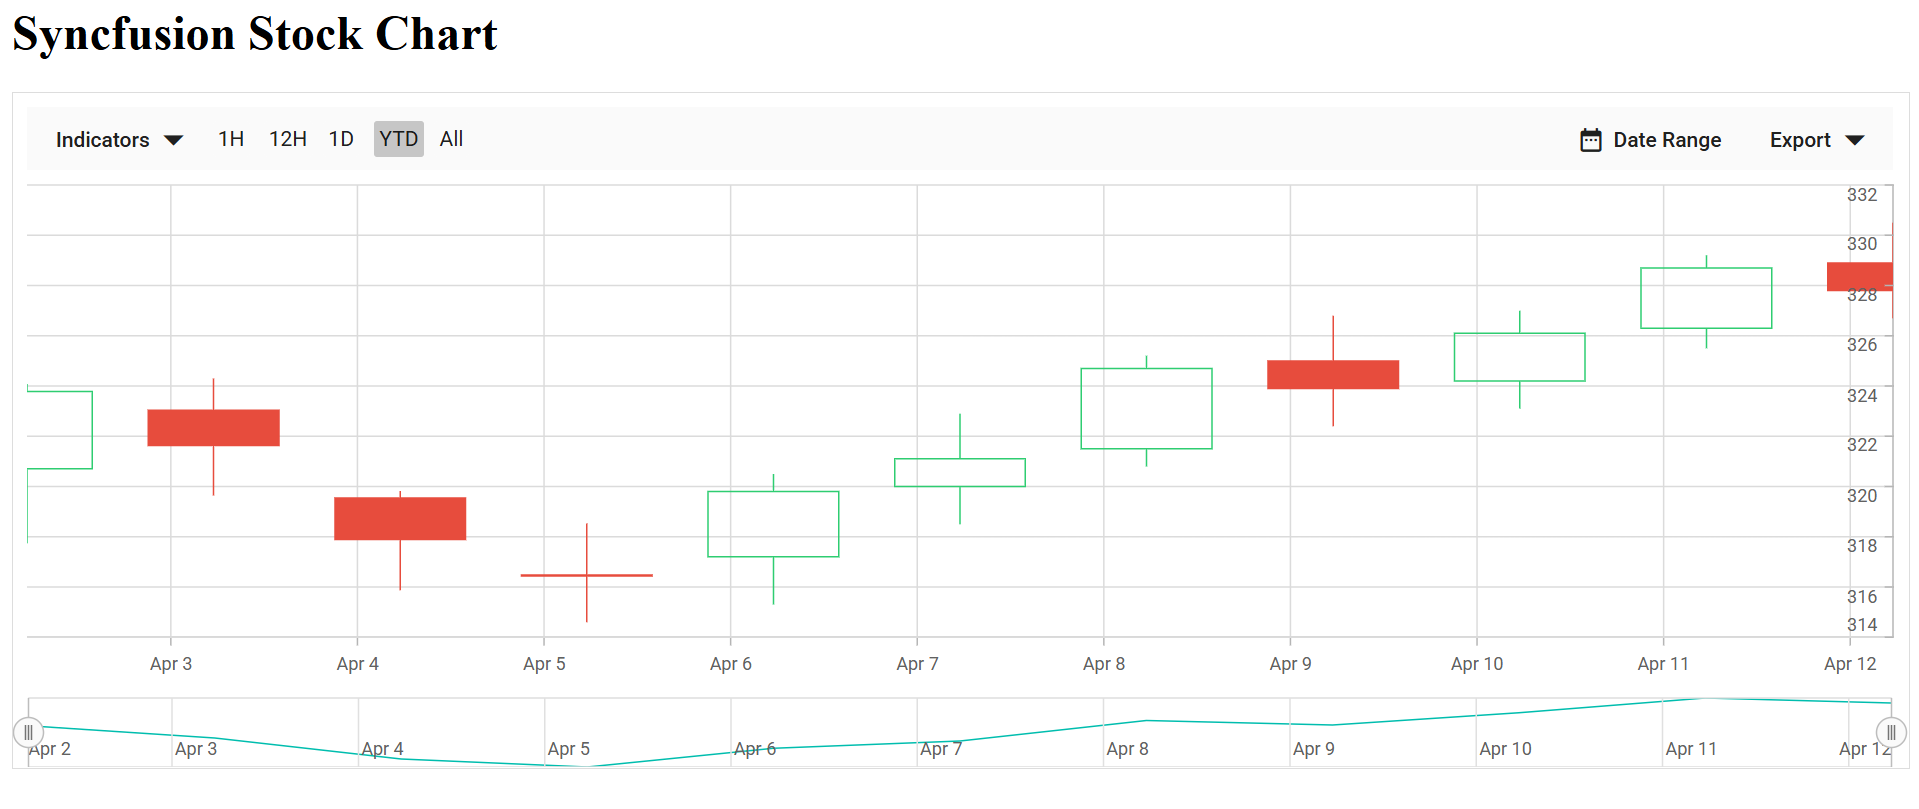
Open quickstart/index.html through a local web server (for example, right-click the file in VS Code with the Live Server extension installed and choose Open with Live Server). The page should display the Syncfusion Stock Chart control rendered with the candle series.
Output
The page should display the Syncfusion Stock Chart control rendered with the candle series.
Troubleshooting
-
Blank page, no chart — The CDN script failed to load. Verify internet access and that the CDN URL returns a
200 OKresponse. -
ej is not defined—ej2.min.jsdid not load before the chart script. Move the<script>tag into the<head>or before your chart code. -
Chart renders without data — Mismatched field names between
dataSourceand series props. EnsurexName,open,high,low, andclosematch the data keys exactly.