Getting Started with ASP.NET Core 3D Chart
7 Aug 20263 minutes to read
This section briefly explains how to include the ASP.NET Core 3D Charts control in your ASP.NET Core application using Visual Studio.
Create an ASP.NET Core Web App with Razor Pages
Create an ASP.NET Core Web App using Visual Studio via Microsoft Templates or the Syncfusion® ASP.NET Core Extension. For detailed instructions, refer to the ASP.NET Core Web App Getting Started documentation.
Install the required ASP.NET Core package
To add ASP.NET Core 3D Charts control in the app, open the NuGet package manager in Visual Studio (Tools → NuGet Package Manager → Manage NuGet Packages for Solution), search for and install the Syncfusion.AspNetCore.Chart3D package. All Syncfusion ASP.NET Core packages are available in nuget.org. See the NuGet packages topic for details.
Alternatively, you can install the same package using the Package Manager Console with the following command.
Install-Package Syncfusion.AspNetCore.Chart3D -Version 34.2.2Add the ASP.NET Core Tag Helpers
After the package is installed, open the ~/Pages/_ViewImports.cshtml file and import the Syncfusion.AspNetCore.Base and Syncfusion.AspNetCore.Charts Tag Helpers.
@addTagHelper *, Syncfusion.AspNetCore.Base
@addTagHelper *, Syncfusion.AspNetCore.Charts
Add script resources
Include the script reference inside the <head> of ~/Pages/Shared/_Layout.cshtml.
<head>
    ...
    <!-- ASP.NET Core controls scripts -->
    <script src="_content/Syncfusion.AspNetCore.Chart3D/scripts/sf-chart3d.min.js"></script>
</head>
Register the script manager
Open the ~/Pages/Shared/_Layout.cshtml file and register the script manager <ejs-scripts> at the end of the <body> element as follows.
<body>
    ...
    <!-- ASP.NET Core Script Manager -->
    <ejs-scripts></ejs-scripts>
</body>
Add ASP.NET Core 3D Charts control
Add the ASP.NET Core 3D Charts control in the ~/Pages/Index.cshtml file.
@{
    List<Data> data = new List<Data>
    {
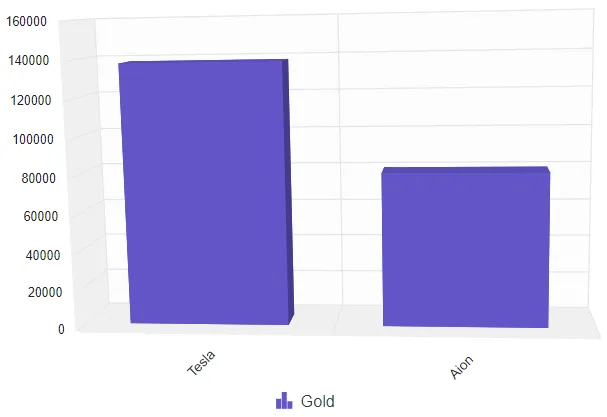
        new Data { X= "Tesla", Y= 137429 },
        new Data { X= "Aion",  Y= 80308  }
    };
}

<ejs-chart3d id="columnContainer" enableRotation="true" rotation="7" tilt="10" depth="100">
    <e-chart3d-primaryxaxis valueType="@Syncfusion.EJ2.Charts.ValueType.Category" labelPlacement="@Syncfusion.EJ2.Charts.LabelPlacement.BetweenTicks" labelRotation="-45">
    </e-chart3d-primaryxaxis>
    <e-chart3d-series-collection>
        <e-chart3d-series dataSource="data" xName="X" yName="Y" name="Gold" type="@Syncfusion.EJ2.Charts.Chart3DSeriesType.Column">
        </e-chart3d-series>
    </e-chart3d-series-collection>
</ejs-chart3d>
public IActionResult Index()
{
List<Data> data = new List<Data>
{
new Data { X= "Tesla", Y= 137429 },
new Data { X= "Aion", Y= 80308 }
};
ViewBag.dataSource = data;
return View();
}
public class Data
{
public string X;
public double Y;
}Run the application
Press Ctrl+F5 (Windows) or ⌘+F5 (macOS) to launch the application. The ASP.NET Core 3D Charts control will render in your default web browser.