Getting Started with the Vue Stock Chart Component in Vue 3
21 May 202613 minutes to read
This article provides a step-by-step guide for setting up a Vite project with a JavaScript environment and integrating the Syncfusion® Vue Stock Chart component using the Composition API / Options API.
The Composition API is a new feature introduced in Vue.js 3 that provides an alternative way to organize and reuse component logic. It allows developers to write components as functions that use smaller, reusable functions called composition functions to manage their properties and behavior.
The Options API is the traditional way of writing Vue.js components, where the component logic is organized into a series of options that define the component’s properties and behavior. These options include data, methods, computed properties, watchers, life cycle hooks, and more.
Prerequisites
Ensure that the development environment meets the required criteria listed in System requirements for Syncfusion® Vue UI components.
Set Up the Vite Project
The recommended way to start a Vue 3 project is by scaffolding it with Vite. To create a new Vite project, use one of the commands that are specific to either NPM or Yarn.
npm
npm create vite@latestyarn
yarn create viteUsing one of the above commands will lead you through a short interactive setup:
Step 1: Define the project name: We can specify the name of the project directly. Let’s specify the name of the project as my-project for this article.
? Project name: » my-projectStep 2: Select Vue as the framework. It will create a Vue 3 project.
? Select a framework: » - Use arrow-keys. Return to submit.
Vanilla
> Vue
  React
  Preact
  Lit
  Svelte
  Others
Step 3: Choose JavaScript as the framework variant to build this Vite project using JavaScript and Vue.
? Select a variant: » - Use arrow-keys. Return to submit.
> JavaScript
  TypeScript
  Customize with create-vue ↗
  Nuxt ↗
Step 4: Install dependencies
After the project is created, the CLI prompts you to install dependencies and start the development server:
? Install with <package-manager> and start now?
❯ Yes / No
Select Yes. The CLI automatically navigates to the project directory, installs all required dependencies, and starts the development server.
Now that my-project is ready to run with default settings, let’s add Syncfusion® components to the project.
Add Syncfusion® Vue Stock Chart Packages
Syncfusion® Vue component packages are available at npmjs.com. To use Syncfusion® Vue components in the project, install the corresponding npm package.
This article uses the Vue Stock Chart component as an example. To use the Vue Stock Chart component in the project, the @syncfusion/ej2-vue-charts package needs to be installed using either npm or Yarn:
npm
npm install @syncfusion/ej2-vue-chartsyarn
yarn add @syncfusion/ej2-vue-chartsNote: npm v5+ saves packages to
dependenciesby default;--saveis not required.
Add Syncfusion® Vue Stock Chart Component
Follow the below steps to add the Vue Stock Chart component using Composition API or Options API:
Step 1: First, import and register the Stock Chart component and its child directives in the script section of the src/App.vue file. If you are using the Composition API, you should add the setup attribute to the script tag to indicate that Vue will be using the Composition API.
<script setup>
import { StockChartComponent as EjsStockchart, StockChartSeriesCollectionDirective as EStockchartSeriesCollection, StockChartSeriesDirective as EStockchartSeries, DateTime, CandleSeries } from "@syncfusion/ej2-vue-charts";
</script><script>
import { StockChartComponent, StockChartSeriesCollectionDirective, StockChartSeriesDirective, DateTime, CandleSeries } from "@syncfusion/ej2-vue-charts";
//Component registration
export default {
name: "App",
components: {
"ejs-stockchart": StockChartComponent,
"e-stockchart-series-collection": StockChartSeriesCollectionDirective,
"e-stockchart-series": StockChartSeriesDirective
}
}
</script>Step 2: Declare the values for the dataSource property in the script section.
<script setup>
const seriesData = [
        {
            date: new Date('2012-04-02'),
            open: 85.9757,
            high: 90.6657,
            low: 85.7685,
            close: 90.5257,
            volume: 660187068
        },
        {
            date: new Date('2012-04-09'),
            open: 89.4471,
            high: 92,
            low: 86.2157,
            close: 86.4614,
            volume: 912634864
        },
        // Additional data points...
];
</script><script>
export default {
data() {
return {
seriesData: [
{
date: new Date('2012-04-02'),
open: 85.9757,
high: 90.6657,
low: 85.7685,
close: 90.5257,
volume: 660187068
},
{
date: new Date('2012-04-09'),
open: 89.4471,
high: 92,
low: 86.2157,
close: 86.4614,
volume: 912634864
},
// Additional data points...
],
};
}
};
</script>Note: Register feature modules using provide('stockChart', [...]) (Composition API) or the provide option (Options API).
Step 3: In the template section, define the Stock Chart component with the dataSource property.
<template>
    <ejs-stockchart>
        <e-stockchart-series-collection>
            <e-stockchart-series :dataSource="seriesData" type="Candle" volume="volume" xName="date" low="low" high="high" open="open" close="close">
            </e-stockchart-series>
        </e-stockchart-series-collection>
    </ejs-stockchart>
</template>
Here is the summarized code for the above steps in the src/App.vue file:
<template>
    <ejs-stockchart>
        <e-stockchart-series-collection>
            <e-stockchart-series :dataSource="seriesData" type="Candle" volume="volume" xName="date" low="low" high="high" open="open" close="close">
            </e-stockchart-series>
        </e-stockchart-series-collection>
    </ejs-stockchart>
</template>

<script setup>
import { provide } from 'vue';
import { StockChartComponent as EjsStockchart, StockChartSeriesCollectionDirective as EStockchartSeriesCollection, StockChartSeriesDirective as EStockchartSeries, DateTime, CandleSeries } from "@syncfusion/ej2-vue-charts";

const seriesData = [
        {
            date: new Date('2012-04-02'),
            open: 85.9757,
            high: 90.6657,
            low: 85.7685,
            close: 90.5257,
            volume: 660187068
        },
        {
            date: new Date('2012-04-09'),
            open: 89.4471,
            high: 92,
            low: 86.2157,
            close: 86.4614,
            volume: 912634864
        },
        // Additional data points...
];
const stockChart = [ DateTime, CandleSeries ];
provide('stockChart', stockChart);
</script><template>
<ejs-stockchart>
<e-stockchart-series-collection>
<e-stockchart-series :dataSource="seriesData" type="Candle" volume="volume" xName="date" low="low" high="high" open="open" close="close">
</e-stockchart-series>
</e-stockchart-series-collection>
</ejs-stockchart>
</template>
<script>
import { StockChartComponent, StockChartSeriesCollectionDirective, StockChartSeriesDirective, DateTime, CandleSeries } from "@syncfusion/ej2-vue-charts";
//Component registration
export default {
name: "App",
components: {
"ejs-stockchart": StockChartComponent,
"e-stockchart-series-collection": StockChartSeriesCollectionDirective,
"e-stockchart-series": StockChartSeriesDirective
},
data() {
return {
seriesData: [
{
date: new Date('2012-04-02'),
open: 85.9757,
high: 90.6657,
low: 85.7685,
close: 90.5257,
volume: 660187068
},
{
date: new Date('2012-04-09'),
open: 89.4471,
high: 92,
low: 86.2157,
close: 86.4614,
volume: 912634864
},
// Additional data points...
],
};
},
provide: {
stockChart: [ DateTime, CandleSeries ]
}
};
</script>Run the Project
To run the project, use either npm or Yarn:
npm
npm run devyarn
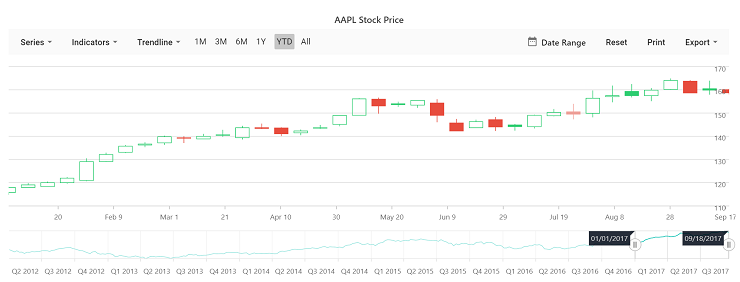
yarn run devThe output will appear as follows:
Sample: You can explore the complete sample project in the vue-3-stock-chart-getting-started repository.