How can I help you?
Getting Started with the Vue Stock Chart Component in Vue 2
20 Feb 202621 minutes to read
This article provides a step-by-step guide for setting up a Vue 2 project using Vue-CLI and integrating the Syncfusion® Vue Stock Chart component.
Prerequisites
System requirements for Syncfusion® Vue UI components
Dependencies
The list of minimum dependencies required to use the Stock Chart is as follows:
|-- @syncfusion/ej2-charts
    |-- @syncfusion/ej2-base
    |-- @syncfusion/ej2-data
    |-- @syncfusion/ej2-pdf-export
    |-- @syncfusion/ej2-file-utils
    |-- @syncfusion/ej2-compression
    |-- @syncfusion/ej2-svg-base
    |-- @syncfusion/ej2-navigations
    |-- @syncfusion/ej2-calendars
    |-- @syncfusion/ej2-popups
    |-- @syncfusion/ej2-lists
    |-- @syncfusion/ej2-inputs
    |-- @syncfusion/ej2-buttons
    |-- @syncfusion/ej2-splitbuttons
Setup the Vue 2 project
To generate a Vue 2 project using Vue-CLI, use the vue create command. Follow these steps to install Vue CLI and create a new project:
npm install -g @vue/cli
vue create quickstart
cd quickstart
npm run serve
or
yarn global add @vue/cli
vue create quickstart
cd quickstart
yarn run serve
When creating a new project, choose the option Default ([Vue 2] babel, eslint) from the menu.
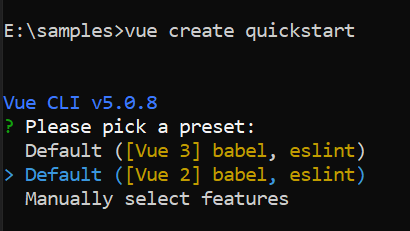
Once the quickstart project is set up with default settings, proceed to add Syncfusion® components to the project.
Add Syncfusion® Vue packages
Syncfusion® packages are available at npmjs.com. To use Vue components, install the required npm package.
This article uses the Vue Stock Chart component as an example. Install the @syncfusion/ej2-vue-charts package by running the following command:
npm install @syncfusion/ej2-vue-charts --saveor
yarn add @syncfusion/ej2-vue-chartsThe –save will instruct NPM to include the chart package inside of the
dependenciessection of thepackage.json.
Add Syncfusion® Vue component
Follow the steps below to add the Vue Stock Chart component:
1. First, import and register the Stock Chart component in the script section of the src/App.vue file.
<script>
import { StockChartComponent } from '@syncfusion/ej2-vue-charts';
export default {
  components: {
    'ejs-stockchart': StockChartComponent
  }
}
</script>
2. In the template section, define the Stock Chart component.
<template>
  <div id="app">
      <ejs-stockchart></ejs-stockchart>
  </div>
</template>
Run the project
To run the project, use the following command:
npm run serveor
yarn run serveModule Injection
To create a Stock Chart with additional features, inject the required modules. The following modules extend the Stock Chart’s basic functionality.
-
CandleSeries— Inject this module to use candle series. -
DateTime— Inject this module to use date time axis. -
RangeTooltip— Inject this module to show the tooltip.
Inject these modules in the provide section as shown below.
<script>
import { StockChartComponent, CandleSeries, DateTime, RangeTooltip } from "@syncfusion/ej2-vue-charts";

export default {
  components: {
    'ejs-stockchart': StockChartComponent
  },
  provide: {
    stockChart: [CandleSeries, DateTime, RangeTooltip]
  }
};
</script>
Populate Stock Chart with Data
This section explains how to plot the JSON data into the Stock Chart. The sample data includes date/time values for the x field.
export default {
  data() {
    return {
     data: [{
   x: new Date( '2012-04-02' ),
    open : 85.9757,
    high : 90.6657,
    low : 85.7685,
    close : 90.5257,
    volume : 660187068
  },
  {
   x: new Date( '2012-04-09' ),
    open : 89.4471,
    high : 92,
    low : 86.2157,
    close : 86.4614,
    volume : 912634864
  },
  {
   x: new Date( '2012-04-16' ),
    open : 87.1514,
    high : 88.6071,
    low : 81.4885,
    close : 81.8543,
    volume : 1221746066
  },
  {
   x: new Date( '2012-04-23' ),
    open : 81.5157,
    high : 88.2857,
    low : 79.2857,
    close : 86.1428,
    volume : 965935749
  },
  {
   x: new Date( '2012-04-30' ),
    open : 85.4,
    high : 85.4857,
    low : 80.7385,
    close : 80.75,
    volume : 615249365
  }];
};
}
};
Add a series object to the Stock Chart using the series property and set the JSON array to the dataSource property.
Since the JSON contains DateTime data, set the horizontal axis valueType to DateTime. By default, the axis valueType is Numeric.
<template>
  <div class="control-section">
    <div>
      <ejs-stockchart id="stockchartcontainer" :primaryXAxis="primaryXAxis" :primaryYAxis="primaryYAxis" :title="title">
        <e-stockchart-series-collection>
          <e-stockchart-series :dataSource="seriesData" type="Candle" volume='volume' xName='date' low='low' high='high'
            open='open' close='close'></e-stockchart-series>
        </e-stockchart-series-collection>
      </ejs-stockchart>
    </div>
  </div>
</template>
<script>
import { chartData } from "./datasource.js";
import {
  StockChartComponent, StockChartSeriesCollectionDirective, StockChartSeriesDirective, DateTime, CandleSeries, RangeTooltip, LineSeries, SplineSeries, HiloOpenCloseSeries, HiloSeries, RangeAreaSeries, Trendlines, EmaIndicator, RsiIndicator, BollingerBands, TmaIndicator, MomentumIndicator, SmaIndicator, AtrIndicator, AccumulationDistributionIndicator, MacdIndicator, StochasticIndicator, Export
} from "@syncfusion/ej2-vue-charts";

export default {
  name: "App",
  components: {
    'ejs-stockchart': StockChartComponent,
    'e-stockchart-series-collection': StockChartSeriesCollectionDirective,
    'e-stockchart-series': StockChartSeriesDirective
  },
  data() {
    return {
      seriesData: chartData,
      primaryXAxis: {
        valueType: "DateTime",
        majorGridLines: { color: "transparent" },
      },
      primaryYAxis: {
        majorTickLines: { color: "transparent", width: 0 }
      },
      title: 'AAPL Stock Price',
    };
  },
  provide: {
    stockChart: [
      DateTime, RangeTooltip, LineSeries, SplineSeries, CandleSeries, HiloOpenCloseSeries, HiloSeries, RangeAreaSeries, Trendlines, EmaIndicator, RsiIndicator, BollingerBands, TmaIndicator, MomentumIndicator, SmaIndicator, AtrIndicator, AccumulationDistributionIndicator, MacdIndicator, StochasticIndicator, Export
    ]
  }
};
</script>Add Stock Chart Title
You can add a title using title property to the Stock Chart to provide quick information to the user about the data plotted in the Chart.
<template>
    <div id="app">
        <ejs-stockchart :valueType='valueType' :labelFormat='labelFormat' :title='title'>
            <e-stockchart-series-collection>
                <e-stockchart-series :dataSource='seriesData' type='Candle' xName='date' low='low' high='high' open='open' close='close' width=2>
                </e-stockchart-series>
            </e-stockchart-series-collection>
        </ejs-stockchart>
    </div>
</template>
<script>
import { StockChartComponent, StockChartSeriesCollectionDirective, StockChartSeriesDirective, DateTime, CandleSeries, RangeTooltip, LineSeries, SplineSeries, HiloOpenCloseSeries, HiloSeries, RangeAreaSeries, Trendlines, EmaIndicator, RsiIndicator, BollingerBands, TmaIndicator, MomentumIndicator, SmaIndicator, AtrIndicator, AccumulationDistributionIndicator, MacdIndicator, StochasticIndicator, Export } from "@syncfusion/ej2-vue-charts";
import { chartData } from "./datasource.js";

export default {
  name: "App",
  components: {
    'ejs-stockchart': StockChartComponent,
    'e-stockchart-series-collection': StockChartSeriesCollectionDirective,
    'e-stockchart-series': StockChartSeriesDirective
  },
  data() {
    return {
     valueType: 'DateTime',
     seriesData: chartData,
     labelFormat: 'MMM-yy',
     title: 'Sales Analysis'
    };
  },
  provide: {
    stockChart: [
      DateTime, RangeTooltip, LineSeries, SplineSeries, CandleSeries, HiloOpenCloseSeries, HiloSeries, RangeAreaSeries, Trendlines, EmaIndicator, RsiIndicator, BollingerBands, TmaIndicator, MomentumIndicator, SmaIndicator, AtrIndicator, AccumulationDistributionIndicator, MacdIndicator, StochasticIndicator, Export
    ]
  }
};
</script>Add Crosshair
Crosshair shows vertical and horizontal lines to view axis values at the mouse or touch position.
Enable crosshair lines using the enable property in the crosshair. Similarly, enable the tooltip label for an axis using the enable property of crosshairTooltip on that axis.
<template>
    <div id="app">
        <ejs-stockchart :title='title'  :crosshair="crosshair">
            <e-stockchart-series-collection>
                <e-stockchart-series :dataSource='seriesData' type='Candle'>
                </e-stockchart-series>
            </e-stockchart-series-collection>
        </ejs-stockchart>
    </div>
</template>
<script>
import { chartData } from "./datasource.js";
import {
  StockChartComponent, StockChartSeriesCollectionDirective, StockChartSeriesDirective, DateTime, CandleSeries, RangeTooltip, LineSeries, SplineSeries, Crosshair, HiloOpenCloseSeries, HiloSeries, RangeAreaSeries, Trendlines, EmaIndicator, RsiIndicator, BollingerBands, TmaIndicator, MomentumIndicator, SmaIndicator, AtrIndicator, AccumulationDistributionIndicator, MacdIndicator, StochasticIndicator, Export
} from "@syncfusion/ej2-vue-charts";

export default {
  name: "App",
  components: {
    'ejs-stockchart': StockChartComponent,
    'e-stockchart-series-collection': StockChartSeriesCollectionDirective,
    'e-stockchart-series': StockChartSeriesDirective
  },
  data() {
    return {
      title: 'Sales Analysis',
      seriesData: chartData,
      crosshair: {
        enable: true
      }
    };
  },
  provide: {
    stockChart: [
      DateTime, RangeTooltip, LineSeries, SplineSeries, CandleSeries, HiloOpenCloseSeries, HiloSeries, RangeAreaSeries, Trendlines, EmaIndicator, RsiIndicator, Crosshair, BollingerBands, TmaIndicator, MomentumIndicator, SmaIndicator, AtrIndicator, AccumulationDistributionIndicator, MacdIndicator, StochasticIndicator, Export
    ]
  }
};
</script>Add Trackball
Trackball highlights the data point closest to the mouse or touch position. The trackball marker indicates the closest point and the trackball tooltip displays its details. To use the trackball feature, inject Crosshair and Tooltip into the provide.
Enable the trackball by setting the crosshair enable property to true and the shared property in tooltip to true.
<template>
  <div id="app">
    <ejs-stockchart id="container" :title='title' :primaryXAxis='primaryXAxis' :crosshair='crosshair'
      :tooltip='tooltip'>
      <e-stockchart-series-collection>
        <e-stockchart-series :dataSource='seriesData' type='Line' xName='x' yName='y' name='John'>
        </e-stockchart-series>
        <e-stockchart-series :dataSource='seriesData' type='Line' xName='x' yName='y1' name='Andrew'>
        </e-stockchart-series>
        <e-stockchart-series :dataSource='seriesData' type='Line' xName='x' yName='y2' name='Thomas'>
        </e-stockchart-series>
        <e-stockchart-series :dataSource='seriesData' type='Line' xName='x' yName='y3' name='Mark'>
        </e-stockchart-series>
        <e-stockchart-series :dataSource='seriesData' type='Line' xName='x' yName='y4' name='William'>
        </e-stockchart-series>
      </e-stockchart-series-collection>
    </ejs-stockchart>
  </div>
</template>
<script>
import {
  StockChartComponent, StockChartSeriesCollectionDirective, StockChartSeriesDirective, DateTime, CandleSeries, RangeTooltip, LineSeries, SplineSeries, Crosshair, HiloOpenCloseSeries, HiloSeries, RangeAreaSeries, Trendlines, EmaIndicator, RsiIndicator, BollingerBands, TmaIndicator, MomentumIndicator, SmaIndicator, AtrIndicator, Tooltip, AccumulationDistributionIndicator, MacdIndicator, StochasticIndicator, Export
} from "@syncfusion/ej2-vue-charts";

export default {
  name: "App",
  components: {
    'ejs-stockchart': StockChartComponent,
    'e-stockchart-series-collection': StockChartSeriesCollectionDirective,
    'e-stockchart-series': StockChartSeriesDirective
  },
  data() {
    return {
      seriesData: [
        { x: new Date(2000, 2, 11), y: 15, y1: 39, y2: 60, y3: 75, y4: 85 },
        { x: new Date(2000, 9, 14), y: 20, y1: 30, y2: 55, y3: 75, y4: 83 },
        { x: new Date(2001, 2, 11), y: 25, y1: 28, y2: 48, y3: 68, y4: 85 },
        { x: new Date(2001, 9, 16), y: 21, y1: 35, y2: 57, y3: 75, y4: 87 },
        { x: new Date(2002, 2, 7), y: 13, y1: 39, y2: 62, y3: 71, y4: 82 },
        { x: new Date(2002, 9, 7), y: 18, y1: 41, y2: 64, y3: 69, y4: 74 },
        { x: new Date(2003, 2, 11), y: 24, y1: 45, y2: 57, y3: 81, y4: 73 },
        { x: new Date(2003, 9, 14), y: 23, y1: 48, y2: 53, y3: 84, y4: 75 },
        { x: new Date(2004, 2, 6), y: 19, y1: 54, y2: 63, y3: 85, y4: 73 },
        { x: new Date(2004, 9, 6), y: 31, y1: 55, y2: 50, y3: 87, y4: 60 },
        { x: new Date(2005, 2, 11), y: 39, y1: 57, y2: 66, y3: 75, y4: 48 },
        { x: new Date(2005, 9, 11), y: 50, y1: 60, y2: 65, y3: 70, y4: 55 },
        { x: new Date(2006, 2, 11), y: 24, y1: 60, y2: 79, y3: 85, y4: 40 }
      ],
      primaryXAxis: {
        title: 'Years',
        minimum: new Date(2000, 1, 1), maximum: new Date(2006, 2, 11),
        intervalType: 'Months',
        valueType: 'DateTime',
      },
      title: "Average Sales per Person",
      crosshair: { enable: true, lineType: 'Vertical' },
      tooltip: { enable: true, shared: true, format: '${series.name} : ${point.x} : ${point.y}' }
    };
  },
  provide: {
    stockChart: [
      DateTime, RangeTooltip, LineSeries, SplineSeries, CandleSeries, HiloOpenCloseSeries, HiloSeries, RangeAreaSeries, Trendlines, EmaIndicator, RsiIndicator, Tooltip, Crosshair, BollingerBands, TmaIndicator, MomentumIndicator, SmaIndicator, AtrIndicator, AccumulationDistributionIndicator, MacdIndicator, StochasticIndicator, Export
    ]
  }
};
</script>
<style>
#container {
  height: 350px;
}
</style>You can refer to our Vue Stock Chart feature tour page for its groundbreaking feature representations. You can also explore our Vue Stock Chart example that shows you how to present and manipulate data.