How can I help you?
Getting Started with the Vue Smith Chart Component in Vue 2
19 Feb 202624 minutes to read
This article provides a step-by-step guide for setting up a Vue 2 project using Vue-CLI and integrating the Syncfusion® Vue Smith Chart component.
Prerequisites
System requirements for Syncfusion® Vue UI components
Dependencies
The following minimum dependencies are required to use the Smith Chart component:
|-- @syncfusion/ej2-vue-charts
|-- @syncfusion/ej2-charts
|-- @syncfusion/ej2-base
|-- @syncfusion/ej2-data
|-- @syncfusion/ej2-svg-base
|-- @syncfusion/ej2-pdf-export
|-- @syncfusion/ej2-compression
|-- @syncfusion/ej2-file-utils
|-- @syncfusion/ej2-vue-base
Setup the Vue 2 project
To generate a Vue 2 project using Vue CLI, run the vue create command. Follow these steps to install Vue CLI and create a new project:
npm install -g @vue/cli
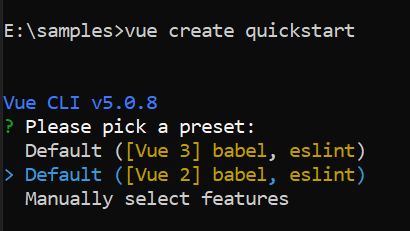
vue create quickstart
cd quickstart
npm run serveor
yarn global add @vue/cli
vue create quickstart
cd quickstart
yarn run serveWhen creating a new project, choose the option Default ([Vue 2] babel, eslint) from the menu.

Once the quickstart project is set up with default settings, proceed to add Syncfusion® components to the project.
Add Syncfusion® Vue packages
Syncfusion® packages are available at npmjs.com. Install the package required for the Smith Chart component.
This article uses the Vue Smith Chart component as an example. Install the @syncfusion/ej2-vue-charts package by running the following command:
npm install @syncfusion/ej2-vue-charts --saveor
yarn add @syncfusion/ej2-vue-chartsThe –save option will instruct NPM to include the Progress Bar package inside of the
dependenciessection of thepackage.json.
Add Syncfusion® Vue component
Follow these steps to add the Vue Smith Chart component:
1. First, import and register the Smith Chart component in the script section of the src/App.vue file.
<script>
import { SmithchartComponent } from "@syncfusion/ej2-vue-charts";
export default {
components: {
'ejs-smithchart': SmithchartComponent
}
}
</script>2. In the template section, define the Smith Chart component.
<template>
<div id="app">
<ejs-smithchart></ejs-smithchart>
</div>
</template>Run the project
To run the project, use the following command:
npm run serveor
yarn run serveThe following example shows a basic Smith Chart component instance.
<template>
<ejs-smithchart id="smithchart"></ejs-smithchart>
</template>
<script>
import { SmithchartComponent } from '@syncfusion/ej2-vue-charts';
export default {
components: {
'ejs-smithchart': SmithchartComponent
}
}
</script>
<style>
@import "../node_modules/@syncfusion/ej2-base/styles/material.css";
@import "../node_modules/@syncfusion/ej2-vue-charts/styles/material.css";
</style>
Module Injection
The Smith Chart component is modular: optional features are provided as separate modules that must be imported and injected. To enable a feature, import its module and inject it using the provide option in the component definition (Vue 2).
Available feature modules include:
-
SmithchartLegend— Provides the legend feature. -
TooltipRender— Provides the tooltip feature.
The example below shows how to import these modules and inject them into the Smith Chart via provide.
<template>
<div class="control_wrapper">
<ejs-smithchart id="smithchart"></ejs-smithchart>
</div>
</template>
<script>
import { SmithchartComponent, SmithchartLegend, TooltipRender } from "@syncfusion/ej2-vue-charts";
export default {
components: {
'ejs-smithchart': SmithchartComponent
},
data: function() {
return {
}
},
provide: {
smithchart: [SmithchartLegend, TooltipRender]
}
}
</script>
<style>
@import "../node_modules/@syncfusion/ej2-base/styles/material.css";
@import "../node_modules/@syncfusion/ej2-vue-charts/styles/material.css";
</style>
Add series to Smith chart
The Smith Chart supports two ways to specify series:
-
dataSource— Bind a data object that specifies resistance and reactance values. -
points— Provide a collection of resistance and reactance points for the series.
The following examples demonstrate two approaches to add series to the Smith Chart:
- The first series,
Transmission1, is bound usingdataSource. - The second series,
Transmission2, is defined usingpoints.
<template>
<div class="control_wrapper">
<ejs-smithchart id="smithchart">
<e-seriesCollection>
<e-series :dataSource='dataSource' :name='name' :reactance='reactance' :resistance='resistance'></e-series>
<e-series :points='points' :name='name2'></e-series>
</e-seriesCollection>
</ejs-smithchart>
</div>
</template>
<script>
import { SmithchartComponent, SeriesDirective, SeriesCollectionDirective } from "@syncfusion/ej2-vue-charts";
export default {
name: "App",
components: {
"ejs-smithchart": SmithchartComponent,
"e-seriesCollection": SeriesCollectionDirective,
"e-series": SeriesDirective
},
data: function () {
return {
dataSource: [
{ resistance: 0, reactance: 0.05 }, { resistance: 0, reactance: 0.05 },
{ resistance: 0.3, reactance: 0.1 }, { resistance: 0.5, reactance: 0.2 },
{ resistance: 1.5, reactance: 0.5 }, { resistance: 2.0, reactance: 0.5 },
{ resistance: 2.5, reactance: 0.4 }, { resistance: 3.5, reactance: 0.0 },
{ resistance: 4.5, reactance: -0.5 }, { resistance: 5.0, reactance: -1.0 }
],
name: 'Transmission1',
reactance: 'reactance', resistance: 'resistance',
points: [{ resistance: 0, reactance: 0.15 }, { resistance: 0, reactance: 0.15 },
{ resistance: 0, reactance: 0.15 }, { resistance: 0.3, reactance: 0.2 },
{ resistance: 0.3, reactance: 0.2 }, { resistance: 0.3, reactance: 0.2 },
{ resistance: 0.5, reactance: 0.4 }, { resistance: 1.0, reactance: 0.8 },
{ resistance: 2.5, reactance: 1.3 }, { resistance: 3.5, reactance: 1.6 },
{ resistance: 3.5, reactance: 1.6 }, { resistance: 3.5, reactance: 1.6 },
{ resistance: 4.5, reactance: 2.0 }, { resistance: 6.0, reactance: 4.5 },
{ resistance: 8, reactance: 6 }, { resistance: 10, reactance: 25 }],
name2: 'Transmission2'
}
}
}
</script>Add title to Smith chart
The following Smith Chart APIs control the chart title:
<template>
<div class="control_wrapper">
<ejs-smithchart id="smithchart" :title='title'>
<e-seriesCollection>
<e-series :dataSource='dataSource' :name='name' :reactance='reactance' :resistance='resistance'></e-series>
<e-series :points='points' :name='name2'></e-series>
</e-seriesCollection>
</ejs-smithchart>
</div>
</template>
<script>
import { SmithchartComponent, SeriesDirective, SeriesCollectionDirective } from "@syncfusion/ej2-vue-charts";
export default {
name: "App",
components: {
'ejs-smithchart': SmithchartComponent,
'e-series': SeriesDirective,
'e-seriesCollection': SeriesCollectionDirective
},
data: function () {
return {
title: { text: 'Transmission lines applied for both impedance and admittance' },
dataSource: [
{ resistance: 0, reactance: 0.05 }, { resistance: 0, reactance: 0.05 },
{ resistance: 0.3, reactance: 0.1 }, { resistance: 0.5, reactance: 0.2 },
{ resistance: 1.5, reactance: 0.5 }, { resistance: 2.0, reactance: 0.5 },
{ resistance: 2.5, reactance: 0.4 }, { resistance: 3.5, reactance: 0.0 },
{ resistance: 4.5, reactance: -0.5 }, { resistance: 5.0, reactance: -1.0 }
],
name: 'Transmission1',
reactance: 'reactance', resistance: 'resistance',
points: [{ resistance: 0, reactance: 0.15 }, { resistance: 0, reactance: 0.15 },
{ resistance: 0, reactance: 0.15 }, { resistance: 0.3, reactance: 0.2 },
{ resistance: 0.3, reactance: 0.2 }, { resistance: 0.3, reactance: 0.2 },
{ resistance: 0.5, reactance: 0.4 }, { resistance: 1.0, reactance: 0.8 },
{ resistance: 2.5, reactance: 1.3 }, { resistance: 3.5, reactance: 1.6 },
{ resistance: 3.5, reactance: 1.6 }, { resistance: 3.5, reactance: 1.6 },
{ resistance: 4.5, reactance: 2.0 }, { resistance: 6.0, reactance: 4.5 },
{ resistance: 8, reactance: 6 }, { resistance: 10, reactance: 25 }],
name2: 'Transmission2'
}
}
}
</script>Enable marker to the Smith chart
To enable and customize markers for a series, use the series marker API. Set the marker’s visible property to true for the series that should display markers. The following sample enables the marker for the first series only.
<template>
<div class="control_wrapper">
<ejs-smithchart id="smithchart" :title='title'>
<e-seriesCollection>
<e-series :dataSource='dataSource' :name='name' :reactance='reactance' :resistance='resistance'
:marker='marker'></e-series>
<e-series :points='points' :name='name2'></e-series>
</e-seriesCollection>
</ejs-smithchart>
</div>
</template>
<script>
import { SmithchartComponent, SeriesDirective, SeriesCollectionDirective } from "@syncfusion/ej2-vue-charts";
export default {
name: "App",
components: {
'ejs-smithchart': SmithchartComponent,
'e-series': SeriesDirective,
'e-seriesCollection': SeriesCollectionDirective
},
data: function () {
return {
title: { text: 'Transmission lines applied for both impedance and admittance' },
dataSource: [
{ resistance: 0, reactance: 0.05 }, { resistance: 0, reactance: 0.05 },
{ resistance: 0.3, reactance: 0.1 }, { resistance: 0.5, reactance: 0.2 },
{ resistance: 1.5, reactance: 0.5 }, { resistance: 2.0, reactance: 0.5 },
{ resistance: 2.5, reactance: 0.4 }, { resistance: 3.5, reactance: 0.0 },
{ resistance: 4.5, reactance: -0.5 }, { resistance: 5.0, reactance: -1.0 }
],
name: 'Transmission1',
reactance: 'reactance', resistance: 'resistance',
marker: {
visible: true
},
points: [{ resistance: 0, reactance: 0.15 }, { resistance: 0, reactance: 0.15 },
{ resistance: 0, reactance: 0.15 }, { resistance: 0.3, reactance: 0.2 },
{ resistance: 0.3, reactance: 0.2 }, { resistance: 0.3, reactance: 0.2 },
{ resistance: 0.5, reactance: 0.4 }, { resistance: 1.0, reactance: 0.8 },
{ resistance: 2.5, reactance: 1.3 }, { resistance: 3.5, reactance: 1.6 },
{ resistance: 3.5, reactance: 1.6 }, { resistance: 3.5, reactance: 1.6 },
{ resistance: 4.5, reactance: 2.0 }, { resistance: 6.0, reactance: 4.5 },
{ resistance: 8, reactance: 6 }, { resistance: 10, reactance: 25 }],
name2: 'Transmission2'
}
}
}
</script>Enable data label to marker
To display and customize data labels on markers, use the marker dataLabel settings. Set the data label’s visible property to true within the series marker configuration. The following sample enables data labels for the first series marker.
<template>
<div class="control_wrapper">
<ejs-smithchart id="smithchart" :title='title'>
<e-seriesCollection>
<e-series :dataSource='dataSource' :name='name' :reactance='reactance'
:resistance='resistance' :marker='marker'></e-series>
<e-series :points='points' :name='name2'></e-series>
</e-seriesCollection>
</ejs-smithchart>
</div>
</template>
<script>
import { SmithchartComponent, SeriesDirective, SeriesCollectionDirective } from "@syncfusion/ej2-vue-charts";
export default {
name: "App",
components: {
'ejs-smithchart': SmithchartComponent,
'e-series': SeriesDirective,
'e-seriesCollection': SeriesCollectionDirective
},
data: function () {
return {
title: { text: 'Transmission lines applied for both impedance and admittance' },
dataSource: [
{ resistance: 0, reactance: 0.05 }, { resistance: 0, reactance: 0.05 },
{ resistance: 0.3, reactance: 0.1 }, { resistance: 0.5, reactance: 0.2 },
{ resistance: 1.5, reactance: 0.5 }, { resistance: 2.0, reactance: 0.5 },
{ resistance: 2.5, reactance: 0.4 }, { resistance: 3.5, reactance: 0.0 },
{ resistance: 4.5, reactance: -0.5 }, { resistance: 5.0, reactance: -1.0 }
],
name: 'Transmission1',
reactance: 'reactance', resistance: 'resistance',
marker: {
visible: true,
dataLabel: {
visible: true
}
},
points: [{ resistance: 0, reactance: 0.15 }, { resistance: 0, reactance: 0.15 },
{ resistance: 0, reactance: 0.15 }, { resistance: 0.3, reactance: 0.2 },
{ resistance: 0.3, reactance: 0.2 }, { resistance: 0.3, reactance: 0.2 },
{ resistance: 0.5, reactance: 0.4 }, { resistance: 1.0, reactance: 0.8 },
{ resistance: 2.5, reactance: 1.3 }, { resistance: 3.5, reactance: 1.6 },
{ resistance: 3.5, reactance: 1.6 }, { resistance: 3.5, reactance: 1.6 },
{ resistance: 4.5, reactance: 2.0 }, { resistance: 6.0, reactance: 4.5 },
{ resistance: 8, reactance: 6 }, { resistance: 10, reactance: 25 }],
name2: 'Transmission2'
}
}
}
</script>Enable legend for Smith chart
The legend displays series identifiers. Inject the SmithchartLegend module using the provide option and enable the legend by setting the visible property to true in legendSettings. Series names can be customized using the series name property.
<template>
<div class="control_wrapper">
<ejs-smithchart id="smithchart" :title='title' :legendSettings='legendSettings'>
<e-seriesCollection>
<e-series :dataSource='dataSource' :name='name' :reactance='reactance'
:resistance='resistance' :marker='marker'></e-series>
<e-series :points='points' :name='name2'></e-series>
</e-seriesCollection>
</ejs-smithchart>
</div>
</template>
<script>
import { SmithchartComponent, SeriesDirective, SeriesCollectionDirective, SmithchartLegend } from "@syncfusion/ej2-vue-charts";
export default {
name: "App",
components: {
'ejs-smithchart': SmithchartComponent,
'e-series': SeriesDirective,
'e-seriesCollection': SeriesCollectionDirective
},
data: function () {
return {
title: { text: 'Transmission lines applied for both impedance and admittance' },
legendSettings: {
visible: true
},
dataSource: [
{ resistance: 0, reactance: 0.05 }, { resistance: 0, reactance: 0.05 },
{ resistance: 0.3, reactance: 0.1 }, { resistance: 0.5, reactance: 0.2 },
{ resistance: 1.5, reactance: 0.5 }, { resistance: 2.0, reactance: 0.5 },
{ resistance: 2.5, reactance: 0.4 }, { resistance: 3.5, reactance: 0.0 },
{ resistance: 4.5, reactance: -0.5 }, { resistance: 5.0, reactance: -1.0 }
],
name: 'Transmission1',
reactance: 'reactance', resistance: 'resistance',
marker: {
visible: true,
dataLabel: {
visible: true
}
},
points: [{ resistance: 0, reactance: 0.15 }, { resistance: 0, reactance: 0.15 },
{ resistance: 0, reactance: 0.15 }, { resistance: 0.3, reactance: 0.2 },
{ resistance: 0.3, reactance: 0.2 }, { resistance: 0.3, reactance: 0.2 },
{ resistance: 0.5, reactance: 0.4 }, { resistance: 1.0, reactance: 0.8 },
{ resistance: 2.5, reactance: 1.3 }, { resistance: 3.5, reactance: 1.6 },
{ resistance: 3.5, reactance: 1.6 }, { resistance: 3.5, reactance: 1.6 },
{ resistance: 4.5, reactance: 2.0 }, { resistance: 6.0, reactance: 4.5 },
{ resistance: 8, reactance: 6 }, { resistance: 10, reactance: 25 }],
name2: 'Transmission2'
}
},
provide: {
smithchart: [SmithchartLegend]
}
}
</script>Enable tooltip for the Smith chart series
Tooltips show point values on hover. Inject the TooltipRender module using the provide option and enable tooltips by setting visible to true in tooltipSettings. The following sample shows tooltip configuration for the Smith Chart series collection.
<template>
<div class="control_wrapper">
<ejs-smithchart id="smithchart" :title='title' :legendSettings='legendSettings'>
<e-seriesCollection>
<e-series :dataSource='dataSource' :tooltip='tooltip' :name='name' :reactance='reactance'
:resistance='resistance' :marker='marker'></e-series>
<e-series :points='points' :name='name2' :tooltip='tooltip2'></e-series>
</e-seriesCollection>
</ejs-smithchart>
</div>
</template>
<script>
import { SmithchartComponent, SeriesDirective, SeriesCollectionDirective, SmithchartLegend, TooltipRender } from "@syncfusion/ej2-vue-charts";
export default {
name: "App",
components: {
'ejs-smithchart': SmithchartComponent,
'e-series': SeriesDirective,
'e-seriesCollection': SeriesCollectionDirective
},
data: function () {
return {
title: { text: 'Transmission lines applied for both impedance and admittance' },
legendSettings: {
visible: true
},
dataSource: [
{ resistance: 0, reactance: 0.05 }, { resistance: 0, reactance: 0.05 },
{ resistance: 0.3, reactance: 0.1 }, { resistance: 0.5, reactance: 0.2 },
{ resistance: 1.5, reactance: 0.5 }, { resistance: 2.0, reactance: 0.5 },
{ resistance: 2.5, reactance: 0.4 }, { resistance: 3.5, reactance: 0.0 },
{ resistance: 4.5, reactance: -0.5 }, { resistance: 5.0, reactance: -1.0 }
],
name: 'Transmission1',
reactance: 'reactance', resistance: 'resistance',
tooltip: {
visible: true
},
marker: {
visible: true,
dataLabel: {
visible: true
}
},
points: [{ resistance: 0, reactance: 0.15 }, { resistance: 0, reactance: 0.15 },
{ resistance: 0, reactance: 0.15 }, { resistance: 0.3, reactance: 0.2 },
{ resistance: 0.3, reactance: 0.2 }, { resistance: 0.3, reactance: 0.2 },
{ resistance: 0.5, reactance: 0.4 }, { resistance: 1.0, reactance: 0.8 },
{ resistance: 2.5, reactance: 1.3 }, { resistance: 3.5, reactance: 1.6 },
{ resistance: 3.5, reactance: 1.6 }, { resistance: 3.5, reactance: 1.6 },
{ resistance: 4.5, reactance: 2.0 }, { resistance: 6.0, reactance: 4.5 },
{ resistance: 8, reactance: 6 }, { resistance: 10, reactance: 25 }],
name2: 'Transmission2',
tooltip2: {
visible: true
}
}
},
provide: {
smithchart: [SmithchartLegend, TooltipRender]
}
}
</script>