Getting Started with Vue Sankey
12 Aug 202610 minutes to read
This article provides a step-by-step guide to setting up a Vite project using JavaScript and integrating the Syncfusion® Vue Sankey Chart component with either the Composition API or the Options API. The Sankey Chart visualizes the flow of values between source and target nodes, which is useful for representing energy, budget, or material transfers.
The Composition API groups related logic into reusable functions and is recommended for larger, composition-friendly code bases. The Options API uses data, methods, and life cycle options and may be preferable for smaller components or teams familiar with Vue 2 patterns. Choose the API that best fits your project’s structure and long-term maintainability.
Prerequisites
Ensure your development environment meets the following requirements as listed in System requirements for Syncfusion® Vue UI components.
Set Up the Vite Project
Create a Vite project using either npm or Yarn.
npm
npm create vite@latest my-app -- --template vueyarn
yarn create vite my-app --template vueIf Vite prompts you to install dependencies and start the project immediately, select No. The Syncfusion package is installed in a later step.
Navigate to the project directory:
cd my-appInstall the project dependencies using either npm or Yarn.
npm
npm installyarn
yarn installNow that my-app is ready, add Syncfusion® Vue components to the project. Remove the default HelloWorld/App.vue boilerplate before continuing, so that the file only contains the code shown in the next steps.
Note: To create a TypeScript project, use
npm create vite@latest my-app -- --template vue-tsoryarn create vite my-app --template vue-ts.
Add Syncfusion® Vue Packages
Syncfusion® Vue component packages are available at npmjs.com. To use Syncfusion® Vue components in the project, install the corresponding npm package.
This article uses the Vue Sankey Chart component as an example. To use the Vue Sankey Chart component in the project, install the @syncfusion/ej2-vue-charts package using either npm or Yarn. The package is compatible with Vue 3.0 and later versions.
npm
npm install @syncfusion/ej2-vue-chartsyarn
yarn add @syncfusion/ej2-vue-chartsNote: For TypeScript support, refer to Getting Started with Vue UI Components using Composition API and TypeScript or Getting Started with Vue UI Components using Options API and TypeScript.
Add Syncfusion® Vue Sankey Chart Component
Follow the steps below to add the Vue Sankey Chart component using the Composition API or Options API:
Step 1: First, import and register the Sankey Chart component and its child directives in the script section of src/App.vue. If using the Composition API, add the setup attribute to the script tag.
<script setup>
import {
  SankeyComponent as EjsSankey,
  SankeyNodesCollectionDirective as ESankeyNodesCollection,
  SankeyNodeDirective as ESankeyNode,
  SankeyLinksCollectionDirective as ESankeyLinksCollection,
  SankeyLinkDirective as ESankeyLink,
} from "@syncfusion/ej2-vue-charts";

</script><script>
import {
SankeyComponent,
SankeyNodesCollectionDirective,
SankeyNodeDirective,
SankeyLinksCollectionDirective,
SankeyLinkDirective
} from "@syncfusion/ej2-vue-charts";
export default {
name: "App",
components: {
EjsSankey,
ESankeyNodesCollection,
ESankeyNode,
ESankeyLinksCollection,
ESankeyLink
},
};
</script>Step 2: In the template section, define the Sankey Chart component with nodes and links:
<template>
      <EjsSankey
        width="90%"
        height="450px"
      >
        <ESankeyNodesCollection>
          <ESankeyNode id="Agricultural Waste" />
          <ESankeyNode id="Biomass Residues" />
          <ESankeyNode id="Bio-conversion" />
          <ESankeyNode id="Liquid Biofuel" />
          <ESankeyNode id="Electricity" />
          <ESankeyNode id="Heat" />
        </ESankeyNodesCollection>
        <ESankeyLinksCollection>
          <ESankeyLink sourceId="Agricultural Waste" targetId="Bio-conversion" :value="84.152" />
          <ESankeyLink sourceId="Biomass Residues"   targetId="Bio-conversion" :value="24.152" />
          <ESankeyLink sourceId="Bio-conversion"     targetId="Liquid Biofuel" :value="10.597" />
          <ESankeyLink sourceId="Bio-conversion"     targetId="Electricity"    :value="36.862" />
          <ESankeyLink sourceId="Bio-conversion"     targetId="Heat"           :value="60.845" />
        </ESankeyLinksCollection>
      </EjsSankey>
</template>
Here is the complete summarized code for the src/App.vue file:
<template>
      <EjsSankey
        width="90%"
        height="450px"
      >
        <ESankeyNodesCollection>
          <ESankeyNode id="Agricultural Waste" />
          <ESankeyNode id="Biomass Residues" />
          <ESankeyNode id="Bio-conversion" />
          <ESankeyNode id="Liquid Biofuel" />
          <ESankeyNode id="Electricity" />
          <ESankeyNode id="Heat" />
        </ESankeyNodesCollection>
        <ESankeyLinksCollection>
          <ESankeyLink sourceId="Agricultural Waste" targetId="Bio-conversion" :value="84.152" />
          <ESankeyLink sourceId="Biomass Residues" targetId="Bio-conversion" :value="24.152" />
          <ESankeyLink sourceId="Bio-conversion" targetId="Liquid Biofuel" :value="10.597" />
          <ESankeyLink sourceId="Bio-conversion" targetId="Electricity" :value="36.862" />
          <ESankeyLink sourceId="Bio-conversion" targetId="Heat" :value="60.845" />
        </ESankeyLinksCollection>
      </EjsSankey>
</template>

<script setup>
import {
  SankeyComponent as EjsSankey,
  SankeyNodesCollectionDirective as ESankeyNodesCollection,
  SankeyNodeDirective as ESankeyNode,
  SankeyLinksCollectionDirective as ESankeyLinksCollection,
  SankeyLinkDirective as ESankeyLink,
} from "@syncfusion/ej2-vue-charts";

</script><template>
<ejs-sankey
width="90%"
height="450px"
>
<e-sankey-nodes-collection>
<e-sankey-node id="Agricultural Waste" />
<e-sankey-node id="Biomass Residues" />
<e-sankey-node id="Bio-conversion" />
<e-sankey-node id="Liquid Biofuel" />
<e-sankey-node id="Electricity" />
<e-sankey-node id="Heat" />
</e-sankey-nodes-collection>
<e-sankey-links-collection>
<e-sankey-link sourceId="Agricultural Waste" targetId="Bio-conversion" :value="84.152" />
<e-sankey-link sourceId="Biomass Residues" targetId="Bio-conversion" :value="24.152" />
<e-sankey-link sourceId="Bio-conversion" targetId="Liquid Biofuel" :value="10.597" />
<e-sankey-link sourceId="Bio-conversion" targetId="Electricity" :value="36.862" />
<e-sankey-link sourceId="Bio-conversion" targetId="Heat" :value="60.845" />
</e-sankey-links-collection>
</ejs-sankey>
</template>
<script>
import {
SankeyComponent,
SankeyNodesCollectionDirective,
SankeyNodeDirective,
SankeyLinksCollectionDirective,
SankeyLinkDirective,
} from "@syncfusion/ej2-vue-charts";
export default {
name: "App",
data() {
return {
};
},
components: {
"ejs-sankey": SankeyComponent,
"e-sankey-nodes-collection": SankeyNodesCollectionDirective,
"e-sankey-node": SankeyNodeDirective,
"e-sankey-links-collection": SankeyLinksCollectionDirective,
"e-sankey-link": SankeyLinkDirective
},
};
</script>Run the Project
To run the project, use the following command:
npm
npm run devyarn
yarn run devThe development server will start and display a message with the port number (typically http://localhost:5173). Open your browser and navigate to this URL to view the Sankey Chart.
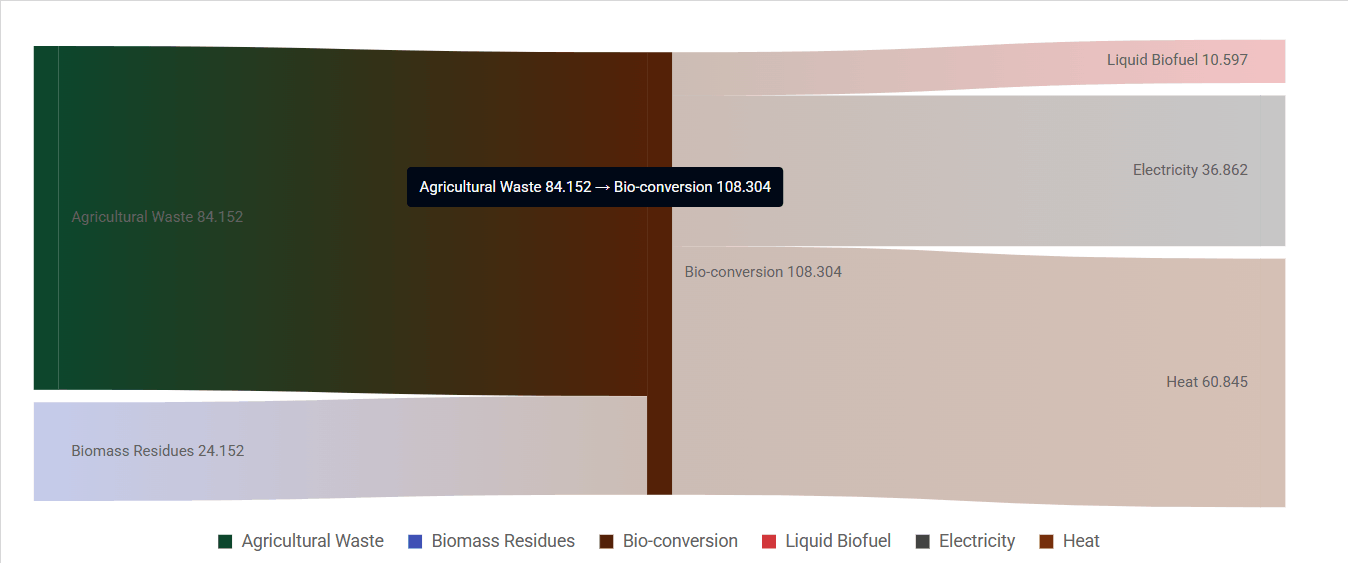
The output will appear as follows:
Troubleshooting
The following are common issues and solutions when integrating the Sankey Chart component:
-
Chart not rendering: Ensure that
SankeyComponentand the node/link directives are imported and registered correctly. Verify that both nodes and links are defined with matchingid,sourceId, andtargetIdvalues. -
Module import errors: Confirm that all required modules are imported from
@syncfusion/ej2-vue-chartsand that the component is registered correctly with proper directive naming. -
Data not displaying: Verify that the links data structure includes
sourceId,targetId, andvalueproperties. Each link must reference valid node IDs to display correctly. -
Version mismatch: Confirm that the
@syncfusion/ej2-vue-chartspackage version is compatible with Vue 3.0+ used in your project. Install the latest compatible version if needed.