How can I help you?
Getting Started with the Vue Accumulation chart Component in Vue 2
19 Mar 20266 minutes to read
This article provides a step-by-step guide for setting up a Vue 2 project using Vue-CLI and integrating the Syncfusion® Vue Accumulation chart component.
Prerequisites
System requirements for Syncfusion® Vue UI components
Dependencies
The following minimum dependencies are required to use the Accumulation Chart:
|- @syncfusion/ej2-vue-charts
- @syncfusion/ej2-charts
- @syncfusion/ej2-base
- @syncfusion/ej2-data
- @syncfusion/ej2-svg-base
Setting up the Vue 2 project
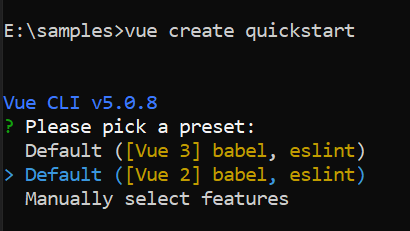
To generate a Vue 2 project using Vue-CLI, use the vue create command. Follow these steps to install Vue CLI and create a new project:
npm install -g @vue/cli
vue create quickstart
cd quickstart
npm run serve
or
yarn global add @vue/cli
vue create quickstart
cd quickstart
yarn run serve
When creating a new project, choose the option Default ([Vue 2] babel, eslint) from the menu.
Once the quickstart project is set up with default settings, proceed to add Syncfusion® components to the project.
Add Syncfusion® Vue packages
Syncfusion® packages are available at npmjs.com. To use Vue components, install the required npm package.
This article uses the Vue Accumulation chart component as an example. Install the @syncfusion/ej2-vue-charts package by running:
npm install @syncfusion/ej2-vue-chartsor
yarn add @syncfusion/ej2-vue-chartsNote: npm v5+ saves packages to
dependenciesby default;--saveis not required.
Add Syncfusion® Vue component
Follow the steps below to add the Vue Accumulation chart component (Options API for Vue 2):
- First, import and register the Accumulation chart component in the
scriptsection of the src/App.vue file.
<script>
import { AccumulationChartComponent, AccumulationSeriesCollectionDirective, AccumulationSeriesDirective, PieSeries } from "@syncfusion/ej2-vue-charts";
export default {
  components: {
    'ejs-accumulationchart': AccumulationChartComponent,
    'e-accumulation-series-collection': AccumulationSeriesCollectionDirective,
    'e-accumulation-series': AccumulationSeriesDirective
  },

  provide: {
    accumulationchart: [PieSeries]
  }
}

</script>- In the
templatesection, define the Accumulation chart component with thedataSourceproperty.
<template>
    <div id="app" style="height: 400px;">
         <ejs-accumulationchart id="container">
            <e-accumulation-series-collection>
                <e-accumulation-series :dataSource='seriesData' xName='x' yName='y' type='Pie'> </e-accumulation-series>
            </e-accumulation-series-collection>
        </ejs-accumulationchart>
    </div>
</template>- Declare the value for the
dataSourceproperty in thescriptsection.
Ensure that seriesData is defined as an array of objects. Replace the placeholder data reference in the example with the actual data array (see the example include below for a complete seriesData definition).
<script>
data() {
  return {
    seriesData: [
      { x: 'Chrome', y: 62 },
      { x: 'Edge',   y: 18 },
      { x: 'Safari', y: 12 },
      { x: 'Firefox',y: 8  }
    ]
  };
}
</script>
Adding the accumulation chart
- Use the
<ejs-accumulationchart>selector in the template section ofApp.vueto add an accumulation chart.
The example below shows a basic pie series.
By default, a pie series is rendered when JSON data is assigned to the series using the dataSource property. Map the field names in the JSON data to the xName and yName properties of the series.
<template>
  <div id="app">
    <ejs-accumulationchart id="container">
      <e-accumulation-series-collection>
        <e-accumulation-series :dataSource='seriesData' xName='x' yName='y'> </e-accumulation-series>
      </e-accumulation-series-collection>
    </ejs-accumulationchart>
  </div>
</template>
<script>
import { AccumulationChartComponent, AccumulationSeriesCollectionDirective, AccumulationSeriesDirective, PieSeries } from "@syncfusion/ej2-vue-charts";
import { data } from "./data.ts";

export default {
  name: "App",
  components: {
    'ejs-accumulationchart': AccumulationChartComponent,
    'e-accumulation-series-collection': AccumulationSeriesCollectionDirective,
    'e-accumulation-series': AccumulationSeriesDirective
  },
  data() {
    return {
      seriesData: data
    };
  },
  provide: {
    accumulationchart: [PieSeries]
  }
};
</script>
<style>
#container {
  height: 350px;
}
</style>Verify the chart
After starting the dev server, confirm the accumulation chart renders correctly:
- Start the dev server with
npm run serveoryarn run serve. - Open the project URL shown in the terminal (typically
http://localhost:8080) and verify the chart displays as expected. - If the chart does not render, inspect the browser console for errors related to missing modules, incorrect imports, or undefined data values.
Troubleshooting (common issues)
- Chart not rendering: ensure the accumulation series and related modules are registered and that
seriesDatacontains a valid array of data objects. - Undefined
datareference: replace placeholder values with an explicit array (for example, an array of{ x: 'Category', y: 10 }objects). - Version mismatch: confirm
@syncfusion/ej2-vue-chartsis compatible with the project’s Vue version.
Run the project
To run the project, use the following command:
npm run serveor
yarn run serve