Getting started with the Vue 3D chart component in Vue 3
19 Mar 20267 minutes to read
This article provides a step-by-step guide for setting up a Vite project with JavaScript and integrating the Syncfusion® Vue 3D Chart component using either the Composition API or the Options API.
The Composition API, introduced in Vue 3, organizes related logic into reusable composition functions and is recommended for larger or composition-oriented code bases. The Options API organizes component logic with data, methods, and life cycle hooks and may be preferable for smaller components or teams familiar with Vue 2 patterns.
Prerequisites
System requirements for Syncfusion® Vue UI components
Set up the Vite project
A recommended approach for beginning with Vue is to scaffold a project using Vite. To create a new Vite project, use one of the commands that are specific to either NPM or Yarn.
npm create vite@latestor
yarn create viteUsing one of the above commands starts an interactive setup. Follow these steps:
- Define the project name. For this article use
my-project.
? Project name: » my-project- Select
Vueas the framework to create a Vue 3 project.
? Select a framework: » - Use arrow-keys. Return to submit.
Vanilla
> Vue
  React
  Preact
  Lit
  Svelte
Others- Choose
JavaScriptas the project variant.
? Select a variant: » - Use arrow-keys. Return to submit.
> JavaScript
  TypeScript
  Customize with create-vue ↗
Nuxt ↗- After creating the project, install dependencies by running:
cd my-project
npm install
or
cd my-project
yarn install
Now that my-project is ready with default settings, add Syncfusion® Vue components to the project.
Add Syncfusion® Vue packages
Syncfusion® Vue component packages are available at npmjs.com. To use Syncfusion® Vue components in the project, install the corresponding npm package.
This article uses the Vue 3D Chart component as an example. Install the @syncfusion/ej2-vue-charts package with:
npm install @syncfusion/ej2-vue-chartsor
yarn add @syncfusion/ej2-vue-chartsNote: npm v5+ saves packages to
dependenciesby default;--saveis not required.
Add Syncfusion® Vue component
Follow the steps below to add the Vue 3D Chart component using the Composition API or Options API.
- Import and register the 3D Chart component, its child directives, and required modules in the
scriptsection of src/App.vue.
Important: When using Composition API, also importprovidefrom ‘vue’ and inject the modules — this is required or the series will not render.
<script setup>
import { provide } from 'vue';
import {
  Chart3DComponent,
  Chart3DSeriesCollectionDirective,
  Chart3DSeriesDirective,
  ColumnSeries3D,
  Category3D
} from "@syncfusion/ej2-vue-charts";

let seriesData = [
    { month: 'Jan', sales: 35 }, { month: 'Feb', sales: 28 },
    { month: 'Mar', sales: 34 }, { month: 'Apr', sales: 32 },
    { month: 'May', sales: 40 }, { month: 'Jun', sales: 32 },
    { month: 'Jul', sales: 35 }, { month: 'Aug', sales: 55 },
    { month: 'Sep', sales: 38 }, { month: 'Oct', sales: 30 },
    { month: 'Nov', sales: 25 }, { month: 'Dec', sales: 32 }
];

let title = 'Sales Analysis';
let primaryXAxis = { valueType: 'Category' };

provide('chart3d', [ColumnSeries3D, Category3D]);
</script><script>
import {
Chart3DComponent,
Chart3DSeriesCollectionDirective,
Chart3DSeriesDirective,
ColumnSeries3D,
Category3D
} from '@syncfusion/ej2-vue-charts';
export default {
name: "App",
components: {
'ejs-chart3d' : Chart3DComponent,
'e-chart3d-series-collection': Chart3DSeriesCollectionDirective,
'e-chart3d-series' : Chart3DSeriesDirective
},
data() {
return {
seriesData: [
{ month: 'Jan', sales: 35 }, { month: 'Feb', sales: 28 },
{ month: 'Mar', sales: 34 }, { month: 'Apr', sales: 32 },
{ month: 'May', sales: 40 }, { month: 'Jun', sales: 32 },
{ month: 'Jul', sales: 35 }, { month: 'Aug', sales: 55 },
{ month: 'Sep', sales: 38 }, { month: 'Oct', sales: 30 },
{ month: 'Nov', sales: 25 }, { month: 'Dec', sales: 32 }
],
title: 'Sales Analysis',
primaryXAxis: { valueType: 'Category' }
};
},
provide: {
chart3d: [ColumnSeries3D, Category3D]
}
};
</script>Critical – Do not skip this step
You must provide the required modules (ColumnSeries3D,Category3D, etc.) usingprovide.
If you forget → the chart container appears empty (no bars/series visible), usually with no console error.
This is the most common reason the 3D Chart fails to display data in Vue 3 projects.Run the project
To run the project, use the following command:
npm run devor
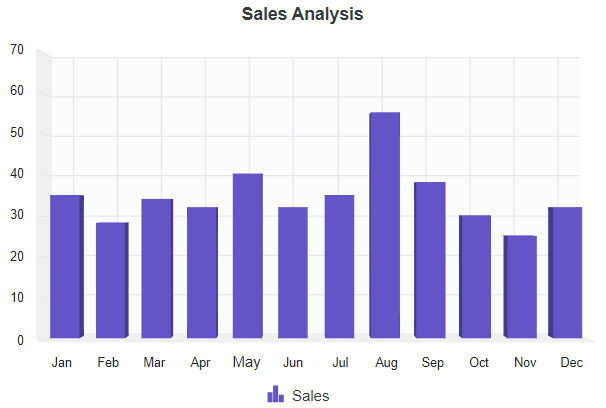
yarn run devThe output will appear as follows:
Verify the chart
After starting the development server, confirm the chart renders correctly:
- Start the development server with
npm run devoryarn run dev. - Open the project URL shown in the terminal (commonly
http://localhost:5173) and verify the chart displays. - If the chart does not render, open the browser console and check for errors related to missing modules, incorrect imports, or incompatible Vue versions.
Troubleshooting (common issues)
- Chart not rendering: ensure chart modules (for example,
ColumnSeries3D,Category3D,Legend3D,Tooltip) are provided viaprovide(Composition API) orprovide/provide:(Options API). - Wrong package version: confirm
@syncfusion/ej2-vue-chartsmatches the project’s Vue version. - Missing child directives: ensure
Chart3DSeriesCollectionDirectiveandChart3DSeriesDirectiveare registered when using directives. - Console errors: inspect import paths and verify dependencies are installed.
Sample:
vue-3-3d-chart-getting-started.
For migrating from Vue 2 to Vue 3, refer to themigrationdocumentation.