Getting Started with Vue Accumulation Chart
12 Aug 20268 minutes to read
This article provides a step-by-step guide for setting up a Vue 2 project using Vue CLI and integrating the Syncfusion® Vue Accumulation Chart component.
Prerequisites
Ensure your development environment meets the following requirements as listed in System requirements for Syncfusion® Vue UI components.
Dependencies
The Accumulation Chart component is available in the @syncfusion/ej2-vue-charts package. The following dependencies are used by the package:
|-- @syncfusion/ej2-vue-charts
    |-- @syncfusion/ej2-base
    |-- @syncfusion/ej2-data
    |-- @syncfusion/ej2-pdf-export
    |-- @syncfusion/ej2-file-utils
    |-- @syncfusion/ej2-compression
    |-- @syncfusion/ej2-charts
    |-- @syncfusion/ej2-vue-base
    |-- @syncfusion/ej2-svg-base
Setting Up the Vue 2 Project
To generate a Vue 2 project using Vue CLI, use the vue create command. You can install Vue CLI using either npm or Yarn:
npm
npm install -g @vue/cli
vue create quickstart
yarn
yarn global add @vue/cli
vue create quickstart
Select Default ([Vue 2] babel, eslint) when prompted.
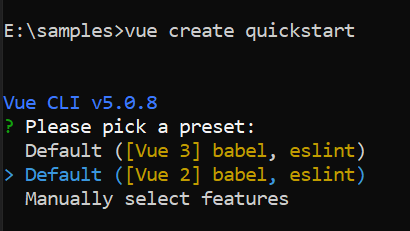
Once the quickstart project is set up with default settings, navigate to the project directory:
cd quickstartNow, proceed to add Syncfusion® packages to the project.
Add Syncfusion® Vue Packages
Syncfusion® packages are available at npmjs.com. To use Vue components, install the required npm package.
This article uses the Vue Accumulation Chart component as an example. Install the @syncfusion/ej2-vue-charts package using either npm or Yarn:
npm
npm install @syncfusion/ej2-vue-chartsyarn
yarn add @syncfusion/ej2-vue-chartsNote: npm v5+ saves packages to
dependenciesby default;--saveis not required.
Add Syncfusion® Vue Accumulation Chart Component
Follow the steps below to add the Vue Accumulation Chart component (Options API for Vue 2):
Step 1: First, import and register the Accumulation Chart component in the script section of the src/App.vue file.
<script>
import { AccumulationChartComponent, AccumulationSeriesCollectionDirective, AccumulationSeriesDirective, PieSeries } from "@syncfusion/ej2-vue-charts";
export default {
  components: {
    'ejs-accumulationchart': AccumulationChartComponent,
    'e-accumulation-series-collection': AccumulationSeriesCollectionDirective,
    'e-accumulation-series': AccumulationSeriesDirective
  },

  provide: {
    accumulationchart: [PieSeries]
  }
}
</script>
Step 2: Declare the data for the dataSource property in the script section.
Define seriesData as an array of objects containing the category values (x) and numeric values (y) to be displayed in the chart.
<script>
export default {
  data() {
    return {
      seriesData: [
          { x: 'Jan', y: 3 }, { x: 'Feb', y: 3.5 },
          { x: 'Mar', y: 7 }, { x: 'Apr', y: 13.5 },
          { x: 'May', y: 19 }, { x: 'Jun', y: 23.5 },
          { x: 'Jul', y: 26 }, { x: 'Aug', y: 25 },
          { x: 'Sep', y: 21 }, { x: 'Oct', y: 15 },
          { x: 'Nov', y: 9 }, { x: 'Dec', y: 3.5 }
      ],
    };
  }
}
</script>
Step 3: In the template section, define the Accumulation Chart component with the dataSource property.
<template>
    <div>
         <ejs-accumulationchart id="container">
            <e-accumulation-series-collection>
                <e-accumulation-series :dataSource='seriesData' xName='x' yName='y'> </e-accumulation-series>
            </e-accumulation-series-collection>
        </ejs-accumulationchart>
    </div>
</template>
Complete Example
Here is the summarized code for the above steps in the src/App.vue file:
The example below shows a basic pie series.
By default, a pie series is rendered when JSON data is assigned to the series using the dataSource property. Map the field names in the JSON data to the xName and yName properties of the series.
<template>
  <div id="app">
    <ejs-accumulationchart id="container">
      <e-accumulation-series-collection>
        <e-accumulation-series :dataSource='seriesData' xName='x' yName='y'> </e-accumulation-series>
      </e-accumulation-series-collection>
    </ejs-accumulationchart>
  </div>
</template>
<script>
import { AccumulationChartComponent, AccumulationSeriesCollectionDirective, AccumulationSeriesDirective, PieSeries } from "@syncfusion/ej2-vue-charts";

export default {
  name: "App",
  components: {
    'ejs-accumulationchart': AccumulationChartComponent,
    'e-accumulation-series-collection': AccumulationSeriesCollectionDirective,
    'e-accumulation-series': AccumulationSeriesDirective
  },
  data() {
    return {
      seriesData: [
                { x: 'Jan', y: 3 }, { x: 'Feb', y: 3.5 },
                { x: 'Mar', y: 7 }, { x: 'Apr', y: 13.5 },
                { x: 'May', y: 19 }, { x: 'Jun', y: 23.5 },
                { x: 'Jul', y: 26 }, { x: 'Aug', y: 25 },
                { x: 'Sep', y: 21 }, { x: 'Oct', y: 15 },
                { x: 'Nov', y: 9 }, { x: 'Dec', y: 3.5 }
            ],
    };
  },
  provide: {
    accumulationchart: [PieSeries]
  }
};
</script>
<style>
#container {
  height: 350px;
}
</style>
Run the Project
To start the development server, use either npm or Yarn:
npm
npm run serveyarn
yarn run serveOpen your browser and navigate to http://localhost:8080. Verify that the pie chart displays with the sample data.
Troubleshooting
The following are common issues and solutions when integrating the Accumulation Chart component:
-
Chart not rendering: Ensure that the required accumulation series modules are registered in the
provideoption and thatseriesDatais defined as a valid array of data objects withxandyproperties. -
Undefined
seriesDatareference: Verify thatseriesDatais defined in thedata()function and follows the correct format:{ x: 'Category', y: Value }. -
Module import errors: Confirm that all required modules (
AccumulationChartComponent,AccumulationSeriesCollectionDirective,AccumulationSeriesDirective,PieSeries) are imported from@syncfusion/ej2-vue-charts. -
Version mismatch: Verify that the installed
@syncfusion/ej2-vue-chartspackage is compatible with your Vue 2 version. Check package.json for the correct version range.