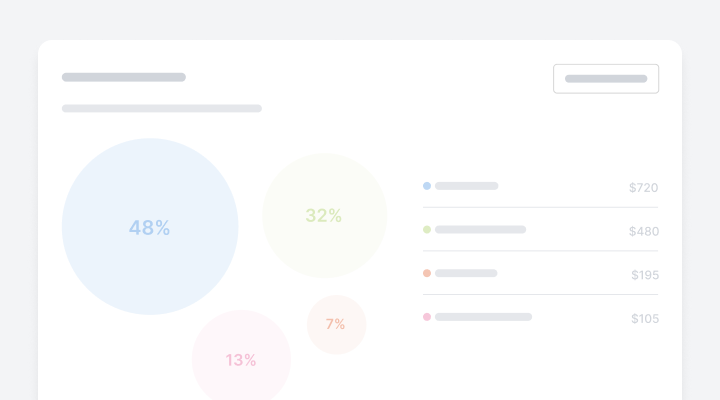
Bubble Chart
A bubble chart is a type of data visualization where data points are represented by circles on a two-dimensional plot. The x and y positions of each bubble indicate values for two separate variables. The size of each bubble conveys a third variable, adding an extra layer of insight. This allows for multivariable comparison within a single chart view. Bubble charts are useful for spotting trends, patterns, and outliers in complex datasets.