Getting Started with the ASP.NET MVC 3D Circular Chart Control
23 Jul 20266 minutes to read
This section briefly explains how to add the Syncfusion® ASP.NET MVC 3D Circular Chart control to an ASP.NET MVC 5 (.NET Framework) application using Visual Studio.
Prerequisites
Refer to the System requirements for ASP.NET MVC controls before creating the application.
Create an ASP.NET MVC application with HTML helper
You can create an ASP.NET MVC application using either of the following options:
Install the ASP.NET MVC NuGet package
To add Syncfusion® ASP.NET MVC controls in the application, open the NuGet Package Manager in Visual Studio by selecting Tools → NuGet Package Manager → Manage NuGet Packages for Solution. Search for Syncfusion.EJ2.MVC5 and install it.
Alternatively, you can use the Package Manager Console by navigating to Tools → NuGet Package Manager → Package Manager Console, and then run the following command:
Install-Package Syncfusion.EJ2.MVC5 -Version 34.1.29NOTE
Syncfusion® ASP.NET MVC controls are available on nuget.org. Refer to the NuGet packages topic to learn more about installing NuGet packages in various operating system environments. The
Syncfusion.EJ2.MVC5NuGet package depends on Newtonsoft.Json (≥ 12.0.2) for JSON serialization and Syncfusion.Licensing for validating the Syncfusion® license key.
Add the namespace
Add the Syncfusion.EJ2 namespace reference inside the <system.web.webPages.razor> → <pages> → <namespaces> element of the ~/Views/Web.config file.
<namespaces>
    <add namespace="Syncfusion.EJ2" />
</namespaces>
Add script resources
Add the script reference inside the <head> element of the ~/Views/Shared/_Layout.cshtml file as follows. The reference loads the base ej2.min.js bundle, which contains the Syncfusion® ASP.NET MVC helper scripts.
<head>
    ...
    <!-- Syncfusion ASP.NET MVC controls scripts -->
    <script src="https://cdn.syncfusion.com/ej2/34.1.29/dist/ej2.min.js"></script>
</head>
NOTE
Refer to the Adding Script Reference topic to learn different approaches for adding script references in an ASP.NET MVC application.
Register the Syncfusion® Script Manager
Register the script manager EJS().ScriptManager() at the end of the <body> element in the ~/Views/Shared/_Layout.cshtml file as follows. The Script Manager resolves and loads control-specific scripts automatically.
<body>
    ...
    <!-- Syncfusion ASP.NET MVC Script Manager -->
    @Html.EJS().ScriptManager()
</body>
Build the 3D Circular Chart
This section walks through adding the 3D Circular Chart control to ~/Views/Home/Index.cshtml and progressively binding data to it from ~/Controllers/HomeController.cs.
Step 1: Add the 3D Circular Chart control
Add the Syncfusion® ASP.NET MVC 3D Circular Chart control to the ~/Views/Home/Index.cshtml page.
@Html.EJS().CircularChart3D("container").Render()Press Ctrl + F5 on Windows or ⌘ + F5 on macOS to run the application. The 3D Circular Chart control will be rendered as an empty placeholder in the default web browser.
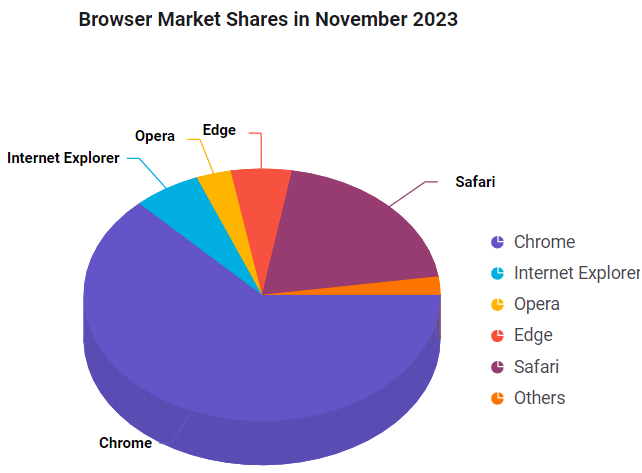
Step 2: Bind data with a Pie series
By default, a pie series is rendered when JSON data is assigned to the series using the DataSource property. Map the field names in the JSON data to the XName and YName properties of the series.
@model List<CircularChart3DSample.Controllers.CircularChartData>

@Html.EJS().CircularChart3D("container").Tilt(-45).Title("Browser Market Shares in November 2023"
).Series(series =>
{
    series.XName("X").YName("Y").DataLabel(dl => dl.Visible(true).Position(Syncfusion.EJ2.Charts.CircularChart3DLabelPosition.Outside).Name("X").Font(ft => ft.FontWeight("600"))
    .ConnectorStyle(cl => cl.Length("40px"))).DataSource(Model).Add();
}
).LegendSettings(leg => leg.Visible(true).Position(Syncfusion.EJ2.Charts.LegendPosition.Right)).Render()
public class HomeController : Controller
{
public ActionResult Index()
{
List<CircularChartData> circularData = new List<CircularChartData>
{
new CircularChartData { X = "Chrome", Y = 62.92 },
new CircularChartData { X = "Internet Explorer", Y = 6.12 },
new CircularChartData { X = "Opera", Y = 3.15 },
new CircularChartData { X = "Edge", Y = 5.5 },
new CircularChartData { X = "Safari", Y = 19.97 },
new CircularChartData { X = "Others", Y = 2.34 }
};
return View(circularData);
}
}
public class CircularChartData
{
public string X { get; set; }
public double Y { get; set; }
}Press Ctrl + F5 on Windows or ⌘ + F5 on macOS to run the application. The Syncfusion® ASP.NET MVC 3D Circular Chart control will be rendered with the bound data in the default web browser.
Troubleshooting
If the 3D Circular Chart control does not render as expected, review the following common issues and their resolutions.
-
“Script Manager is not defined” or scripts run twice —
@Html.EJS().ScriptManager()was not added, or was added more than once. EnsureScriptManageris registered exactly once at the end of<body>in_Layout.cshtml. -
Chart renders but no slices appear —
XName/YNamedo not match the property names in the data source. Property names are case-sensitive; verify they match the model property names exactly (e.g.,X,Y). -
CS0103: The name 'X' does not existorCS0206compile errors —CircularChartDatawas declared with public fields (public string X;) and then initialized using object-initializer syntax that requires properties. Change the fields to auto-properties (public string X { get; set; }). -
Newtonsoft.Jsonreference error after upgrade —Syncfusion.EJ2.MVC5requiresNewtonsoft.Json≥ 12.0.2. Install a compatible version via NuGet.