Getting Started with the ASP.NET MVC Accumulation Chart
7 Aug 20265 minutes to read
This section briefly explains how to add the Syncfusion® ASP.NET MVC Accumulation Chart control to an ASP.NET MVC application using Visual Studio.
Prerequisites
Refer to the System requirements for ASP.NET MVC controls before creating the application.
Create an ASP.NET MVC Application with HTML Helper
You can create an ASP.NET MVC application using either of the following options:
Install the ASP.NET MVC NuGet Package
To add Syncfusion® ASP.NET MVC controls in the application, open the NuGet Package Manager in Visual Studio by selecting (Tools → NuGet Package Manager → Manage NuGet Packages for Solution). Search for Syncfusion.EJ2.MVC5 and install it.
Alternatively, you can use the Package Manager Console by navigating to:
Tools → NuGet Package Manager → Package Manager Console, and then run the following command:
Install-Package Syncfusion.EJ2.MVC5 -Version 34.2.2Syncfusion® ASP.NET MVC controls are available on nuget.org. Refer to the NuGet packages topic to learn more about installing NuGet packages in various operating system environments. The Syncfusion.EJ2.MVC5 NuGet package depends on Newtonsoft.Json for JSON serialization and Syncfusion.Licensing for validating the Syncfusion® license key.
Add the Namespace
Add the Syncfusion.EJ2 namespace reference in the Web.config file available in the Views folder.
<namespaces>
    <add namespace="Syncfusion.EJ2" />
</namespaces>
Add Script Resources
Add the script reference inside the <head> element of the ~/Views/Shared/_Layout.cshtml file as follows.
<head>
    ...
    <!-- Syncfusion ASP.NET MVC controls scripts -->
    <script src="https://cdn.syncfusion.com/ej2/34.2.2/dist/ej2.min.js"></script>
</head>
Refer to the Adding Script Reference topic to learn different approaches for adding script references in an ASP.NET MVC application.
Register the Syncfusion® Script Manager
Register the script manager EJS().ScriptManager() at the end of the <body> element in the ~/Views/Shared/_Layout.cshtml file as follows.
<body>
    ...
    <!-- Syncfusion ASP.NET MVC Script Manager -->
    @Html.EJS().ScriptManager()
</body>
Add the ASP.NET MVC Accumulation Chart Control
Add the Syncfusion® ASP.NET MVC Accumulation Chart control to the ~/Views/Home/Index.cshtml page.
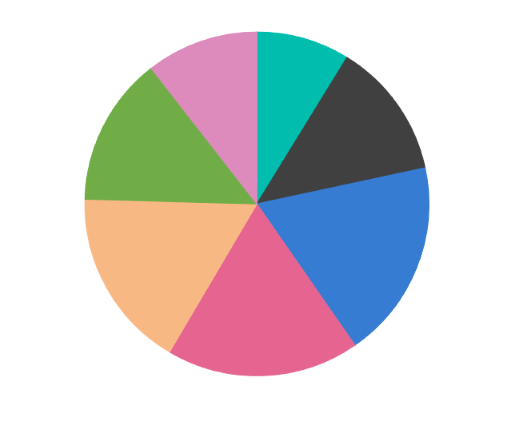
By default, a pie series is rendered when JSON data is assigned to the series using the dataSource property. Map the field names in the JSON data to the xName and yName properties of the series.
@(Html.EJS().AccumulationChart("container")
    .LegendSettings(legend => legend.Visible(false))
    .Series(series =>
    {
        series.XName("xValue")
            .YName("yValue")
            .DataSource(ViewBag.dataSource)
            .Add();
    })
    .Render()
)
public ActionResult Index()
{
List<PieChartData> chartData = new List<PieChartData>
{
new PieChartData { xValue = "Chrome", yValue = 15, text = "15", fill = "#00BDAE" },
new PieChartData { xValue = "UC Browser", yValue = 22, text = "22", fill = "#404041" },
new PieChartData { xValue = "iPhone", yValue = 32, text = "32", fill = "#357CD2" },
new PieChartData { xValue = "Safari", yValue = 31, text = "31", fill = "#E56590" },
new PieChartData { xValue = "Firefox", yValue = 29, text = "29", fill = "#F8B883" },
new PieChartData { xValue = "Edge", yValue = 24, text = "24", fill = "#70AD47" },
new PieChartData { xValue = "Others", yValue = 18, text = "18", fill = "#D77FB3" }
};
ViewBag.dataSource = chartData;
return View();
}
public class PieChartData
{
public string xValue;
public double yValue;
public string text;
public string fill;
}Press Ctrl + F5 on Windows or ⌘ + F5 on macOS to run the application. The Syncfusion® ASP.NET MVC Accumulation Chart control will be rendered in the default web browser.
Explore the sample on GitHub to understand how this getting started example works.