Getting Started with ASP.NET Core
17 Feb 20227 minutes to read
You can explore some useful features in the Maps component using the following video.
Prerequisites
To get start with ASP.NET Core application, need to ensure the following software to be installed on the machine.
- Visual Studio 2017
- DotNet Core 2.0
Setup ASP.NET Core application with Essential JS 2 for ASP.NET Core
The following steps to create ASP.NET Core Application.
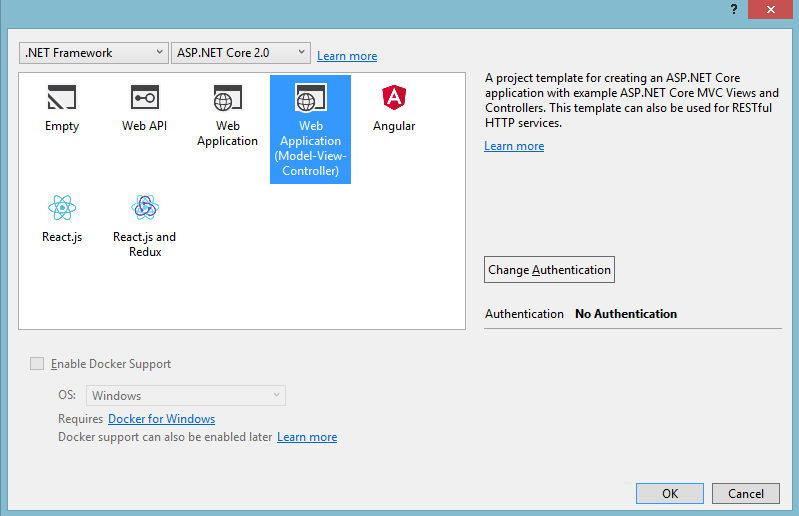
Step 1: Create ASP.NET Core Web Application with default template project in Visual Studio 2017.
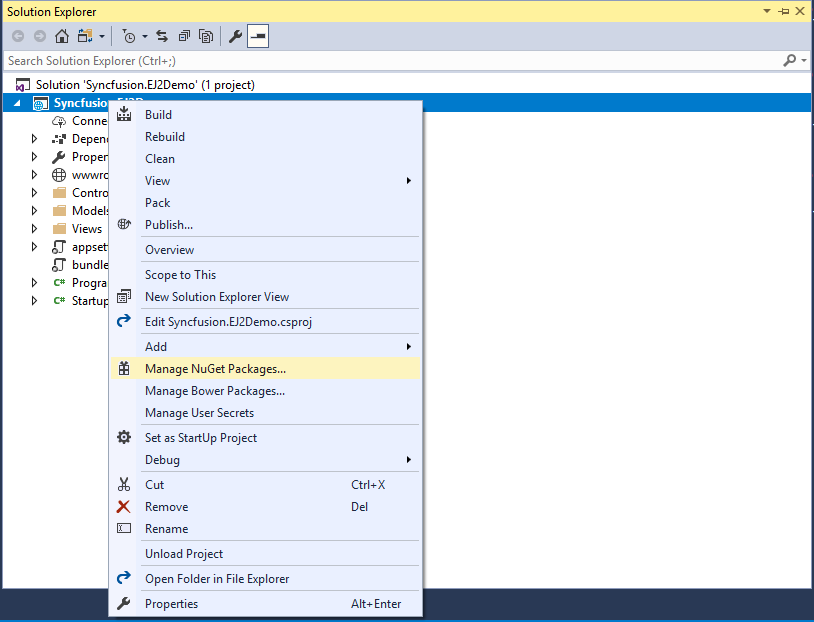
Step 2: Once your project created. We need to add Syncfusion EJ2 package into your application by using Nugget Package Manager.
Open the nuGet package manager.
Install the Syncfusion.EJ2 package to the application
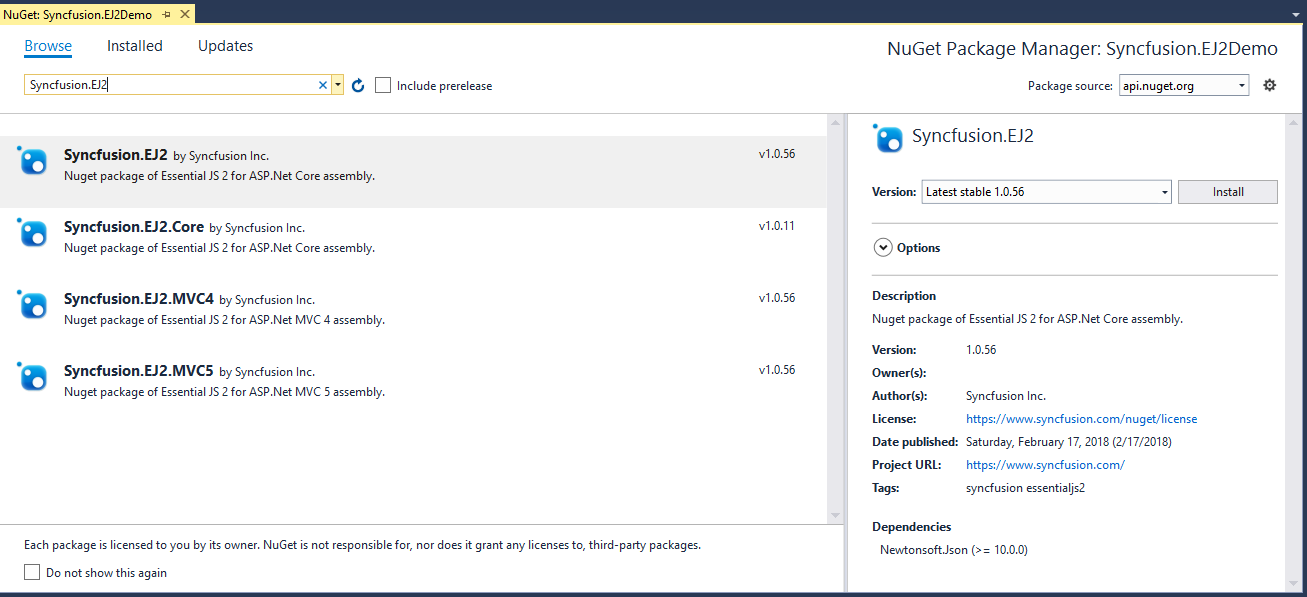
After Installation complete this will included in the project. You can refer it from the Project Assembly Reference.
We need to install NewtonSoft.JSON as dependency since it Syncfusion.EJ2 dependent to NewtonSoft.JSON package.
Step 3: Open the _ViewImports.cshtml to import Syncfusion.EJ2 package.
@addTagHelper *, Syncfusion.EJ2Step 4: Add client side resource through CDN or local package in the layout page _Layout.cshtml.
@* Syncfusion Essential JS 2 Scripts *@
<script src="https://cdn.syncfusion.com/ej2/dist/ej2.min.js"></script>
Step 5: Adding Script Manager in layout page _Layout.cshtml.
<ejs-scripts></ejs-scripts>Step 6: Add the below code to your Index.cshtml view page which is present under Views/Home folder, to initialize the maps.
@using Syncfusion.EJ2;
 <ejs-maps id="maps">
</ejs-maps>
Render shapes from GeoJSON data
This section explains how to bind GeoJSON data to the map.
public IActionResult Default()
{
    ViewBag.mapdata = GetUSMap();
    return View();
}
public object GetUSMap()
{
    string allText = System.IO.File.ReadAllText("./wwwroot/scripts/MapsData/USA.json");
    return JsonConvert.DeserializeObject(allText);
}
Elements in the maps will be rendered in the layers. So, add a layer collection to the maps by using the[layers]property. Now bind the GeoJSON data to the [shapeData] property.
@using Syncfusion.EJ2;
 <ejs-maps id="maps">
    <e-maps-layers>
        <e-maps-layer shapeData="ViewBag.usmap">
        </e-maps-layer>
    </e-maps-layers>
</ejs-maps>
Bind data source to map
The following properties in layers are used for binding data source to map.
- [
dataSource] - [
shapeDataPath] - [
shapePropertyPath]
The [dataSource] property takes collection value as input. For example, a list of objects can be provided as input. This data is further used in tooltip, data label, bubble, legend and color mapping.
The [shapeDataPath] property is used to reference the data ID in dataSource. Whereas, the [shapePropertyPath] property is used to reference the column name in shapeData to identify the shape. Both properties are related to each other. When the values of the shapeDataPath property in the dataSource property and the value of shapePropertyPath in the shapeData property match, then the associated object from the dataSource is bound to the corresponding shape.
The JSON object “electionData” is used as data source as follows.
@using Syncfusion.EJ2;
 <ejs-maps id="maps" load="window.onMapLoad" shapeSelected="window.shapeSelected">
    <e-maps-layers>
        <e-maps-layer dataSource="ViewBag.electiondata" shapeData="ViewBag.usmap" shapeDataPath="State" shapePropertyPath="name">
        </e-maps-layer>
    </e-maps-layers>
</ejs-maps>
Apply color mapping
The color mapping feature supports customization of shape colors based on the underlying value of shape received from the bound data. Specify the field name from which the values have to be compared for the shapes in the [colorValuePath] property in [shapeSettings].
Specify the color and value in the [colorMapping] property. Here ‘#D84444’ is specified for ‘Trump’ and ‘#316DB5’ is specified for ‘Clinton’.
@using Syncfusion.EJ2.Maps;

@{
    var propertyPath = new[] { "name" };
    var colormapping = new List<Syncfusion.EJ2.Maps.MapsColorMapping> {
        new  MapsColorMapping{ Color = "#EDB46F",Value= "Permanent"  },
        new MapsColorMapping { Color= "#F1931B", Value = "Non-Permanent" }
    };
}

<ejs-maps id="maps">
    <e-maps-layers>
        <e-maps-layer dataSource="ViewBag.electiondata" shapeData="ViewBag.worldmap" shapeDataPath="Country" shapePropertyPath="propertyPath">
            <e-layersettings-shapesettings colorValuePath="Membership" fill="#E5E5E5" colorMapping="colormapping"></e-layersettings-shapesettings>
        </e-maps-layer>
    </e-maps-layers>
</ejs-maps>
Add title to maps
You can add a title using the [titleSettings] property to the map to provide information to the user about the shapes rendered in the map.
@{
    var titleStyle = new MapsFont
    {
        Size = "10px",
        Color = "red",
        FontFamily = "Sans-serif "
    };
}

<ejs-maps id="maps">
    <e-maps-titlesettings text="Maps component" textStyle="titleStyle"></e-maps-titlesettings>
    <e-maps-layers>
        <e-maps-layer shapeData="ViewBag.usmap">
        </e-maps-layer>
    </e-maps-layers>
</ejs-maps>
Enable legend
You can enable the legend for the maps by setting the [visible]
property to true in [legendSettings] object.
@using Syncfusion.EJ2.Maps;

@{
    var propertyPath = new[] { "name" };
    var colormapping = new List<Syncfusion.EJ2.Maps.MapsColorMapping> {
        new  MapsColorMapping{ Color = "#EDB46F",Value= "Permanent"  },
        new MapsColorMapping { Color= "#F1931B", Value = "Non-Permanent" }
    };
}

<ejs-maps id="maps">
    <e-maps-legendsettings visible="true" position="Top"></e-maps-legendsettings>
    <e-maps-layers>
        <e-maps-layer dataSource="ViewBag.electiondata" shapeData="ViewBag.world" shapeDataPath="Country" shapePropertyPath="propertyPath">
            <e-layersettings-shapesettings colorValuePath="Membership" fill="#E5E5E5" colorMapping="colormapping"></e-layersettings-shapesettings>
        </e-maps-layer>
    </e-maps-layers>
</ejs-maps>
Add data label
You can add data labels to show additional information of the shapes in map. This can be achieved by setting the [visible] property to true in the [dataLabelSettings] object.
@using Syncfusion.EJ2.Maps;

<ejs-maps id="maps">
    <e-maps-layers>
        <e-maps-layer shapeData="ViewBag.usmap">
            <e-layersettings-datalabelsettings visible="true" labelPath="name" smartLabelMode="@Syncfusion.EJ2.Maps.SmartLabelMode.Trim"></e-layersettings-datalabelsettings>
            <e-layersettings-shapesettings autofill="true"></e-layersettings-shapesettings>
        </e-maps-layer>
    </e-maps-layers>
</ejs-maps>
Enable tooltip
The tooltip is used when you cannot display the information by using the data labels due to space constraints.
You can enable tooltip by setting the [visible] property to true
in [tooltipSettings] object.
@using Syncfusion.EJ2.Maps;

<ejs-maps id="maps">
    <e-maps-layers>
        <e-maps-layer shapeData="ViewBag.usmap">
            <e-layersettings-datalabelsettings visible="true" labelPath="name" smartLabelMode="@Syncfusion.EJ2.Maps.SmartLabelMode.Trim">
            </e-layersettings-datalabelsettings>
            <e-layersettings-tooltipsettings visible="true" valuePath="name"></e-layersettings-tooltipsettings>
            <e-layersettings-shapesettings autofill="true"></e-layersettings-shapesettings>
        </e-maps-layer>
    </e-maps-layers>
</ejs-maps>